Natural Science
Vol.5 No.1A(2013), Article ID:27616,5 pages DOI:10.4236/ns.2013.51A020
Weather extremes from anthropogenic global warming
![]()
AF Research Laboratory Emeritus, Wright-Patterson AFB, USA; paulcarr@alum.mit.edu
Received 29 November 2012; revised 30 December 2012; accepted 15 January 2013
Keywords: Climate Change; Weather Extremes; Global Warming; Carbon Emissions
ABSTRACT
Although sea levels are predicted to rise 1 to 2 meters by 2100, the more immediate effects of global warming are weather extremes. The number of natural disasters since 1996 costing $1 billion or more doubled compared with the previous 15-year period. Extreme summer heat anomalies now cover about 10% of land area, up from 0.2% in 1950-1980. The human influence on global warming is evident from climate data and physical modeling. Since the beginning of the industrial era, carbon dioxide (CO2) increases correlate with those of temperature. Carbon dating shows that the CO2 increase is from burning ancient fossil fuels. Increasing CO2 and other greenhouse gases blanket and warm the earth’s surface, allowing less heat to reach the stratosphere, which is cooling. This is consistent with satellite measurements showing that solar irradiance is not changing. The present CO2 rate increase of 2 ppm/year is 300 times higher than the rate at which the earth recovered from the ice age 18,000 years ago. Without the radiative forcing of noncondensing persistent CO2, the terrestrial greenhouse would collapse, plunging the global climate into an icebound earth state. Will new technologies lower our carbon emissions in time to prevent more weather extremes? Electric cars now get the equivalent of 100 miles per gallon. The cost of electricity from solar photovoltaic cells has reached grid parity.
1. INTRODUCTION
Sea levels are rising and are projected to increase 1 to 2 meters by 2100. Global coastal cities and populations will be flooded out [1]. The more immediate effects of global warming, however, are weather extremes [2]. The last 12 months were the warmest on record with a mean temperature 2.1˚C above the 20th century average. Extreme summer heat anomalies now cover about 10% of land area, up from 0.2% in 1950-1980 [3].
Hurricanes, floods, droughts, and wildfires continue to increase [4]. According to the National Oceanic and Atmospheric Administration (NOAA) [5], the number of extreme weather events costing over $1 billion, whose average since 1980 has been 3 to 4 per year, has increased to 9 in 2008 and 13 in 2011. The number of natural disasters since 1996 costing $1 billion or more doubled compared with the previous 15-year period [2].
On Oct. 17, 2012, Munich Re, the world’s largest reinsurance firm, issued a report titled “Severe Weather in North America [6].” Globally, the rate of extreme weather events is rising, and “nowhere in the world is the rising number of natural catastrophes more evident than in North America.” From 1980 through 2011, weather disasters caused losses totaling $1.06 trillion. Humanclimate change “is believed to contribute to this trend,” the report said, “though it influences various perils in different ways.”
2. UNUSUALLY WET OR DRY ARE BECOMING MORE USUAL
Droughts, heat waves, and heavy precipitation will increase from global warming according to the 2011 report [7] of the United Nations Intergovernmental Panel on Climate Change (IPCC) of 220 scientists from 62 countries Their conclusions are as follows.
- Economic losses from weather & climate-related disasters vary from year to year and place to place, but overall have increased.
- Higher temperatures heat normally dry regions increasing evaporating and making them more susceptible to wildfires.
- Higher temperatures enable our weather systems to carry more moisture, causing wet regions to get more rain than normal.
- Higher temperatures increase the wind speeds and destructiveness of tornadoes and hurricanes.
Hurricanes: Katrina is an example (Figure1). In 2005, its path showed the influence of the record high temperatures in the Gulf of Mexico. Katrina approached the southern tip of Florida as a tropical storm. Katrina continued west over the Gulf and then turned Northwest where the high temperature water transferred its energy to Category 5 winds speeds that did $146 billion of damage to New Orleans.
Hurricane physics is that of a Carnot cycle heat engine [8]. The heat source, the high-temperature sea surface at T = 300˚ K (27˚C), transfers wind energy to the hurricane. The heat sink is the cooler upper atmosphere, T = 200˚ K (−73˚C).
Was hurricane Katrina part of a trend? It is according to the data shown in Figure 2. Since 1995 both the average values of sea surface temperature and the power destruction of hurricanes have increased [8].
Droughts: This year’s draught in our Midwest, the worst since the dustbowl, is raising corn prices to the highest level in history. Fifty-two percent of the United States is affected with a $20 - $25 B loss in crop insurance. In 2007-2008, grain and soybean prices more than doubled, leading to food riots and unrest in some 60 countries. In 2010-2011, another price spike helped fuel the Arab Spring [9].
Wildfires: The effects of global warming on temperature, precipitation levels, soil drying, and Western Pine beetles are turning many forests into kindling for more wildfires. Western Pine beetles can now survive the warmer winters [10,11]
Hot extremes, which covered much less than 1% of Earth’s surface from 1951-1980, now typically cover about 10% of the land area. It can now be stated, with a high degree of confidence, that extreme anomalies such as those in Texas and Oklahoma in 2011 and Moscow in 2010 were a consequence of global warming. This is because their likelihood, in the absence of global warm-
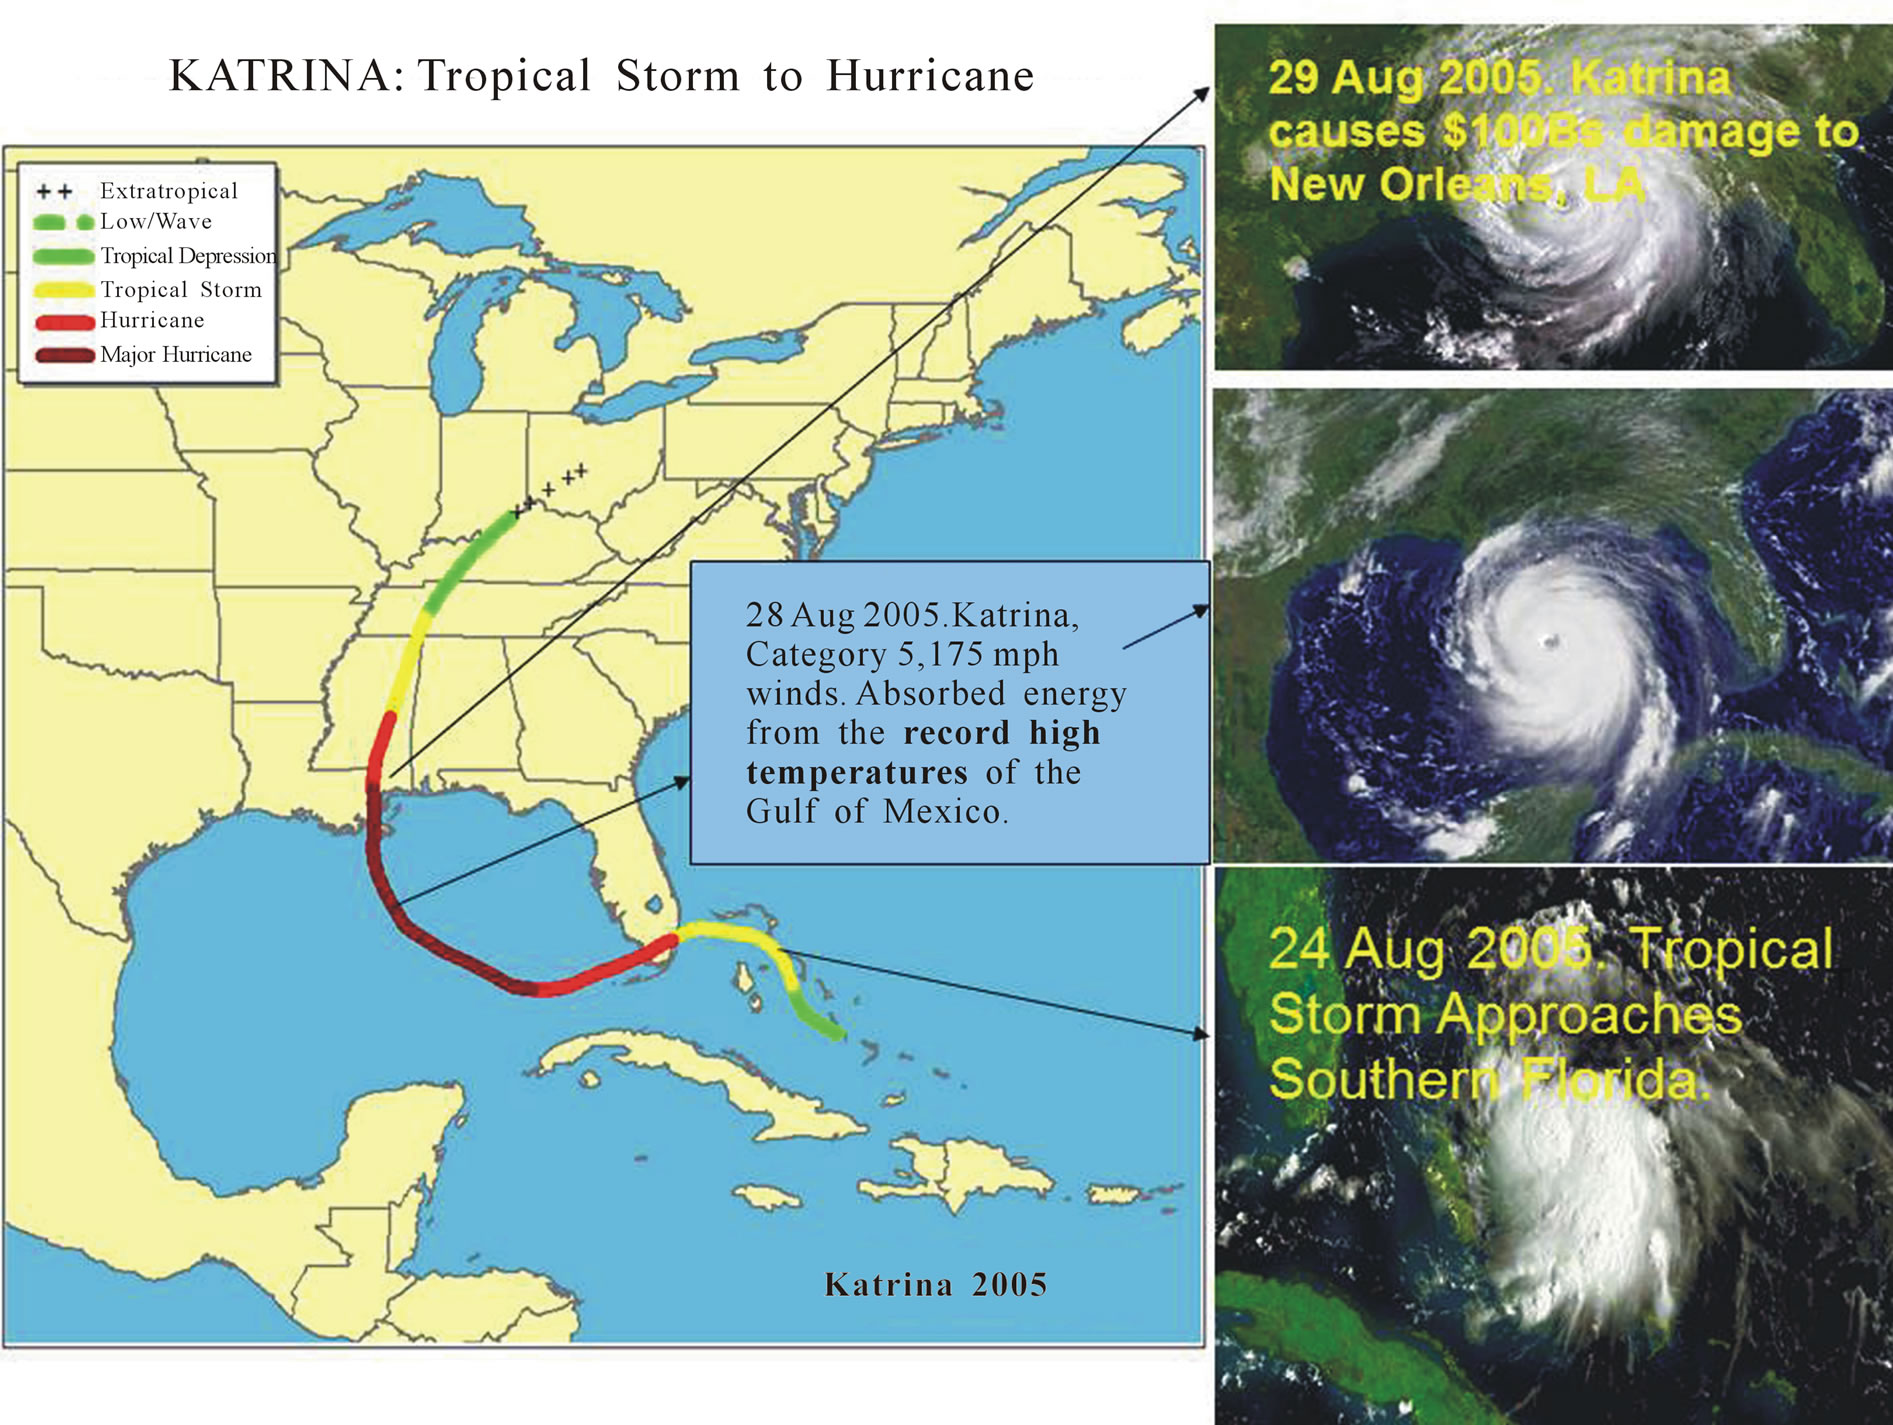
Figure 1. The record high temperatures in the Gulf of Mexico energized a tropical storm to Category 5 hurricane Katrina.
ing, was exceedingly small [3].
3. HUMANS INFLUENCE GLOBAL WARMING
Let us examine the human influence on global warming, particularly since 1957, by (1) examining the climate data and (2) learning from physical modeling [12].
3.1. Examining Climate Data
Since the beginning of the industrial era, carbon dioxide (CO2) increases correlate with those of temperature, as can be seen from Figure 3.
Carbon isotope dating shows that the predominant CO2 increase comes from burning ancient fossil fuels [13]. Increased greenhouse gases (CO2, H2O, CH4, etc.) blanket and warm the earth’s surface, allowing less heat to reach the stratosphere, which is cooling according to NOAA satellite and radiosonde measurements [14]. This is consistent with the constancy of solar irradiance as
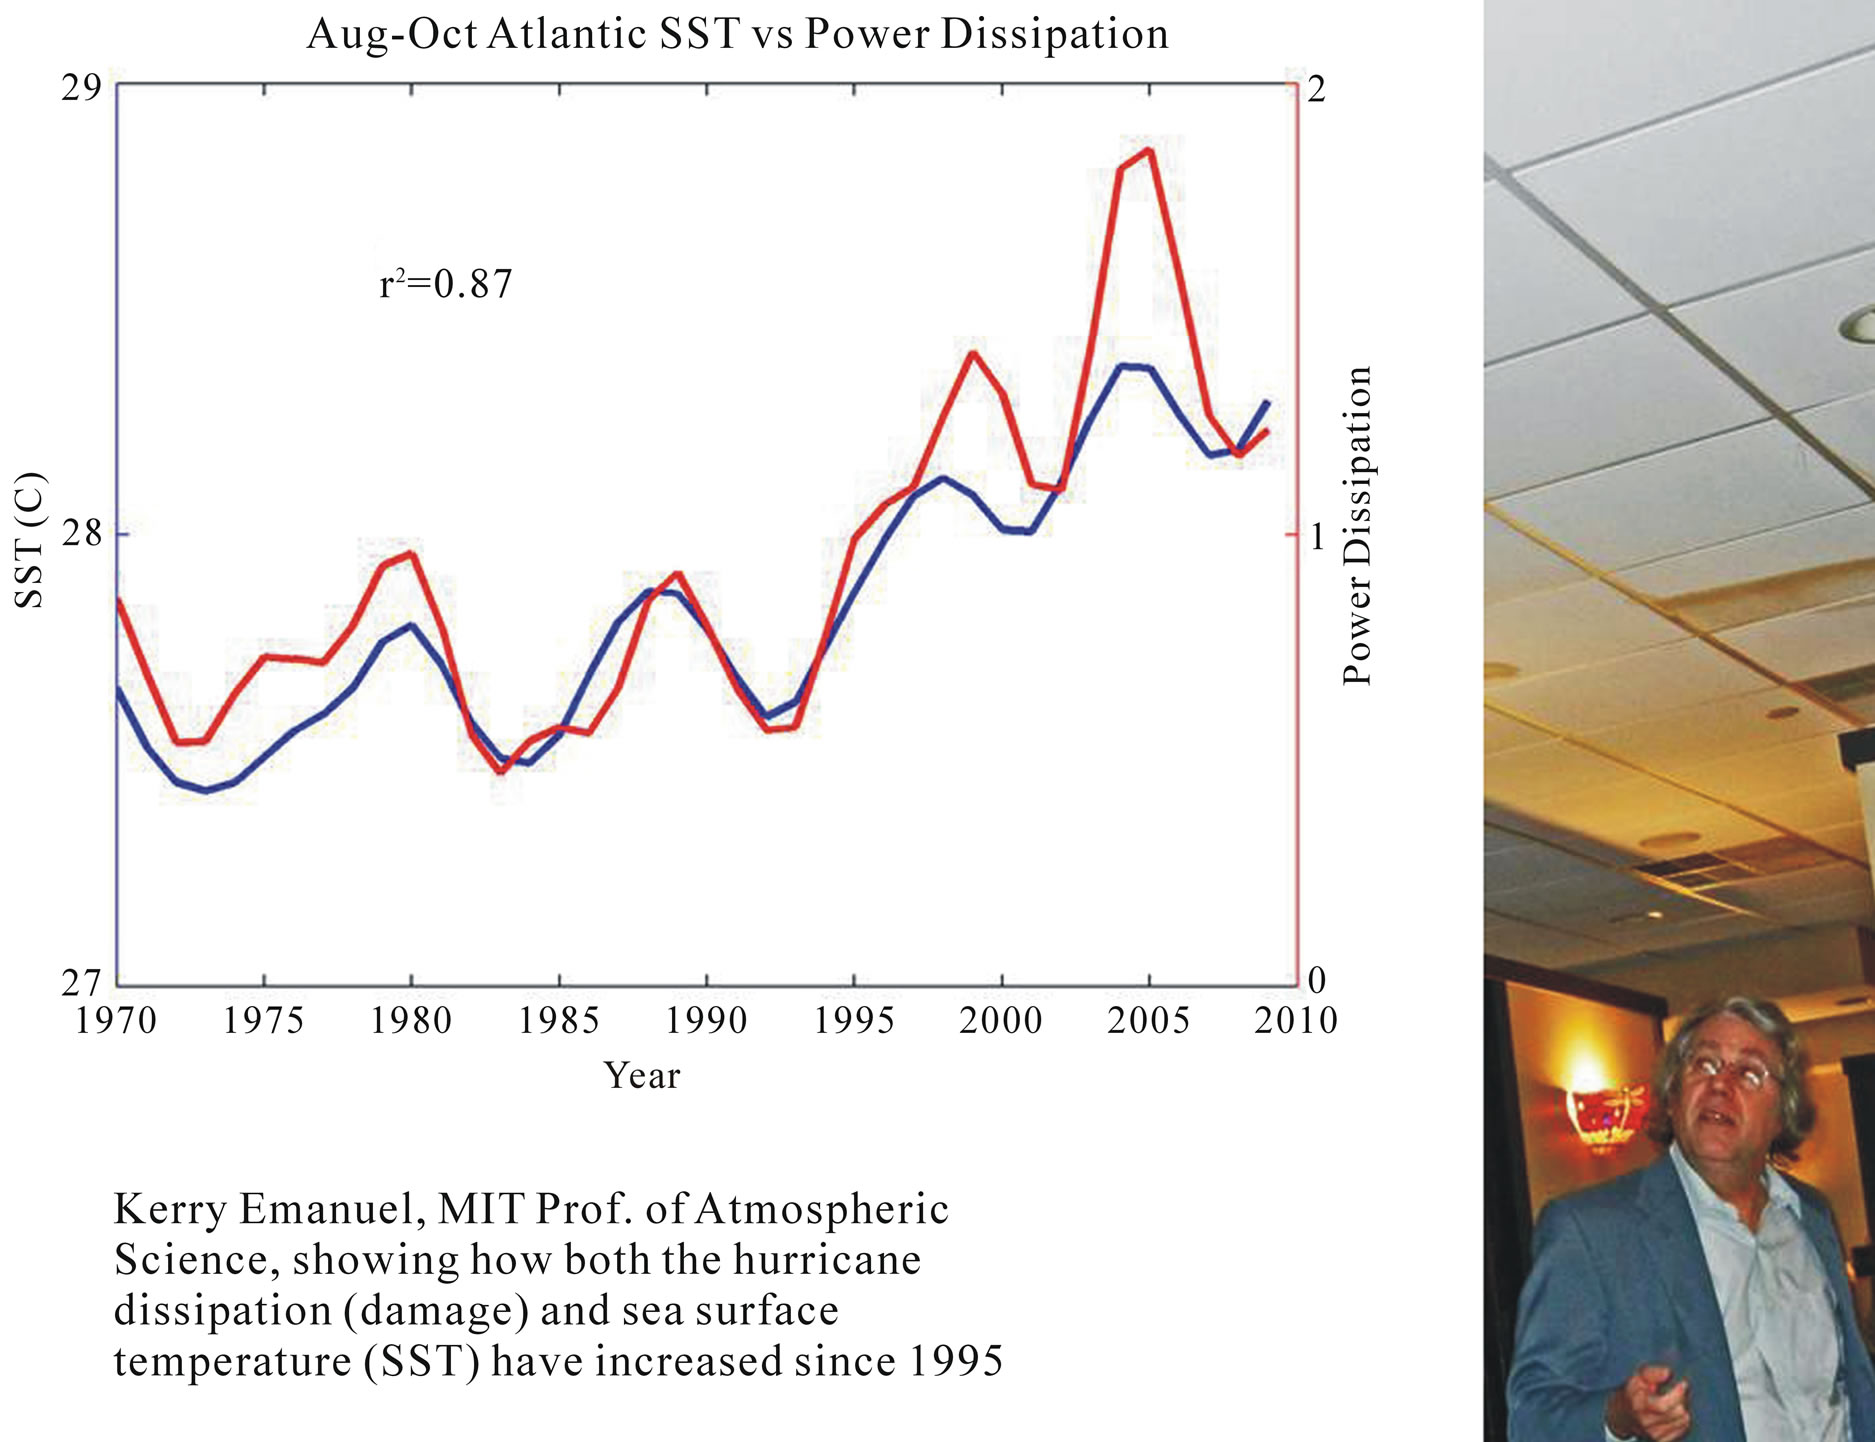
Figure 2. Hurricane dissipation (damage) and sea surface temperature have increased since 1995 [8].

Figure 3. From 1880 to 1980, temperature increased by 0.3˚C. The last 30 years, temperature increase by 0.55˚C.
measured by seven satellites since 1980 [15]. If the solar irradiance had been increasing, both the earth’s surface temperature and that of the stratosphere would be increasing.
The effect of the greenhouse effect in the earth’s atmosphere is apparent when we compare our climate to that of the moon, which has no heat trapping gasses. Daytime temperatures are 123˚C (396˚ Kelvin) and −233˚C (40˚ Kelvin) at night. The average is −65˚C (218˚ Kelvin). Even on cloudless nights, non-condensing, persistent, and increasing CO2, CH4, and time-variable, temperature dependent water vapor keep us warmer than on the moon.
The 391 ppm present level of CO2 is 30% greater than the highest level in the last 800,000 years [16]. The present CO2 rate increase of two ppm/year is 300 times higher than the rate at which the earth recovered from the ice age 18,000 years ago, as shown in Figure 4 [17,18].
Present CO2 rates extrapolate to 600 ppm by 2100. In the next millennia, sea levels could be hundreds of feet higher, as it was 51,000,000 years ago, when the earth’s poles were ice-free, and CO2 was 1000 ppm [19,20]. By 2100, present sea levels are projected to increase 2.5 - 6 ft [21].
UC Berkeley Physics Prof. Richard Muller, member American Academy of Arts & Sciences, was skeptical of conflicting temperature data and wanted to resolve “climategate” issues. He now leads a 10 person group, Berkeley Earth, which includes physics Nobel Laureate Paul Purlmutter [22]. The team is funded by private sources including the Bill Gates and the Koch Brothers.
Berkeley Earth also has carefully studied issues raised by skeptics, such as possible biases from urban heating, data selection, poor station quality, and data adjustment.
Berkeley Earth has demonstrated that these do not unduly bias the results.
Berkeley Earth also analyzed temperature records back mately 1.5 ± 0.5 34˚C per 100 Tg of atmospheric sulfate.

Figure 4. Global mean temperature, Antarctic temperature, and atmospheric CO2 all rose dramatically during the great deglaciation that ushered in the present Holocene Epoch 10,000 years ago. During the periods of steepest warming, the CO2 rise precedes the global temperature by several centuries [18].
This volcanism, combined with a simple proxy for anthropogenic effects (logarithm of the CO2 concentration), can account for much of the variation in the land surface temperature record; the fit is not improved by the addition of a solar forcing term. Thus, for this very simple model, solar forcing does not appear to contribute to the observed global warming of the past 250 years; the entire change can be accounted for by a sum of volcanism and anthropogenic proxies [22].
Berkeley Earth’s land temperature rise from the 1950s decade to the 2000 s decade is 0.87˚C ± 0.05˚C (95% confidence) is in agreement with the results reported by GISS, NOAA, HadCRU. The anthropogenic component is 0.4 to 0.8˚C, which is being refined by more data analysis.
3.2. Learning from Physical Modeling
As can be seen in Figure 5, greenhouse gases must be included to explain temperature increases since 1957 [23]. In the bottom dark gray curve, the natural forcing of volcanoes and solar variability are included, but the calculated temperate does not agree with the black observed curve after 1957. When anthropogenic greenhouse gases (mainly CO2) are included, the light gray curve agrees with that of the observed temperature. The CO2 increase from 1957 to 2000 of 52 ppm was over twice the increase from 1890 to 1957 (24 ppm).
This is the basis for the conclusion of the UN IPCC 2007 report: “From new estimates of the combined anthropogenic forcing due to greenhouse gases, aerosols and land surface changes, it is extremely likely (95% probable) that human activities have exerted a substantial net warming influence on climate since 1750 [21].”
This conclusion is supported by the paper “Atmospheric CO2: Principal Control Knob Governing Earth’s Temperature [24].
“Ample physical evidence shows that carbon dioxide (CO2) is the single most important climate-relevant greenhouse gas in Earth’s atmosphere. This is because CO2, like ozone, N2O, CH4, and chlorofluorocarbons, does not
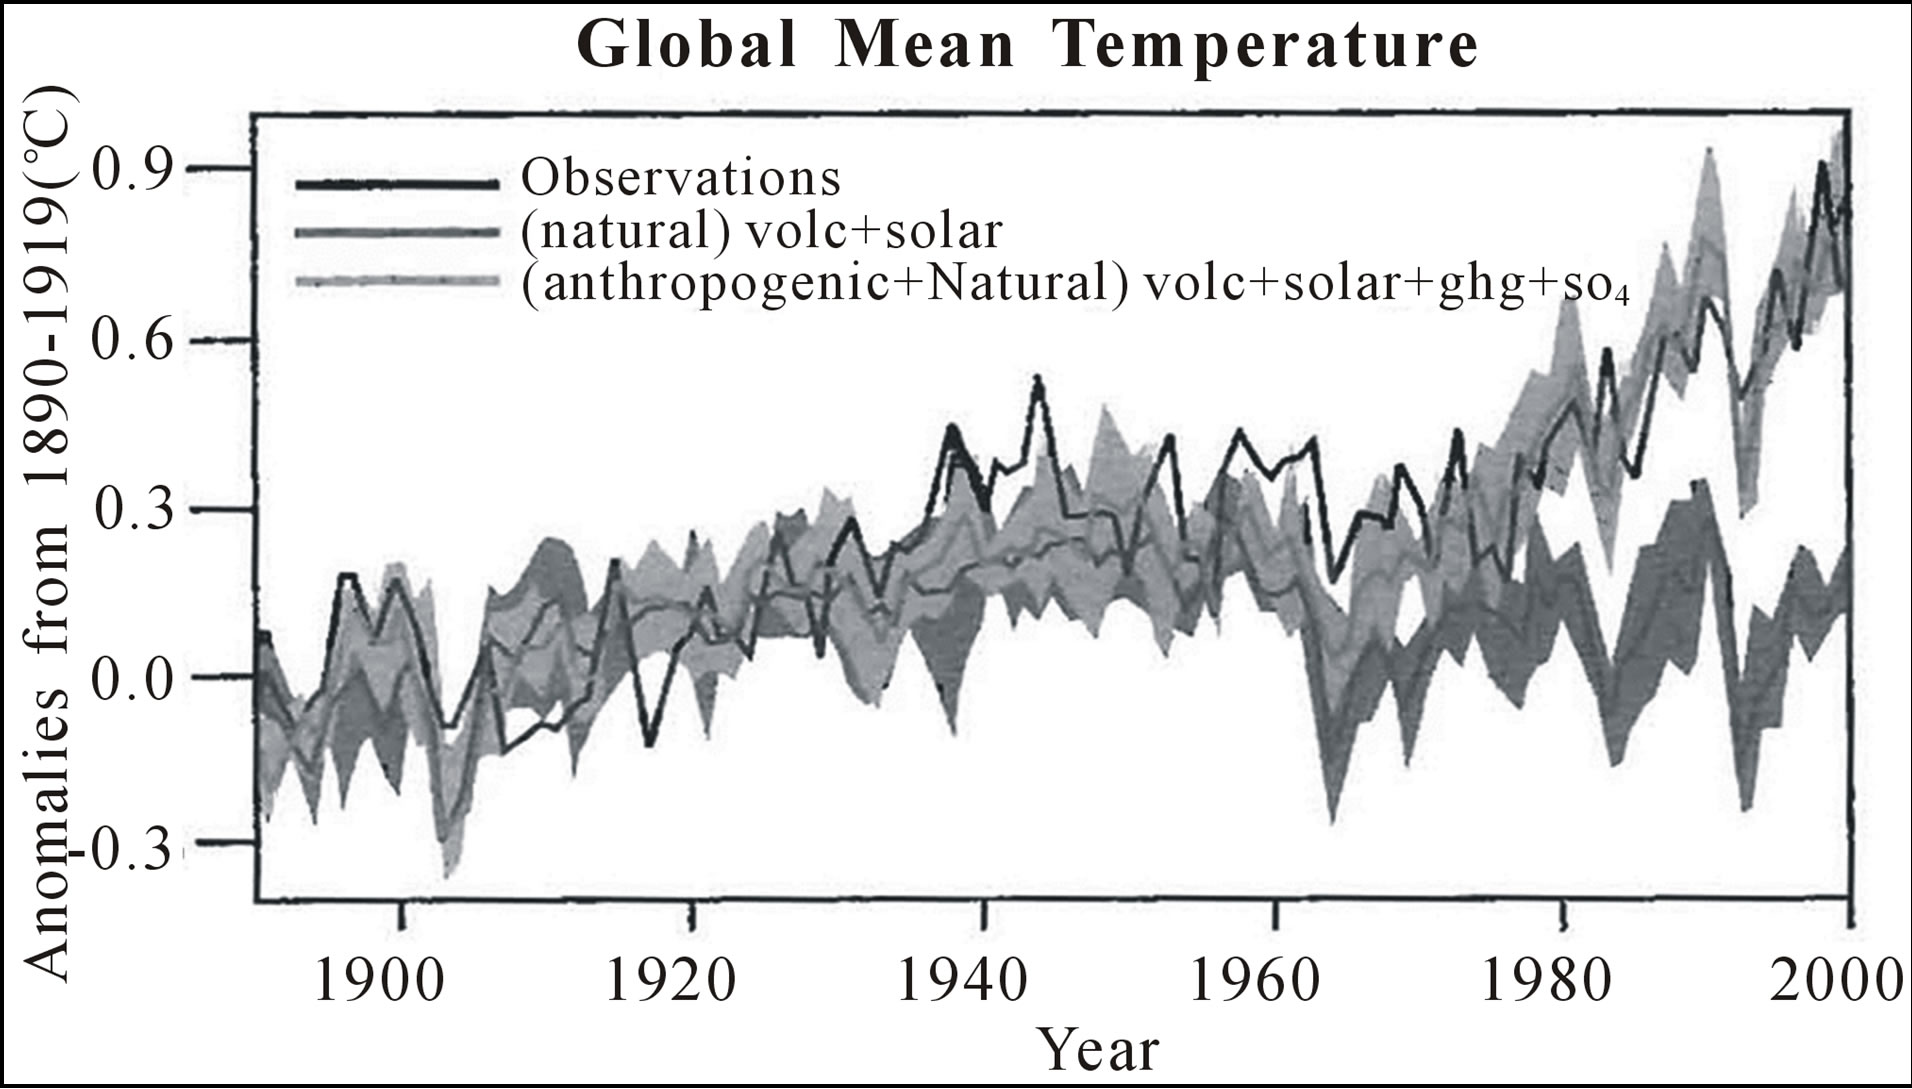
Figure 5. Anthropogenic greenhouse gases must be included to explain the observed temperature increase [23].
condense and precipitate from the atmosphere at current climate temperatures, whereas water vapor can and does. CO2 is persistent, having an atmospheric residence time of thousands of years.
Noncondensing greenhouse gases, which account for 25% of the total terrestrial greenhouse effect, thus serve to provide the stable temperature structure that sustains the current levels of atmospheric water vapor and clouds via feedback processes that account for the remaining 75% of the greenhouse effect. Computer modeling shows that without the radiative forcing supplied by CO2 and the other noncondensing greenhouse gases, the terrestrial greenhouse will collapse, plunging the global climate into an icebound Earth state.”
4. WILL WE REDUCE CARBON DIOXIDE EMISSIONS IN TIME?
From 1980 through 2011, weather disasters caused losses totaling $1.06 trillion, according to reinsurer Munich Re [6]. The economic interests of the coal and oil industries have trumped ecology. Carbon emitters are not paying for the true cost of their pollution. People whose homes are being destroyed by hurricanes, floods, wildfires, and tornadoes are.
In 2009 the US House of Representatives passed the Waxman-Markey bill, which placed a price on carbon, but the Senate did not. This cap-and-trade bill would have placed a limit or cap on the amount of carbon that a coal fired generating plant can emit. To exceed this limit, the coal plant would have to buy tradable permits. The price increase of coal-burning would give an economic advantage to non-carbon emitting geothermal, hydro, nuclear, wind, and solar energy sources. This energy is free, after capital and maintenance costs are paid, and will last until the sun burns out, billions of years from now.
“We have to figure out how to live without fossil fuels someday. Why not now, before we have destroyed the creation?” said Dr. James Hansen, Director of the NASA Goddard Space Science Institute [25]. “Coal burning is the biggest contributor to increases in carbon dioxide levels. Each year several hundred thousand people in the world die of air pollution from coal. If that many people died from a nuclear plant malfunction, we would shut them all down. A moratorium on building new coal plants without carbon sequestration and a phasing out of present ones within 20 years could enable our earth to recover a sustainable CO2 level.”
At present, the lower cost of natural gas is limiting the expansion of coal burning in the US. Natural gas burning emits about half the CO2 of coal and does not emit such health hazards as mercury and arsenic. The capital cost of natural gas generators is less than that of new coal plants and nuclear reactors. Natural gas has decreased in price due to new horizontal drilling and fracking technology. However, the amount of methane gas that leaks into the atmosphere has yet to be determined. Methane has about 30 times the greenhouse potency of CO2. Fracking is exempt from the clean-water regulations and has contaminated some local water supplies.
In the past few years China has surpassed the US as the world’s largest emitter of carbon dioxide. Nevertheless China has recently taken its first steps to build what is destined to be the world’s second-biggest emissions market [26]. This is boosting the prospects for fledgling programs from Australia to California. Guangdong province plans the largest of seven pilot programs for a proposed national market within three years. Exchanges will trade permits to emit an estimated 1 billion metric tons of greenhouse gases a year by 2015, close to half the volume in the European Union system. Will this and New York City’s Mayor Bloomberg’s recent endorsement of President Obama, because of his support of wind, solar, clean-air and increased vehicle mileage standards, lead to the passing of cap-and-trade legislation in the US?
The June 21, 2008 cover article in “The Economist” envisioned an oil-free transportation sector with electric vehicles charge by wind, solar, and nuclear power plants. This would also reduce the billion dollars per day we spend on imported foreign oil.
Electric cars like the Nissan Leaf, Mitsubishi-i, and Chevy Volt now get the equivalent of 100 miles per gallon. Hybrids typically get 50 mpg. The cost of solar PV cells has in the last year come down to 10 cents per kWhr, less than what most people can buy from the grid. Can these economical non-carbon emitting technologies be deployed in time to reduce the carbon emissions which are increasing climate extremes?
Conservation and efficiency can reduce our use of fossil fuels. Nature is the capital on which capitalism is based. In the long-term, our world’s economy will be constrained by ecology. The world’s exponential population explosion cannot continue indefinitely. There are indeed “Limits to Growth [27]”.
The environmental challenge is to balance the beauty of nature with its utility [28]. Is beauty “in the eye of the beholder” or/and an encounter with the Divine? Without divinely created beauty, nature becomes an object that may be ravaged. For example, a coal mine can be beautiful in the eye of its owner because it is a source of black gold. Can we re-envision beauty to transform our relationship with nature in time to lessen the impact of weather extremes and rising sea levels?
REFERENCES
- Pilkey, O.H. and Young, R. (2011) The rising sea. Island Press, Portsmouth.
- Barrett, P.M. (2012) Its global warming stupid. Bloomberg Business Report. http://www.businessweek.com/articles/2012-11-01/its-global-warming-stupid
- Hansen, J., Sato, M. and Ruedy, R. (2012) Perception of climate change. Proceedings of the National Academy of Sciences, 109, 14726-14727, E2415-E2423. doi:10.1073/pnas.1205276109
- Carr, P.H. (2012) Increasing hurricanes, droughts, and wildfires. American Physical Society Meeting, Williams College, 9 November 2012. http://mirrorofnature.org/WeatherExtremes.pdf
- Lubchenco, J. and Karl, T. (2012) Predicting and managing extreme weather events. Physics Today, 65, 31-37. doi:10.1063/PT.3.1475
- Munich Re (2012) Severe weather in North America. http://www.munichre.com/en/media_relations/press_releases/2012/2012_10_17_press_release.aspx
- Barros,V., Field, C., Qin, D. and Stocker, T. (2011) Special report for managing the risks of extreme events and disasters to advance climate change adaptation (SREX). http://ipcc-wg2.gov/SREX/
- Emanuel, K. (2008) The hurricane-climate connection. Bulletin of the American Meteorological Society, 89, ES10-ES20. ftp://texmex.mit.edu/pub/emanuel/PAPERS/Haurwitz_2008.pdf
- Lagi, M., Bertrand, K.Z. and Bar-Yam, Y. (2011) The food crises and political instability in North Africa and the Middle East. http://necsi.edu/research/social/foodcrises.html
- Westerling, A.L., et al. (2006) Warming and earlier spring increase western US forest wildfire. Science, 313, 940- 943. doi:10.1126/science.1128834
- Li, S. and Potter, C. (2012) Vegetation regrowth trends in post forest fire ecosystems across North America from 2000 to 2010. Natural Science, 4, 755-770. doi:10.4236/ns.2012.410100
- Carr, P.H. (2011) Data supporting anthropogenic global warming: Balancing ecology with economics. American Physical Society Meeting, Amherst, 19 November 2011. http://mirrorofnature.org/GlobalWarmingDebateNESAPS_summary.htm
- http://www.realclimate.org/index.php/archives/2004/12/how-do-we-know-that-recent-cosub2sub-increases-are-due-to-human-activities-updated/
- NOAA, Earth’s surface warming, stratosphere cooling. http://www.ncdc.noaa.gov/img/climate/globalwarming/ar4-fig-3-17.gif]
- Duffy, P.B., et al. (2009) Solar variability does not explain late 20th-century warming. Physics Today, 48.
- Mauna Loa Observatory, Scripps Institution of Oceanography. http://co2now.org/
- Schwarzschild, B.M. (2012) Carbon dioxide drove the ending of the last glacial epoch. Physics Today, 65, 16. doi:10.1063/PT.3.1588
- Shakun, J.D., et al. (2012) Global warming preceded by increasing carbon dioxide concentrations during the last deglaciation. Nature, 484, 49-54.
- Kunzig, R. (2011) Hothouse Earth: World without ice. National Georgraphic, 220, 90. http://ngm.nationalgeographic.com/2011/10/hothouse-earth/kunzig-text
- Pollack, H. (2009) A world without ice. Avery.
- Pachauri, R.K. and Reisinger, A., Eds. (2007) Fourth assessment report of the intergovernmental panel on climate change. IPCC, Geneva. http://www.ipcc.ch/publications_and_data/ar4/syr/en/spms2.html\
- Muller, R. (2012) Berkley Earth results summary. http://berkeleyearth.org/results-summary/
- Emanuel, K. (2007) What we know about climate change. The MIT Press, Cambridge.
- Lacis, A.A., et al. (2010) Atmospheric CO2: Principal control knob governing Earth’s temperature. Science, 330, 356-359. doi:10.1126/science.1190653
- Hansen, J.E. (2009) The climate challenge: Urgency of actions on coal emission. New Hampshire State House, Concord. http://www.columbia.edu/~jeh1/
- Jing, Y. and Scott, J. (2012) China carbon debut defies emission doubters. Bloomberg News, 12 October 2012.
- Meadows, D.H., Meadows, G., Randers, J. and Behrens III, W.W. (1972) The limits to growth. Universe Books, New York.
- Carr, P.H. (2006) The beauty of nature versus its utility: The environmental challenge. In: Beauty in Science and Spirit, Beech River Books, Center Ossipee.