Engineering
Vol.08 No.03(2016), Article ID:64562,17 pages
10.4236/eng.2016.83012
Improving the Reliability of a Domestic Refrigerator Compressor Subjected to Repetitive Loading
Seong-Woo Woo1, Dennis L. O’Neal2
1Reliability Association of Korea, Seoul, South Korea
2Engineering and Computer Science, Baylor University, Waco, USA

Copyright © 2016 by authors and Scientific Research Publishing Inc.
This work is licensed under the Creative Commons Attribution International License (CC BY).
http://creativecommons.org/licenses/by/4.0/


Received 5 January 2016; accepted 13 March 2016; published 16 March 2016
ABSTRACT
As a reliability quantitative specification, parametric accelerated life testing was used to assess the reliability of a newly designed compressor of a commercial refrigerator subjected to repetitive stresses. A generalized life-stress failure model and new sample size equation with a new load concept were derived starting with the basic refrigeration cycle. The sample size equation with the acceleration factor also enabled the parametric accelerated life testing to quickly evaluate the expected lifetime. The design of this testing should help an engineer uncover the design parameters affecting reliability during the design process of the compressor system. Consequently, it should help companies improve product reliability and avoid recalls due to the product failures in the field. A newly designed compressor in a commercial refrigerator was used as a test case.
Keywords:
Refrigeration System, Generalized Life-Stress Failure Model, Load Analysis, Sample Size Equation, Acceleration Factor, Parametric Accelerated Life Testing, Compressor, Suction Reed Valve

1. Introduction
Reliability describes the ability of a system or module to function under stated conditions for a specified period of time [1] . Reliability is often illustrated in a diagram called “the bathtub curve” shown as the top curve in Figure 1. The first part of the curve, called the “infant mortality period”, represents the introduction of the product in the market. In this period, there is a decreasing rate of failure. It is then followed by what is usually called the “normal” life period with a low but consistent failure rate. It then ends with a sharp increase in failures
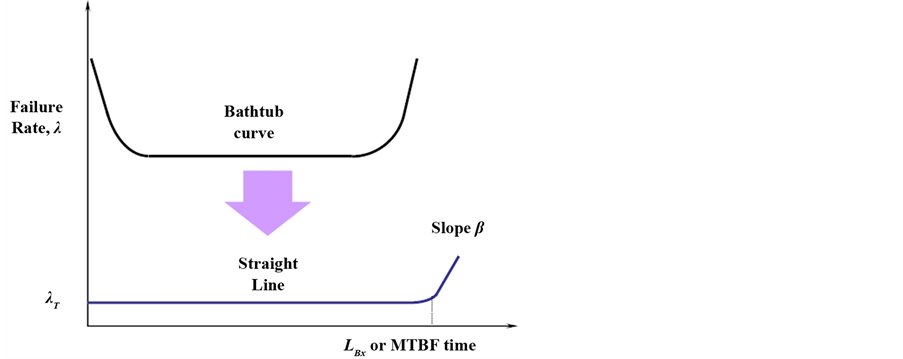
Figure 1. The bathtub curve and straight line with slope b.
as the product reaches the end of its useful life. If a refrigeration system or a major component in the system such as a compressor was to exhibit the failure profile in the bathtub curve with a large number of failures in the early life of its introduction, it would be difficult for the system to be successful in the marketplace. Improving the reliability of a system or component through systematic testing should reduce its failure rate from the traditional failure rate typified by the bathtub curve to the failure rate represented by a flat, straight line with the shape parameter β in Figure 1. With the second curve, there are low failure rates throughout the lifetime of the system or component until reaching the end of its useful life when the failure rate begins to increase.
The product reliability function can be quantified from the expected product lifetime LB and failure rate l in Figure 1 as follows:
 (1)
(1)
In a practical sense, this proportionality is applicable below about 20 percent of the cumulative failure rate [2] . Improving the design of a refrigeration system to increase its reliability can be achieved by quantifying the targeted product lifetime LB and failure rate l by finding the appropriate control parameters affecting reliability and then modifying the design with the results from parametric accelerated life testing (ALT).
In this study we present a new parametric accelerated life testing (ALT) method that can improve the reliability of the design of refrigeration systems. This testing method takes into account the fact that refrigeration system such as compressor with missing or improper design parameters can result in recalls and loss of brand name value. Based on the load analysis of a refrigeration system, we demonstrated the efficacy of our reliability design method. The method uses accelerated life testing and sample size equations, as a novel means of determining proper design parameters.
2. Parametric Accelerated Life Testing in a Refrigeration System
As can be seen in Figure 2, a refrigeration system can be split into numerous modules, components, and parts. Each of these has their own impact on the reliability of the refrigerator as a system. Evaluating and improving the expected life of a refrigerator requires an understanding of the life of individual modules and components.
Figure 3 shows the failure rate of a generic product system that includes three modules. If this were a refrigeration system, a module might include the cabinet, door, compressor, etc. Each module has its own failure rate over time and the overall failure rate of the product is the sum of the failure rates of the modules or subsystems that make up the product. The refrigeration system lifetime LB with multi-modules should be determined by module #3 in Figure 3 because this module has the shortest lifetime of the three. Therefore, it has the largest influence on the average life of the product. The cumulative failure rate of the refrigeration system over its lifetime would be the sum of the failure rate of each module.
Failure data from the field is an important determinant in developing an accelerated life testing plan (ALT). An ALT plan can be developed for a component or module of the system that has a high failure rate or short life.

Figure 2. Breakdown of a refrigeration system with its modules, components, and parts.
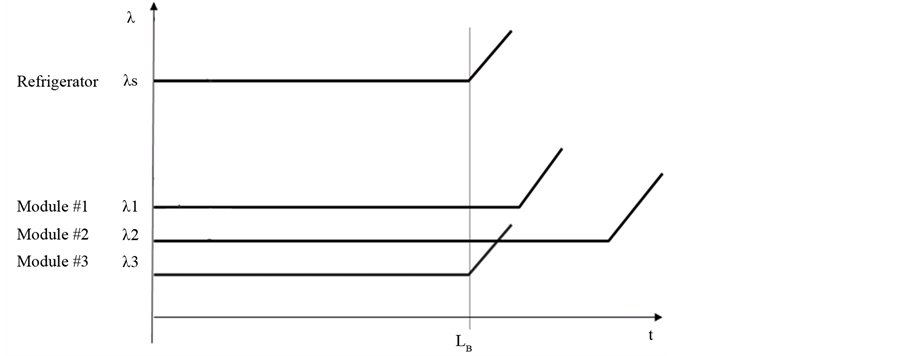
Figure 3. Refrigeration system lifetime LB and failure rate λs with modules.
This plan, if implemented properly, can reduce failure rates and improve reliability. In targeting the reliability of the refrigerator, there are three cases: the new design maintains a similar module, new module, and modified module to the prior design.
For example, consider the list of modules or components in the refrigerator listed in Table 1. As the biggest contributor to the unreliability of the refrigerator―the refrigeration system with a modified module, the yearly failure rate was 0.3%/year and lifetime, LBx was 4 years from the field data that was collected on the system. Because this was a modified design, the expected failure rate was 0.6%/year and the expected LBx life was 2.0. Two years was considered an unacceptably short lifetime, so a new target was set to increase the product lifetime to be

Table 1. Overall parametric ALT plan of refrigerator.
LBx 12 years with a yearly failure rate over the twelve years to be 1.0. The refrigerator reliability might be determined by summing the failure rates of each module and lifetimes of each module. The refrigerator reliability is targeted to be over a yearly failure rate of 1.1% and Bx 12 years.
The mechanisms of failure can be characterized by either loads (or stress) related failure or structural (or materials) related. For example, if there is a void in a shoulder fillet in the structure where the loads are applied, the structure can fracture at that location (see Figure 4). Failure of refrigeration systems can happen when the strength of materials composing the system structures yield with the loads applied to it. The load could be higher than the system was designed for or the material could be insufficient to handle repetitive loads to which it is subjected. That is, failure occurs when the stress is greater than the material strength, or when the material cannot withstand the loads. The refrigeration engineer would want to move the void in the structure to a location away from where the stress is applied. A reliability engineer should seek to redesign the structure to either: 1) move the loads, or 2) change the material shape and type to withstand the load. The failure site of the refrigeration structure such as the compressor might be identified when the failed products are taken apart in the field or could be after being subjected to a parametric ALT. The engineer often has to identify the failure by experiment using parametric ALT. This failure phenomenon and design might be applicable to both mechanical and electronic products because the electric products are typically housed in mechanical systems (Figure 4).
If one of the modules has a problem due to an improper design, then that module will determine the lifetime of the failed product. Ideally, the system goes from preliminary design to an optimized design in the design process (Figure 5 on the left side). Even if a detailed refrigeration system design is optimized using tools such as Finite Element Analysis (FEA), it may have still design flaws that don’t become evident until the system is in the field. In the field, the system may be subjected to forces and loads that could be very different than what was envisioned in the original design. Field data can be used by both the design engineer and test engineer to develop appropriate parameters for accelerated life tests that help validate the expected performance of the design. Figure 5 shows how for any system, design engineering needs to be effectively connected with test engineering to achieve the reliability target of a system, module, or subsystem.
A refrigeration system in a refrigerator consists of multiple modules. These modules can be put together as a subassembly and have an input and output for a vapor compressor cycle. As parameters and required input, robust design schematic of refrigeration system employs two experimental arrays: one for the control array (design) and the other for the noise array (loads). Optimizing over the control factors, optimal design data can be reduced to a signal (output)-to-noise (load) ratio. While there are multiple modules in a refrigeration system, ultimately, it is designed to produce cold air (see Figure 6).
If a refrigeration module such as compressor malfunctions, consumers will request that the module be replaced. Refrigeration system engineers often may not have a clear understanding of the way a consumer has used the refrigerator in the field. If the field usage patterns are fully understood, the laboratory could reproduce the usage patterns and failures found in the field. Before launching a product, an engineer should understand the usage patterns that the product will be subjected. If any problems are identified from the expected usage patterns, then the engineer could take corrective actions in the design of the product.
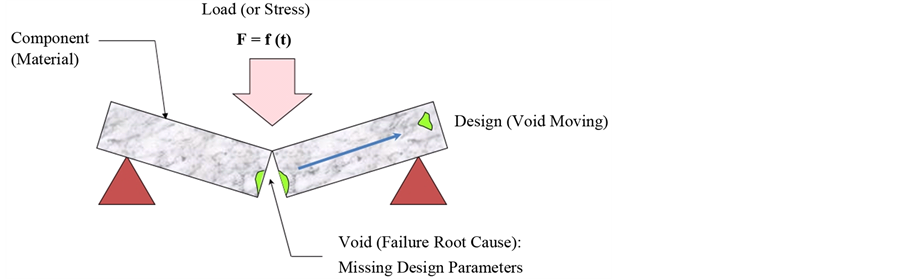
Figure 4. Failure mechanics and design concept on a refrigeration system.

Figure 5. Design process and reliability testing.
However, it may not be easy to identify all failure modes attributable to the particular design because the failure modes in the mechanical systems come from repetitive stresses which may not be found in its initial testing. Refrigeration system modules need to be robustly designed to withstand a variety of loads. Consequently, the refrigeration system module determines the control factors (or design parameters) to endure the noise factors (or stresses) so the system properly works. Ultimately, this will determine the reliability target of the module or part failure rate l and lifetime LB. Such reliability targeting is known to be conventionally achieved through the Taguchi methods (SDE) and the statistical design of experiment [3] - [8] .
For a simple refrigeration system structure, the Taguchi methods should take into account a considerable number of design parameters. In the design process, it may not be possible to consider the whole range of the load conditions that could affect the design. Well-designed parametric ALT methods could help determine the critical parameters affecting reliability of the refrigeration system so it can withstand a wide range of repetitive loads [9] - [20] .
To derive the life-stress model and acceleration factor, the time to failure (TF) can be estimated from the McPherson’s derivation [21] :
 (2)
(2)
where S is stress, Ea is activation energy, k is Boltzmann’s constant, and T is absolute temperature.
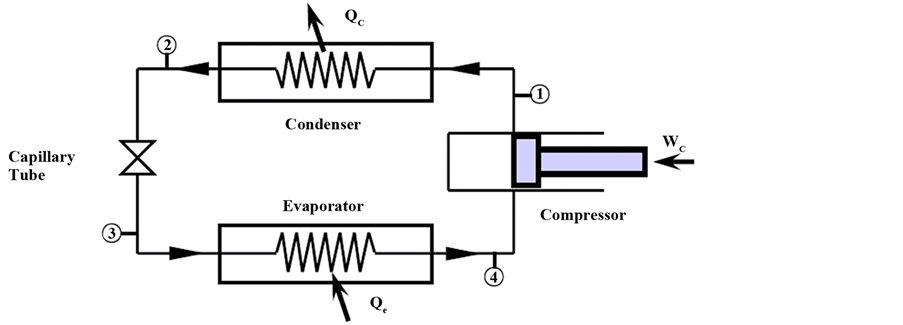
To use Equation (2) for accelerated testing, it needs to be modified and put into a more applicable form. A refri- geration system operates on the basic vapor-compression refrigeration cycle. The compressor receives refrigerant
 (a)
(a)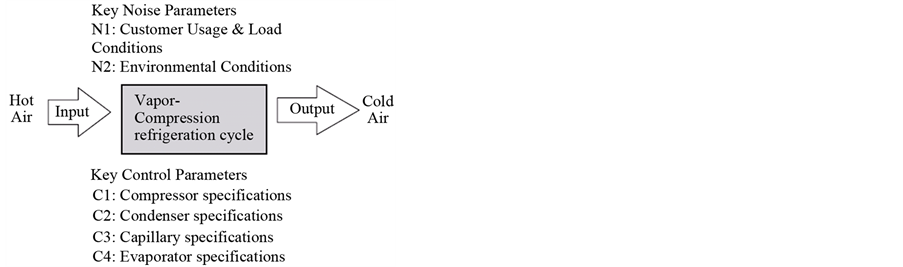 (b)
(b)
Figure 6. Vapor-compression refrigeration cycle and its robust schematic diagram. (a) Vapor-compression refrigeration cycle; (b) Robust design schematic of refrigeration system.
from the low-side (evaporator) and then compresses and transfers the refrigerant to the high-side (condenser) of the system. The capillary tube controls the flow in a refrigeration system and drops the high pressure of the refrigerant in the condenser to the low pressure in the evaporator. In a refrigeration cycle design, it is necessary to determine both the condensing pressure, Pc and evaporating pressure, Pe (see Figure 6(a)).
The mass flow rate of refrigerant in a compressor can be modeled as
 (3)
(3)
The mass flow rate of refrigerant in a capillary tube can be modeled as [22]
 (4)
(4)
By conservation of mass, the mass flow rate can be determined as:
 (5)
(5)
The energy balance in the condenser can be described as
 (6)
(6)
The energy balance in the evaporator can be described as
 (7)
(7)
When nonlinear Equation (5) through (7) are solved, the mass flow rate,  , evaporator temperature, Te, and condenser temperature, Tc can be obtained. Because the saturation pressure, Psat, is a function of temperature, the evaporator pressure, Pe (or condenser pressure Pc), can be obtained as:
 (8)
(8)
One source of stress in a refrigeration system may come from the pressure difference between suction pressure, Psuc, and discharge pressure, Pdis.
 (9)
(9)
For a refrigeration system, the time-to-failure, TF, can be modified as
 (10)
(10)
Because the material strength degrades slowly in many mechanical stress/strength interfaces, it may require long testing times until a module failure occurs. The main hurdles to finding wear induced failures and overstressed failures are the testing time and costs incurred from long tests. To resolve these issues, parametric ALT testing under severe conditions would be preferred.
When a refrigeration system structure is subjected to accelerated loads, engineering alloys in the stress-strain curve passes the specification limits (proportional limit), operating limits (elastic limit), yield point, and ultimate stress point until fracture (destruction limit) occurs. In accelerated testing, the appropriate accelerated stress levels (S1 or e1) will typically fall outside the specification limits but inside the operating limits of the material (see Figure 7).
From the time-to-failure in Equation 10, the acceleration factor can be defined as the ratio between the needed accelerated stress levels and those found under typical operating conditions. The acceleration factor (AF) can be modified to include the load from Equation (9):
 (11)
(11)
The first term on the right hand side of Equation (11) is the load and the second term is the internal energy. Under severe testing conditions, the refrigeration system subjected to a duty cycle will experience a shortened module lifetime [23] .
The Cumulative Distribution Function (CDF) in the Weibull function can be expressed as:
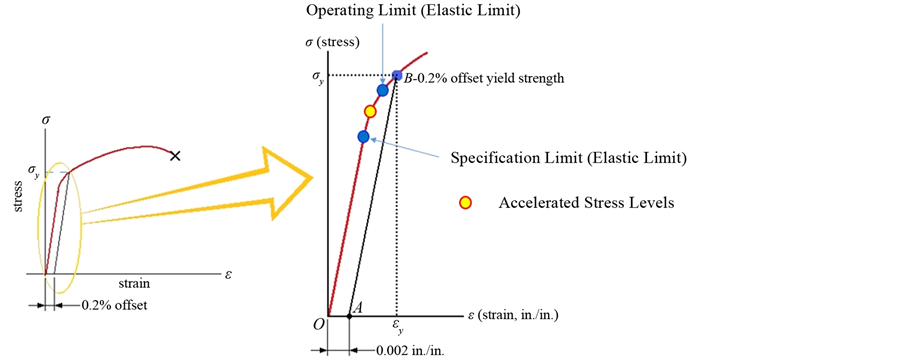
Figure 7. Engineering stress strain curve for engineering alloy.
 (12)
(12)
The Weibull reliability function, R(t), is expressed as:
 (13)
(13)
The characteristic life hMLE from the Maximum Likelihood Estimation (MLE) can be derived as:
 (14)
(14)
If the confidence level is 100(1 − a) and the number of failures, r, is expected to be r ³ 1, then the characteristic life, ha, can be estimated from Equation (14):
 (15)
(15)
Presuming there are no failures, the p-value is a and In(1/a) is mathematically equivalent to the Chi-Squared value, . The characteristic life ha, would then be represented as:
 (16)
(16)
Equation (15) is established for all cases r ³ 0 and can be redefined as follows:
 (17)
(17)
To evaluate the Weibull reliability function, the characteristic life can be converted into LB life as follows:
 (18)
(18)
After a logarithmic transformation, Equation (18) can be expressed as:
 (19)
(19)
If the estimated characteristic life of p-value a, ha, in Equation (17), is substituted into Equation (19), we obtain the BX life equation:
 (20)
(20)
Because most accelerated lifetime testing typically has a small number of samples, the number of failures would not be as much as that of the sample size.
 (21)
(21)
If Equation (21) is substituted into Equation (20), the BX life equation becomes an inequality and can be written as follows:
 (22)
(22)
The sample size equation with the number of failures can also be modified as follows:
 (23)
(23)
For a 60% confidence level, the first term,  , in Equation (23) can be approximated as (r + 1) [24] . In addition, if the cumulative failure rate, x, is below about 20 percent, the denominator of the second term,
  , can be approximated as x by a Taylor expansion. These approximations transform the general sample size equation to the following:
 (24)
(24)
If the acceleration factor, AF, from Equation (11) is added into the planned testing time, Equation (24) can be modified to include AF. When the target reliability-failure rate l and lifetime LB are given, this equation will be used to carry out parametric accelerated life testing:
 (25)
(25)
3. Case Study―Refrigerator Compressor Subjected to Repetitive Pressure Loads
The suction reed valves of the compressors in domestic refrigerator were cracking and fracturing in the field, as shown in Figure 8. For these applications, a compressor needed to be designed to operate under a wide range of customer usage conditions. However, there were failures in the field that caused the compressor to “lock up”. As a consequence, customers would ask to have the refrigerator replaced. To solve the problem, it was very important to reproduce the failure mode(s) of the suction reed valve. Locking refers to the inability of the electric stator to rotate the crankshaft, due to a failure of one more components within the compressor. The field data indicated that the damaged compressor potentially had a design flaw. Due to this design flaw, repetitive loads on the compressor could cause the reed valve to fail and the compressor to lock up. Examination of the failed compressors from the field indicated that the fracture started in the void of the suction reed valve and propagated to the end (Figure 9).
The compressor designer did not know the reliability of the compressor, either its life, Bx, or failure rate, l. To determine these values, a parameter ALT was carried out on the compressor. From Equation (11), assumed the cumulative damage exponent l is 2, the acceleration factor (AF) can be obtained as Table 2.
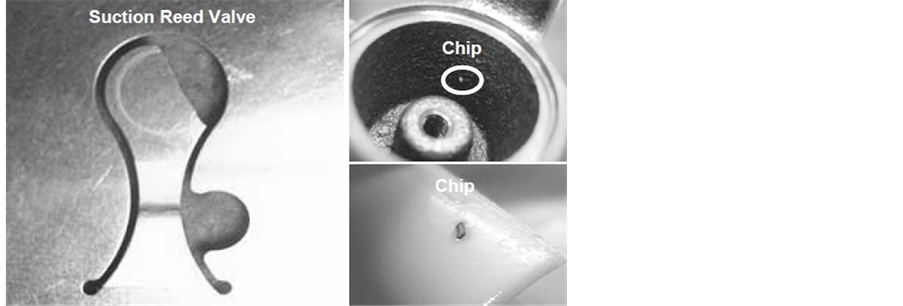
Figure 8. Fracture of the compressor suction reed valve in the marketplace.
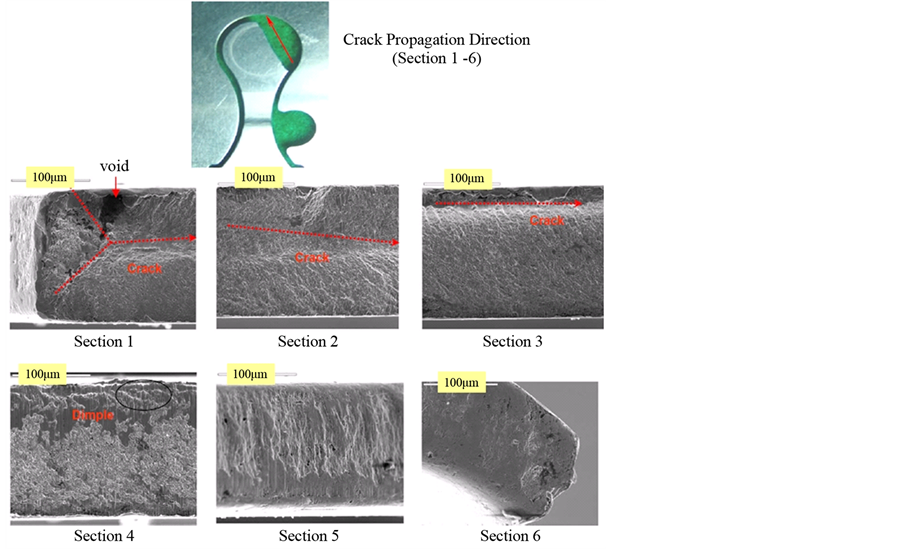
Figure 9. Fractography of the compressor suction reed valve on a scanning electron microscope (SEM).
Table 2. ALT conditions in a vapor-compression cycles.
The reliability of the new compressor was targeted to be 10 years over B1 that will become the cumulative failure rate 1%. Based on the technical data under the customer usage conditions, the normal number of operating cycles of the suction reed valve for one day was approximately twenty-two; the worst case was ninety-eight. Under the worst case, the expected compressor cycles for ten years would be 357,700 cycles (LB) (see Table 3).
Assuming the shape parameter β for compressor is common 1.9, the test cycles and test sample numbers calculated in Equation 25 were 39,000 cycles and 20 EA, respectively. As a reliability quantitative specification, parametric ALT was designed to assure a B1 of ten years life with about a 60 percent confidence level of common sense if no unit in it fails during 39,000 cycles.
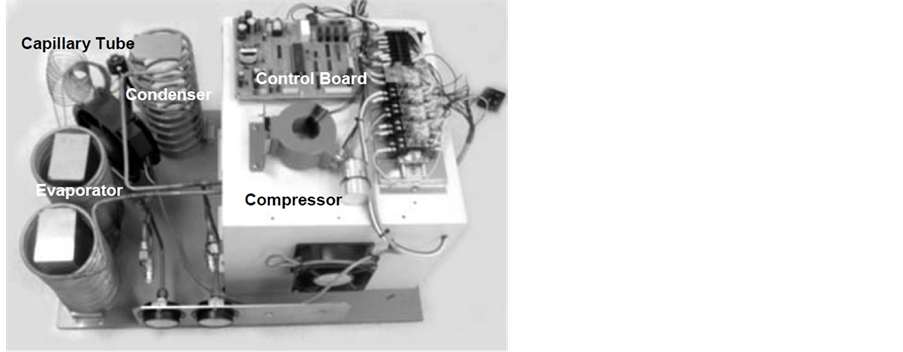
The ALT equipment was a simplified vapor-compression cycle and fabricated with duty cycles as shown in Figure 10. It consisted of an evaporator, compressor, condenser, and capillary tube. The inlet to the condenser section was at the top and the condenser outlet was at the bottom. At the condenser inlet, a quick coupling fitting and high-side pressure gauge pressure were installed. The 10-gram XH9 refrigerator dryer at the condenser inlet was mounted vertically. A thermal switch was attached to the condenser tubing at the top of the condenser coil to control the condenser fan. The evaporator inlet was at the bottom. At a location near the evaporator outlet, a quick coupling fitting and pressure gauge were installed to enable access to the low side for evacuation and refrigerant charging.
The condenser outlet connected the evaporator outlet with the capillary tube. The compressor mounted on the
 (a)
(a)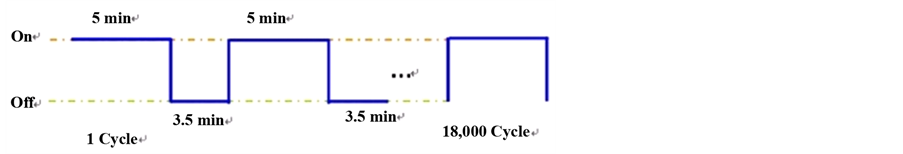 (b)
(b)
Figure 10. Equipment for the compressor accelerated life tests and its duty cycle. (a) Parametric ALT Equipment; (b) Duty cycles on the ALT equipment.
Table 3. Operating number of a reciprocating compressor.
rubber pads was connected to the condenser inlet and evaporator outlet. A fan and two 60 Watt lamps maintained the air temperature within the insulated (fiberglass) box. A thermal switch attached on the compressor top controlled the 30 cfm Suntronix axial fan, Model ST1238.
After the system was leak tested, the equipment was evacuated from both high and low sides to 0.01 torr of the static capability of the vacuum pump. It was charged with refrigerant through the valve on the low side of the equipment to an instantaneous pressure of 30 kg/cm2. The test conditions and test limits were set up on the control board. As the test began, the high-side and low-side pressures could be observed on the pressure gauges (or display monitor).
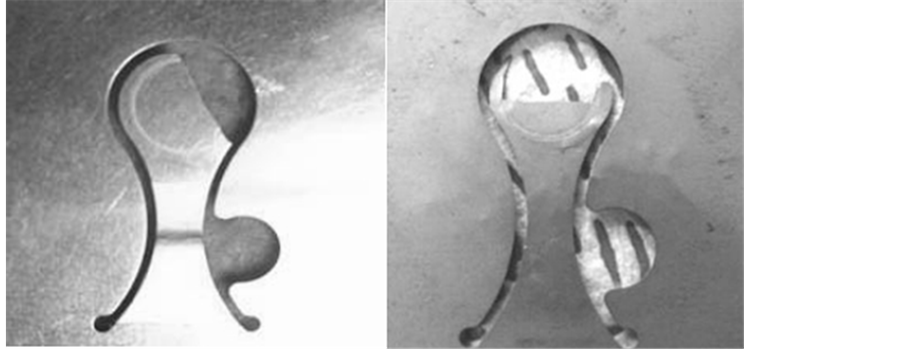
Figure 11 shows the failed reed valve from the field and one after an accelerated life test. In the photo, the shape and location of the broken piece in the failed market products are similar to those in the ALT results.
Figure 12 represents the graphical analysis of the ALT results and field data on a Weibull plot. For the shape parameter, the guessed value in the previous ALT and the final value obtained on the Weibull plot was 1.9, respectively. We concluded that the ALT methodologies were valid for reproducing the failures in the field because: (1) the location and shape of the fractured suction reed valve from the field and from the ALT were similar, and (2) the shape parameters of the ALT results, β1 and field data, β2, were similar on the Weibull plot.
The fracture of the suction reed valves came from its relatively weak structural design. The design included: (1) an overlap with the valve plate, (2) a carbon steel (20C), and (3) a sharp edge on the valve plate (Figure 13). When the suction reed valve impacted the valve plate continually, it fractured easily. The dominant failure mode
 (a) (b)
Figure 11. Failure of suction reed valve from the field and an ALT. (a) Failed valve from the field; (b) Failed valve from an ALT.

Figure 12. Field data and results of accelerated life test on Weibull chart.
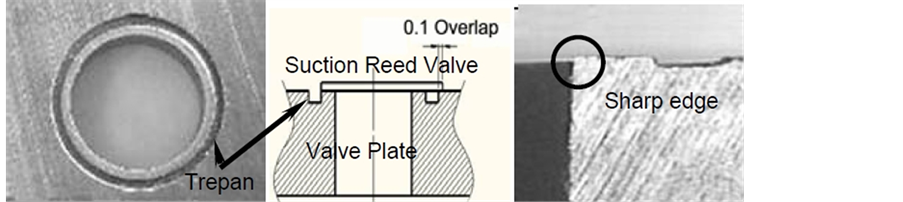
Figure 13. Structure of suction reed and valve plate.
of the compressor was leaking of refrigerant and locking due to the cracking and fracturing of the suction reed valve.
Figure 14 shows the redesigned suction reed valve and the valve plate. The valve controls the refrigerant gas during the process of suction and compression in the compressor. The suction reed valve required high bending/impact fatigue properties. The modified design parameters were: 1) increasing the trespan size of the valve plate from 0.73 mm to 1.25 mm, C1; 2) changing the material property from carbon steel (20C) to stainless steel (7C), C2; 3) adding a ball peening and tumbling process during the treating of suction reed valve, C3.
For the second ALT, the test sample number calculated in Equation (25) was 30 compressors and the mission cycles were 32,000. Three samples failed at 17,000 cycles. However, the calculated life of the newly designed compressor still did not reach the target life of B1 of ten years. From the failure analysis, the root cause of the failed compressor was attributed to a scratch on the crank shaft. The modified design points required heat treating the surface of the crankshaft. To improve compressor reliability, a second ALT was implemented with the modified design.
Figure 14. Redesigned suction reed and valve plate. (a) Valve plate; (b) Suction reed valve.
Figure 14. Redesigned suction reed and valve plate. (a) Valve plate; (b) Suction reed valve.
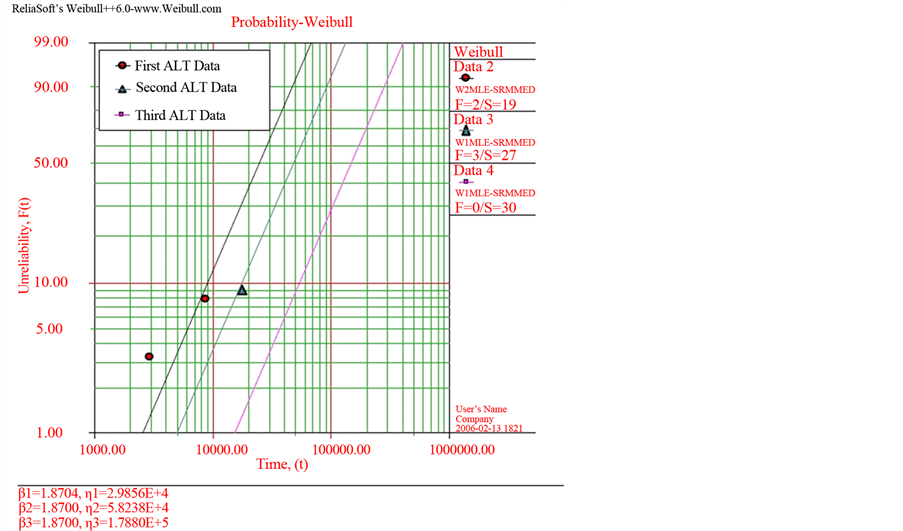
Figure 15. Redesigned suction reed and valve plate. (a) Valve plate; (b) Suction reed valve.
Table 4. Results of ALT.
For the third ALT, the test cycles and test sample numbers calculated in Equation (14) were 23,000 cycles and 60EA. In the third ALT, it was found that the compressor did not crack and fracture until 29,000 cycles of testing. Table 4 and Figure 15 show the summary of the results of the ALTs and the graphical results of an ALT plotted in a Weibull chart, respectively.
4. Conclusions
To improve the reliability design of a refrigeration system, the basic concepts of parametric ALT as a reliability quantitative specification were discussed: 1) setting the overall parametric ALT plan of the refrigerator system; 2) failure mechanics, design and reliability testing; 3) parametric accelerated life testing with an acceleration factor; and 4) derivation of the sample size equation. The failure modes and mechanisms of the mechanical system in the field and parametric ALT may come from the design parameters or design flaws not considered in the original design process. For a sample case study on the design flaws, a refrigerator compressor was studied. Based on the products returned from the field and results of the first ALTs, compressor locking occurred because of the failure of the suction reed valve. The root causes of the failed suction reed valve in the refrigerator were 1) an overlap with the valve plate; 2) a weak material (7C); and 3) the sharp edge of the valve plate.
Based on the second ALT, scratches on the crankshaft were identified as a problem. The additional missing design parameter of the compressor required heat treating on the surface of the crank shaft. After a sequence of ALTs, key design changes were identified and B1 ten year life of the compressor was assured.
Cite this paper
Seong-Woo Woo,Dennis L. O’Neal, (2016) Improving the Reliability of a Domestic Refrigerator Compressor Subjected to Repetitive Loading. Engineering,08,99-115. doi: 10.4236/eng.2016.83012
References
- 1. IEEE Standard Glossary of Software Engineering Terminology (1990) IEEE Std 610.12-1990. Standards Coordinating Committee of the Computer Society of IEEE, New York.
- 2. Kreyszig, E. (2006) Advanced Engineering Mathematics. 9th Edition, John Wiley and Son, NJ, 683.
- 3. Taguchi, G. (1978) Off-Line and On-Line Quality Control Systems. Proceedings of the International Conference on Quality Control, Tokyo, October 1978.
- 4. Taguchi, G. and Shih-Chung, T. (1992) Introduction to Quality Engineering: Bringing Quality Engineering Upstream. ASME, New York.
- 5. Ashley, S. (1992) Applying Taguchi’s Quality Engineering to Technology Development. Mechanical Engineering.
- 6. Wilkins, J. (2000) Putting Taguchi Methods to Work to Solve Design Flaws. Quality Progress, 33, 55-59.
- 7. Phadke, M.S. (1989) Quality Engineering Using Robust Design. Prentice Hall, NJ.
- 8. Byrne, D. and Taguchi, S. (1987) Taguchi Approach to Parameter Design. Quality Progress, 20, 19-26.
- 9. Woo, S. and Pecht, M. (2008) Failure Analysis and Redesign of a Helix Upper Dispenser. Engineering Failure Analysis, 15, 642-653.
http://dx.doi.org/10.1016/j.engfailanal.2007.10.005 - 10. Woo, S., O’Neal, D. and Pecht, M. (2009) Improving the Reliability of a Water Dispenser Lever in a Refrigerator Subjected to Repetitive Stresses. Engineering Failure Analysis, 16, 1597-1606.
http://dx.doi.org/10.1016/j.engfailanal.2008.10.017 - 11. Woo, S., O’Neal, D. and Pecht, M. (2009) Design of a Hinge Kit System in a Kimchi Refrigerator Receiving Repetitive Stresses. Engineering Failure Analysis, 16, 1655-1665.
http://dx.doi.org/10.1016/j.engfailanal.2008.11.010 - 12. Woo, S., Ryu, D. and Pecht, M. (2009) Design Evaluation of a French Refrigerator Drawer System Subjected to Repeated Food Storage Loads. Engineering Failure Analysis, 16, 2224-2234.
http://dx.doi.org/10.1016/j.engfailanal.2009.03.005 - 13. Woo, S., O’Neal, D. and Pecht, M. (2010) Failure Analysis and Redesign of the Evaporator Tubing in a Kimchi Refrigerator. Engineering Failure Analysis, 17, 369-379.
http://dx.doi.org/10.1016/j.engfailanal.2009.08.003 - 14. Woo, S., O’Neal, D. and Pecht, M. (2010) Reliability Design of a Reciprocating Compressor Suction Reed Valve in a Common Refrigerator Subjected to Repetitive Pressure Loads. Engineering Failure Analysis, 17, 979-991.
http://dx.doi.org/10.1016/j.engfailanal.2009.12.001 - 15. Woo, S., Pecht, M. and O’Neal, D. (2009) Reliability Design and Case Study of a Refrigerator Compressor Subjected to Repetitive Loads. International Journal of Refrigeration, 32, 478-486.
http://dx.doi.org/10.1016/j.ijrefrig.2008.07.006 - 16. Woo, S., O’Neal, D. and Pecht, M. (2011) Reliability Design of Residential Sized Refrigerators Subjected to Repetitive Random Vibration Loads during Rail Transport. Engineering Failure Analysis, 18, 1322-1332.
http://dx.doi.org/10.1016/j.engfailanal.2011.03.021 - 17. Woo, S., Park, J. and Pecht, M. (2011) Reliability Design and Case Study of Refrigerator Parts Subjected to Repetitive Loads under Consumer Usage Conditions. Engineering Failure Analysis, 18, 1818-1830.
http://dx.doi.org/10.1016/j.engfailanal.2011.05.007 - 18. Woo, S., Park, J., Yoon, J. and Jeon, H. (2012) The Reliability Design and Its Direct Effect on the Energy Efficiency. Energy Efficiency—The Innovative Ways for Smart Energy, the Future towards Modern Utilities, In Tech, Chapter 11.
http://dx.doi.org/10.5772/48790 - 19. Woo, S. (2015) The Reliability Design of Mechanical System and Its Parametric ALT. Handbook of Materials Failure Analysis with Case Studies from the Chemicals, Concrete and Power Industries, Elsevier, Chapter 11, 259-276.
- 20. Woo, S. and O’Neal, D. (2015) Reliability Design of Mechanical Systems Subject to Repetitive Stresses. Recent Patents on Mechanical Engineering, 8, 222-234.
http://dx.doi.org/10.2174/2212797608666150813001703 - 21. McPherson, J. (1989) Accelerated Testing. Packaging, Electronic Materials Handbook. ASM International, 1, 887-894.
- 22. Whitesel, W. (1957) Capillary Two-Phase Flow Part II. Refrigation Engineering, 65, 35.
- 23. Ajiki, T., Sugimoto, M. and Higuchi, H. (1979) A New Cyclic Biased THB Power Dissipating ICs. Proceedings of the 17th International Reliability Physics Symposium, San Diego, April 1979.
http://dx.doi.org/10.1109/IRPS.1979.362880 - 24. Ryu, D. and Chang, S. (2005) Novel Concept for Reliability Technology. Microelectronics Reliability, 45, 611-622.
http://dx.doi.org/10.1016/j.microrel.2004.10.010
Nomenclatures
AF Acceleration factor
BX Durability index
C1 Trespan size of the valve plate
C2 Material property of suction reed valve
C3 Ball peening and tumbling process
Ea Activation energy, 0.56 eV
F(t) Unreliability or cumulative distribution function (CDF)
F Force, kN
h Testing cycles (or cycles)
h* Non-dimensional testing cycles, 
k Boltzmann’s constant, 8.62 × 10⁻⁵ eV/deg
KCP Key control parameter
KNP Key noise parameter
LB Target BX life and x = 0.01X, on the condition that x £ 0.2
n Number of test samples
N1 Pressure difference, MPa
DP1 Pressure difference under accelerated stress conditions, MPa
DP0 Pressure difference under normal stress conditions, MPa
Pc Condenser pressure, kPa
Pe Evaporator pressure, kPa
Psuc Compressor suction pressure, kPa
Pdis Compressor discharge pressure, kPa
Q Volume flow rate, m3/s
Qc Heat transfer in the condenser, kW
Qe Heat transfer in the evaporator, kW
R Reliability function, target reliability (1 − X*0.01) % life in X = unreliability
r Failed numbers
S Stress
S1 Mechanical stress under accelerated stress conditions
S0 Mechanical stress under normal conditions
t Use time
T Absolute temperature, K
Tc Saturated temperature in the condenser, K
Te Saturated temperature in the evaporator, K
ti Test time for each sample, h
TF Time to failure, h
X Accumulated failure rate, %
x x = 0.01・X, on condition that x £ 0.2
Greek Symbols
c2 Chi-squared distribution
h Characteristic life
l Failure rate, %/yr
l Power index or cumulative damage exponent
a p-value, the estimated probability of rejecting the null hypothesis (H0) when H0 is true
Superscripts
b Shape parameter in a Weibull distribution
n Stress dependence, 
Subscripts
0 Normal stress conditions
1 Accelerated stress conditions
a Actual
MLE Maximum likelihood estimate