Materials Sciences and Applications
Vol.08 No.06(2017), Article ID:77046,9 pages
10.4236/msa.2017.86033
Analysis of Deformation in a High Entropy Alloy Using an Internal State Variable Model
Aaron Stein1, Paul S. Follansbee2
1Swanson School of Engineering, University of Pittsburgh, Pittsburgh, PA, USA
2Boyer School of Natural Sciences, Mathematics, and Computing, Saint Vincent College, Latrobe, PA, USA

Copyright © 2017 by authors and Scientific Research Publishing Inc.
This work is licensed under the Creative Commons Attribution International License (CC BY 4.0).
http://creativecommons.org/licenses/by/4.0/


Received: May 17, 2017; Accepted: June 18, 2017; Published: June 21, 2017
ABSTRACT
Deformation in the model high entropy alloy CoCrFeMnNi is assessed using an internal state variable constitutive model. A remarkable property of these alloys is the extraordinarily high strain hardening rates they experience in the plastic region of the stress strain curve. Published stress-strain measurements over a range of temperatures are analyzed. Dislocation obstacle interactions and the observed high rate of strain hardening are characterized in terms of state variables and their evolution. A model that combines a short-range obstacle and a long-range obstacle is shown to match experimental measurements over a wide range of temperatures and grain sizes. The long-range obstacle is thought to represent interactions of dislocations with regions of incomplete mixing or partial segregation. Dynamic strain aging also is observed at higher temperatures. Comparisons with measurements in austenitic stainless steel show some common trends.
Keywords:
High Entropy Alloys, Constitutive Modeling, Strain-Hardening, Deformation, Dynamic Strain Aging

1. Introduction
In recent years there has been increased interest in the materials engineering community in a class of metals known as High-Entropic Alloys. These metallic alloys contain five or more primary elements, approximately equimolar in concentration. The term high-entropy alloy refers to the high entropies of mixing present in the material. These alloys often concurrently possess high strength and good ductility [1] , properties which are typically inversely related. For this result to manifest, the alloy’s solid solution phase should consist of a simple crystal structure with abundant slip systems. Qualities such as these are valuable for structural materials, making these materials of considerable interest.
The objective of the work presented herein is to analyze the temperature dependent stress-strain behavior in a model high-entropy system. An internal-state variable constitutive model is applied and possible internal state variables identified and related to observations of deformation microstructures using electron microscopy analysis provided that accompanies published mechanical property measurements [2] [3] . Finally, the analyzed hardening behavior is compared to that observed in other metallic systems.
Several scientific papers have been published with regards to a specific alloy, CoCrFeMnNi. This report will focus upon a specific high-entropy system CoCr FeMnNi studied by Otto et al. [2] and CoCrFeNi (referred to as HEA 1) studied by Licavoli et al. [3] . For these two alloys, the comprising chemistry is nearly equiatomic, i.e., 20% for each element in CoCrFeMnNi and 25% in CoCrFeNi. The high mixing entropies of each alloy allow for the overcoming of enthalpies of formation of compounds, resulting in a single-phase with a high microstructural stability, even at elevated temperatures [4] . The HEA 1 material contained 0.52% Mn from a previous melt in the same crucible, as well as trace nonmetal elements, allowing for the formation of manganese sulfides, oxides, nitrides, and carbides which manifest as secondary-phase solution particles (evidence of which is provided in theory and electron microscopy) [3] . Limited chemical analysis and processing details were reported for the CoCrFeMnNi system studied by Otto et al. [2] and Laplanche et al. [4] . It is assumed that these secondary-phase solution particles are either non-present, or their effects are negligible. Additionally, it is important to note that the structure of all systems within the scope of the research presented herein manifests as a face-centered cubic (FCC) crystal structure.
Stress strain data is provided for these systems at differing grain sizes and temperatures. In each system, these curves and the yield stress tests were run according to ASTM 1876-01 at a strain rate of 10−3 s−1 for the Otto et al. measurements [2] and 8 × 10⁻⁴ s−1 for the Licavoli et al. measurements [3] . For the Otto et al. data set, tensile stress strain curves over the temperature range of 77 K to 1073 K were reported. For the Licavoli et al. data set, tensile tests over the temperature range of 296 K to 1073 K were reported. Data was presented in engineering stress versus strain converted to true stress versus strain for the modeling herein.
2. Yield Stress Dependence
The model begins with an analysis of the dependence of the yield stress of the materials with temperature, strain rate (although strain rates were held constant), and grain size. The model calculations require knowledge of the strain- rate, burgers vector (b), and the temperature dependent shear modulus. For this material , b = 0.255 nm, and μ0 (the shear modulus at absolute zero) = 85 GPa [4] . These properties are used in the following constitutive equation to predict the temperature dependence of the yield stress [5] :
 (1)
(1)
where  is an athermal stress derived from the strengthening contribution of grain boundaries, and
  and
and  are internal state variables characterizing distinguishable contributions to strength (e.g., due to solute element additions),
  is the internal state variable characterizing interactions of mobile dislocations with stored dislocations,
  is the temperature dependent shear modulus,
  is the shear modulus at 0 K, and s1 and s2 are functions (defined from zero to unity) that describe the temperature and strain rate dependence of the internal variable strength contributions [5] . The functions s1, s2, and sε are defined as [5]
 (2)
(2)
 (3)
(3)
 (4)
(4)
where k is the Boltzmann constant and g0,j is the normalized activation energy for the specified interaction.
The model for this system was selected by varying the g0,j and  values until parameters were found which enabled the best fit with the experimental yield stress measurements at every grain size and test temperature. For the Otto et al. material, the heat treatment rendered a fully recrystallized microstructure [2] ; thus
  is assumed to be zero in the starting condition. For the HEA system, however, the authors noted evidence of pre-working or incomplete recrystallization [3] . Furthermore, it was observed in this system that the impurity strength contribution s1 is non-present, or is overwhelmed by the impurity strength contribution s2, and thus s1 assumes a value of zero. The values selected for these systems are presented in Table 1. Figure 1 shows the fit of the model to the yield stress measurements in the 4.4 μm grain (FG) material.
The CG/MG/FG (Coarse Grain/Medium Grain/Fine Grain) systems are the systems defined in Otto et al. [2] , with grain sizes listed in Table 2. With regards to the model parameters, the g0,1 and  quantities represent short range deformation interactions, similar to obstacle populations observed in many pure metals and alloys [5] . These parameters characterize mobile dislocation interactions with short range obstacles, such as point defects and smaller clusters of second solution particles. The g0,2 and
  quantities represent long range deformation interactions. Due to unavailability of complete chemistry profiles, exact cause of these interactions cannot be identified. However, it is speculated that these high go values could be produced by interactions of mobile dislocations with larger clusters with inhomogeneous chemistry, perhaps due to incomplete mixing or the initial stages of segregation.

Figure 1. Yield stress measurements in the FG material compared with the model predictions.

Table 1. Model constants for the two alloy systems.
Table 2. Variation of the athermal stress with grain size.
The athermal stress contribution  is expected to vary with grain size according to a Hall-Petch relationship. Table 2 lists the athermal stress values deduced for each material and Figure 2 shows the variation of athermal stress with inverse square-root of the grain size. From this plot the slope gives the “k” factor in the Hall-Petch equation as 378 MPa μm1/2. Recall that for these analyses the model parameters in Table 1 are held constant. Only the athermal stress was varied; this gives high confidence in the applicability of the Hall-Petch correlation.
3. Evolution Kinetics
Strain hardening―also referred to as structure evolution―is added to the model by introducing the current rate of change of  with strain:
 (5)
(5)
where  is the stage two hardening rate of a single crystal,
  is a constant (selected as κ = 2), and
  is the temperature and strain-rate depen-

Figure 2. Variation of the athermal stress with grain size. The dashed line is the Hall Petch equation.
dence saturation threshold stress [5] . The first step in the application of Equation (5) is to isolate  from the other stress terms. Equation (1) is rewritten [6]
 (6)
(6)
where  is a small offset stress introduced to align the data, account for experimental scatter, and begin the
  values at zero. In writing Equation (6) it is assumed that structure evolution does not alter any of the terms on the right hand side of this equation?except of course σ(ε) [6] . With
  versus ε for each test condition (material, grain size, and temperature), Equation (5) is applied using numerical integration. The constants
  and
and  are selected such that the model matches the experimental data. The fit for the model is shown in Figure 3 for FG materials at 473 K and 673 K. In these figures the solid line displays the experimental data and the dashed line displays the predictions using Equation (5). Table 3 lists the model parameters for each of the test conditions. Note that a strain offset is introduced for the HEA specimens, likely arising from the evidence of incomplete recrystallization reported by Licavoli et al. [3] . However, a strain offset is neither needed nor justified for the FG and CG data sets.
As shown in Table 3 the saturation threshold stress indicates a slight temperature dependence. The temperature and strain rate dependence of the saturation threshold stress has been describing using a dynamic recovery model:
 (7)
(7)
where  is the value of
  at 0 K, and
  and
and  are constants [5] . Figure 4 shows the variation of the saturation threshold stress normalized by the value estimated at 0 K versus the combination of temperature and strain rate suggested by Equation (7).
Figure 4 shows a trend to similar to that seen in austenitic stainless steels, vanadium, titanium, and other metal systems [5] [6] . Some of the data points (in

Figure 3. Fit of Equation (5) dashed curves to the deduced values of  versus strain curve for the measurements in FG material at 473 K and 573 K. The solid curves are from the application of Equation (6).
Table 3. Evolution equation model parameters.
both the HEA 1 and FG and CG materials) fall along the line represented by Equation (7), but other data points (open triangles) fall well off this line. The line in this figure is characterized by ,
,  , and
, and .
.
Deviations from the linear model depicted in Figure 4 have been attributed to the presence of dynamic strain aging (DSA). DSA occurs in a temperature regime when solute mobility is sufficient to enable solutes to travel to dislocation sites, thus promoting additional restriction to the motion of dislocations, which results in hardening beyond that predicted by Equation (7). This is often accompanied by serrated yielding. Indeed serrated yielding was observed in HEA experiment conducted at 773 K [3] .
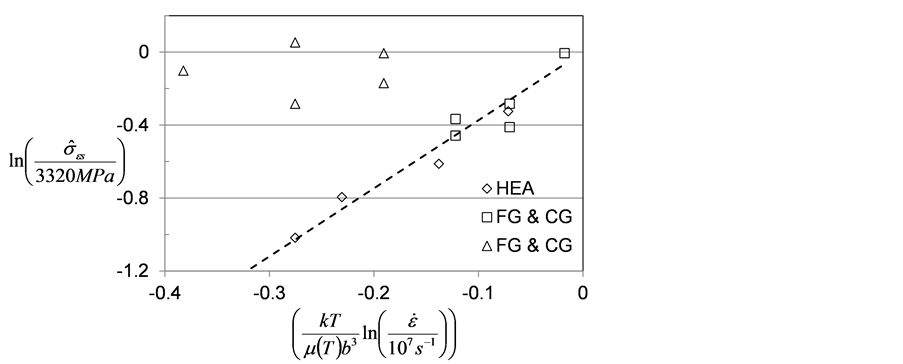
Figure 4. Fit of Equation (7) (dashed curves) to the deduced values of . Several of the data points fall along the dashed line. The open triangles that fall well above the line suggest the contribution of dynamic strain aging at the higher temperatures.
A Potential Inconsistency
The observation of DSA both in the stress strain curve [3] and in the observed deviations from Equation (7) in Figure 3 introduce a potential inconsistency in the kinetic analysis represented by the model parameters in Table 1 as applied to Equation (1). It is assumed that DSA involves transport of either interstitial atoms or substitutional atoms to the dislocation core. The higher concentration of these “defects” would lead to a higher stress that would have to be overcome to enable dislocation motion. Follansbee showed that for carbon in iron [5] ,
 (8)
(8)
where Cc is the carbon concentration. The correlation expressed by Equation (8), which is common for solution hardening, shows that a possible source of the increased strength is the increase in the solute concentration in the vicinity of the dislocation core.
Two defect populations have been postulated for this high entropy alloy system. One is a short range obstacle (characterized by g0,1 = 0.16 for the FG and CG materials). It seems highly unlikely that the long range obstacle population could contribute to DSA; rather it must be the short range obstacle population. However, at a temperature of 673 K, which is a temperature where the FG material exhibits DSA, Equation (2) predicts an s1 value of 0. The implication of this is that this obstacle population is ineffective at this high a temperature because the added stress would be  which would be zero if s1 = 0. It is interesting in Table 1 that in the HEA alloy, g0,1 = 0.4. At 773 K, where Licavoli et al. observed serrated yielding, Equation (2) predicts s1 = 0.069. It must be that the g0,1 value for the FG and CG materials in Table 1 is too low, but this is required to represent the lowest temperature measurements (77 K) in these alloys. Another possibility is that a third obstacle population with a g0 value in the range noted for the HEA materials must be added to Equation (1).
4. Discussion and Conclusions
The behavior observed in the systems presented herein has been noted as similar to other highly entropic FCC metals, e.g. austenitic stainless steel. Application of the model approach used in this report has been studied in the stainless steel systems and described by Follansbee [6] . The values found for the high entropy alloys described in this report are: ,
,  , and
, and . The values reported by Follansbee in the stainless steel are:
 ,
,  , and
, and  [6] . The similarly between these values indicates resemblance between the two systems.
Deformation kinetics is controlled by interactions of dislocations with grain boundaries and short range obstacles (g0,1 = 0.16 in CG/MG/FG and g0,1 = 0.4 in HEA 1). However, the suggestion of a long range obstacle population (g0,2 = 3.0 in CG/MG/FG and g0,2 = 4.0 in HEA 1) is new and suggests interactions of dislocations with clusters of solute atoms, perhaps resulting from incomplete mixing or a tendency to reduce energy with segregation. It would take quantitative microscopy to identify these clusters. This may offer a glance to the source of deviations in model parameters―particularly ―between the systems.
Dynamic strain aging is observed at the higher test temperatures in these high entropy alloys. Evidence for this is seen in the high rate of structure evolution that deviates from model behavior expressed by Equation (7). With a low value of g0,1 for the short-range obstacle system, an inconsistency arises in that this obstacle population is not predicted to be effective at the temperature where DSA is observed. With a two-obstacle model (actually three-obstacle if the stored dislocation density obstacle population is included) one is unable to select model parameters (see Table 2) that match the experimental results for the FG, MD, and CG materials and that has a g0,1 value in the range of 0.4 required to render the obstacle effective at the temperature where DSA is observed. Either a third obstacle population must be added, or the lowest temperature measurements (77 K) in the Otto et al. [2] experiments omitted from the analysis. The rationale for the latter would be that testing at cryogenic temperatures introduces a different deformation mechanism. While deformation twinning is observed at these temperatures [2] twinning is usually accompanied by a lower rather than a higher yield stress [5] . Another possibility is that the simple model envisioned for DSA and summarized using Equation (8) is an oversimplification. Consistent trends across different material systems when application of the state variable model when DSA is active gives yet another test of the generality of the model formulism. Identification of the inconsistency described here is thus an important conclusion.
Acknowledgements
The authors wish to express appreciation to Saint Vincent College for the institution’s support of this undergraduate research project.
Cite this paper
Stein, A. and Follansbee, P.S. (2017) Analysis of Deformation in a High Entropy Alloy Using an Internal State Variable Model. Materials Sciences and Applications, 8, 484-492. https://doi.org/10.4236/msa.2017.86033
References
- 1. Zhang, Y., Zuo, T.T., Tang, Z., Gao, M.C., Dahmen, K.A., Liaw, P.K. and Lu, Z.P. (2014) Microstructures and Properties of High-Entropy Alloys. Progress in Materials Science, 61, 1-93.
https://doi.org/10.1016/j.pmatsci.2013.10.001 - 2. Otto, F., Dlouhy, A., Somsen, Ch., Bei, H., Eggeler, G. and George, E.P. (2013) The Influences of Temperature and Microstructure on the Tensile Properties of a CoCrFeMnNi High-Entropy Alloy. Acta Materialia, 61, 5743-5755.
https://doi.org/10.1016/j.actamat.2013.06.018 - 3. Licavoli, J.J., Gao, M.C., Sears, J.S., Jablonski, P.D. and Hawk, J.A. (2015) Microstructure and Mechanical Behavior of High-Entropy Alloys. Journal of Materials Engineering and Performance, 24, 3685-3698.
https://doi.org/10.1007/s11665-015-1679-7 - 4. Laplanche, G., Gadaud, P., Horst, O., Otto, F., Eggeler, G. and George, E.P. (2015) Temperature Dependencies of the Elastic Moduli and Thermal Expansion Coefficient of an Equiatomic, Single-Phase CoCrFeMnNi High-Entropy Alloy. Journal of Alloys and Compounds, 623, 348-353. https://doi.org/10.1016/j.jallcom.2014.11.061
- 5. Follansbee, P.S. (2014) Fundamentals of Strength—Principles, Experiment, and Applications of an Internal State Variable Constitutive Formulation. The Minerals, Metals, and Materials Society, John Wiley & Sons, Hoboken, NJ.
https://doi.org/10.1002/9781118808412 - 6. Follansbee, P.S. (2015) Structure Evolution in Austenitic Stainless Steels. Materials Sciences and Applications, 6, 457-463. https://doi.org/10.4236/msa.2015.66049