Materials Sciences and Applications
Vol.3 No.4(2012), Article ID:18470,10 pages DOI:10.4236/msa.2012.34033
Optimizing the Preparation Conditions of Bi-2223 Superconducting Phase Using PbO and PbO2
![]()
Physics Department, Faculty of Science, Alexandria University, Alexandria, Egypt.
Email: *rawad64@yahoo.com
Received November 5th, 2011; revised December 21st, 2011; accepted February 9th, 2012
Keywords: High-Temperature Superconductors; XRD; DSC; Transport Critical Current Density
ABSTRACT
In this work, superconducting samples of type (Bi1.8Pb0.4)Sr1.9Ca2.1Cu3O10+δ were prepared, with Pb0.4 composed of  and
and , at different sintering temperatures ranging from 835˚C to 855˚C. The prepared samples were characterized using x-ray powder diffraction (XRD), scanning electron microscope (SEM), electron dispersive spectroscopy (EDS) and differential scanning calorimetery (DSC). The superconducting properties were investigated using electrical resistivity and transport critical current density. Our results showed that the sample prepared at sintering temperature 845˚C has the optimum value of superconducting transition temperature Tc and transport critical current density Jc.
1. Introduction
Among the high-temperature superconductor materials (HTSCs), the Bi-Sr-Ca-Cu-O (BSCCO) system was considered to be the most interesting superconducting materials due to their high superconducting transition temperature Tc and critical current density Jc. The BSCCO system with a nominal composition Bi2Sr2Cam–1Cum O2m+4+δ, where m is the number of Cu-O layers, involves three superconducting phases, Bi-2201 (m = 1), Bi-2212 (m = 2) and Bi-2223 (m = 3) with Tc ~ 20, 80 and 110 K, respectively. The Bi-2223 phase is the most promising one among these phases to synthesis tapes and wires for large-scale and high-current applications [1]. It is characterized by a high Tc and a high upper critical magnetic value Bc2 of the order of 150 Tesla [2]. Tremendous works [3-5] were directed towards the preparation of a nearly single Bi-2223 phase in order to optimize its superconducting transition temperature and critical current density Jc. The Bi-2223 phase formation strongly depends on the preparation conditions such as sintering temperature, thermal processing time, synthesis atmosphere, precursor compositions and doping or substituting with various cations and anions. The best results revealed that the formation of Bi-2223 phase is significantly enhanced through the partial substitution of Bi by Pb [6]. It is extremely difficult to prepare the (Bi, Pb)-2223 phase as a single phase since it usually intergrowths with the (Bi, Pb)-2212 phase. This is due to the high complexity of the reaction and to the small difference in their thermodynamic stabilities [7]. It is known that, the Bi-2223 phase is formed just below the melting temperature (875˚C - 880˚C) [8,9]. The temperature range for partial melting becomes lower and wider as a result of Pb-substitution [10,11]. This means that the partial substitution of Bi by Pb could accelerate the phase formation by the help of a partial melting [12,13]. In Bi-2223 the hole-density is nearly optimum-doping [14]. So, Pb2+ substitution could increase the hole-density and may shift the hole-density apart from the optimum-doping. Therefore, it is more convenient to make the substitution by  instead of
  to keep the hole-density near optimum which is important for improving Tc. A small change in CuO and/or Bi2O3 during the preparation of the Bi-2223 phase leads to a pronounced decrease in its volume fraction [15]. On the other hand, an excess of Bi2O3 and CuO enhances the formation of the Bi-2223 phase with small amounts of CuO and the viscosity of the forming transient liquid which is known to support the crystallization of the Bi-2223 phase [16,17]. The best stoichiometric amounts of both Bi and Pb were found to be about Bi2.5 or about (Bi + Pb)2.2 for both Bi-2223 and (Bi, Pb)-2223 phases, respectively [16].
In this study it is convenient to consider Bi1.8Pb0.4Sr1.9 Ca2.1Cu3O10 phase to investigate the effect of sintering temperatures and various valence of lead; PbO and PbO2 on the phase formation, superconducting transition temperature, transport critical current density and the melting point.
2. Experimental Technique
Bi1.8Pb0.4Sr1.9Ca2.1Cu3.0O10+δ superconducting samples were prepared by the standard solid-state reaction method. Stoichiometric amounts of the raw materials Bi2O3, PbO, PbO2, SrCO3, CaCO3 and CuO (Sigma-Aldrich chemicals) were weighed with ratios (1.8:0.2:0.2:1.9:2.1:3), respectively. The powder was ground in an agate mortar and then was sifted by a 65 μm sieve. Then, the mixed powder was subjected to two-stages of calcinations in air at 820˚C for 24 hours for each stage. This is important to obtain the proper precursor phase’s necessary for the formation of Bi-2223. The phase assemblage is sensitive to the calcination conditions [18]. After that, the mixture was cooled to 100˚C and ground. Then, the powder was pelletized into a disc of diameter of 1.5 cm and thickness of about 0.3 cm. The pellets were sintered in air at different sintering temperatures from 835˚C to 855˚C for 96 h with heating rate 4˚C/min. Finally, the samples were cooled down to room temperature by a rate of 2˚C/min.
The prepared samples were characterized by X-ray powder diffraction using X’Pert Graphics and Identify with Cu Kα-radiation (l = 1.5406 Å) in the range 4˚ ≤ 2θ ≤ 70˚. The grain size and microstructure morphology of the samples were identified using a Jeol scanning electron microscope JSM-5300, operated at 30 kV. Energy dispersive spectroscopy analysis was performed for the prepared samples using Oxford X-ray micro-probe analyzer connected to a Jeol scanning microscope JSM-5300.
The amount of heat absorbed, differential scanning calorimetery (DSC), and the mass loss, thermogravimetric analysis (TG), of all prepared samples during the heating process were carried out by SDT Q600 instrument. This instrument measures both DSC and TG simultaneously. 0.2 gm powder for each sample was putted in alumina cup and its temperature was raised from room temperature up to 900˚C, for both measurements, with a rate of 10˚C/min in flow of Ar.
The electric resistivity of the prepared samples was measured by the conventional four probe technique from room temperature down to zero resistivity temperature Tc0 via a closed cryogenic refrigeration system (Displex) employing helium gas as a working medium. The samples have the shape of parallelepipeds of approximate dimensions 15 × 2 × 3 mm3, and the connections of the copper leads were welded with sample using a conductive silver paint. The temperature of the sample was monitored by Fe-Au thermocouple and stabilized with the aid of a temperature controller to within ±0.1 K. A typical excitation of 1 mA was used to avoid heating effects on the samples. The potential drop across the sample was measured using a Keithely-181 digital nanovoltmeter. The voltage was determined by taking the average of the values measured with the normal and the reverse directions of applied current to eliminate the thermoelectric voltages of the junction leads. The transport critical current density was measured by the conventional four-probe technique at 77 K using liquid nitrogen flow.
3. Results and Discussion
Our work studied the effect of sintering temperatures 835˚C, 840˚C, 845˚C, 850˚C and 855˚C on the formation of (Bi, Pb)-2223 phase using stoichiometric ratios 0.2 PbO and 0.2 PbO2 instead of 0.4 of PbO. The XRD patterns for Bi1.8Pb0.4Sr1.9Ca2.1Cu3O10+δ at different sintering temperatures 835˚C - 855˚C are shown in Figure 1. For sintering temperatures 835˚C, 840˚C and 845˚C, the major peaks are well indexed by tetragonal unit cell of (Bi, Pb)-2223 phase with a space group P4/mmm [19]. As the sintering temperatures increases to 850˚C and 855˚C, the major peaks are well indexed by tetragonal unit cell of (Bi, Pb)-2223 phase with another space group P [20]. The change in space group is probably due to the lattice instabilities which involve distortion in the copper-oxygen layers. This is interesting aspects of the high temperature superconductors and was observed by Rawford et al. [21] in La2CuO4 phase. Also, few weak diffraction peaks of the superconducting phase (Bi, Pb)-2212 and non-superconducting phase Ca2PbO4 are observed in XRD patterns. The (Bi, Pb)-2223 phase is called high Tc- phase and their peaks indicated by H (hkl), but (Bi, Pb)- 2212 phase is called low Tc-phase and their peaks indicated by L (hkl). The peaks of Ca2PbO4 phase are indicated by (*).
In the inset of Figure 1, we represent the XRD patterns of (Bi, Pb)-2223 samples in the 2q range 4.6˚ - 6˚ at different sintering temperatures 835˚C - 855˚C which is more suitable for pointing out the presence of both (Bi, Pb)-2223 and (Bi, Pb)-2212 phases, since no overlapping of the peaks occur. The first peak (002)H, at 2q ~ 4.7˚, corresponds to (Bi, Pb)-2223 phase whereas the second peak (002) L, at 2q ~ 5.7˚, corresponds to (Bi, Pb)-2212 phase. As the sintering temperature increases the first peak intensity increases with high rate, while the second has slight increase. The volume fractions of (Bi, Pb)- 2223, (Bi, Pb)-2212 and Ca2PbO4 are estimated from the summation of their intensities [22]. The values of the first two phases are plotted versus sintering temperature in Figure 2. It is clear that, the calculated volume fraction of (Bi, Pb)-2223 increases as the sintering temperature increases from 835˚C to 855˚C while the calculated one for (Bi, Pb)-2212 decreases. This result confirmed by the increasing of (002) H peak intensity as the sintering
Figure 1. XRD patterns for Bi1.8Pb0.4Sr1.9Ca2.1Cu3O10+δ, at different sintering temperatures.
temperature increases. Another advantages of substituting Pb2+ in Bi3+ sites is to relieve the internal stress [15], but the disadvantage is the presence of the third phase (Bi, Pb)-2201 and other impurities such as Ca2CuO3, CaCu2O3, CaO and CuO. In our work, the disappearance of these impurities in XRD patterns is properly due to the substitution of both Pb2+ and Pb4+ in Bi3+ sites, which could be motivate the other impurities to interact with Bi-2201 to form Bi-2212 [23].
The lattice parameters a and c are calculated by taking all the tetragonal peaks of (Bi, Pb)-2223 phase as a function of sintering temperature. Figure 3 shows the variation of a and c at different sintering temperatures. The lattice parameters c shows a parabolic curve while the lattice parameter a is nearly unchanged in average a = 5.4 ± 0.02 Å. The change in the lattice parameter c may be due to the substitution of both PbO and PbO2 in Bi3+ sites. The lattice parameters a and c for (Bi, Pb)-2223 phase substituted with PbO are nearly 5.41 and 37.07 Å, respectively [24]. So, the change in c could be due to the substitution by PbO2. The increase in the lattice parameter c with sintering temperature up to 845˚C is due to the substitution of large ionic radius Pb2+ (1.19 Å, VI coordination) in the Bi3+ sites of the small ionic radius (1.03 Å, VI coordination). But the decrease in c for sintering temperatures greater than 845˚C is probably due to that some of Pb4+ could be entered at Ca2+ sites, since the ionic radius of Ca2+ ion (0.99 Å, VI coordination) is greater than that of Pb4+ (0.84 Å, VI coordination) [25]. It is important to mention that the samples sintered at temperatures 850˚C and 855˚C are stretched and quasi-melted.
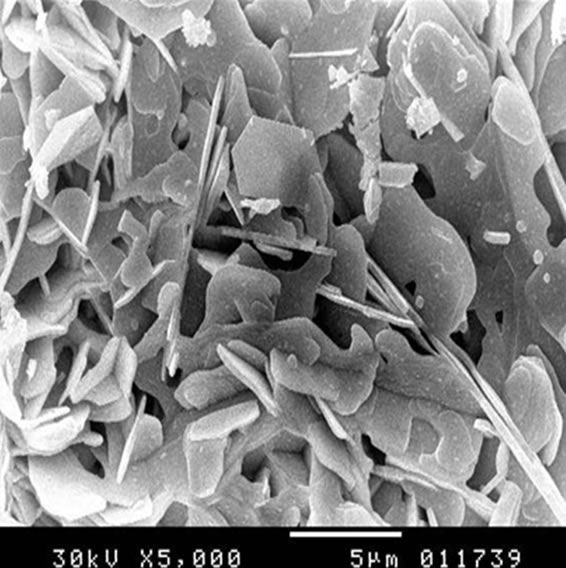
Typical SEM micrographs for the prepared samples are shown in Figures 4(a) to (e). The grains of all samples are plate-like in shape and their size is found to increase with increasing sintering temperature. All samples from 835˚C - 855˚C show a small amount of sphere-like grains which could be due to Ca2PbO4 solid particles that are randomly distributed over the phase plates [26]. Also, Figures 4(d) and (e) show that these samples are quasimelted as mentioned before, but the superconducting

Figure 2. The volume fractions of (Bi, Pb)-2223, (Bi, Pb)-2212 at different sintering temperatures.
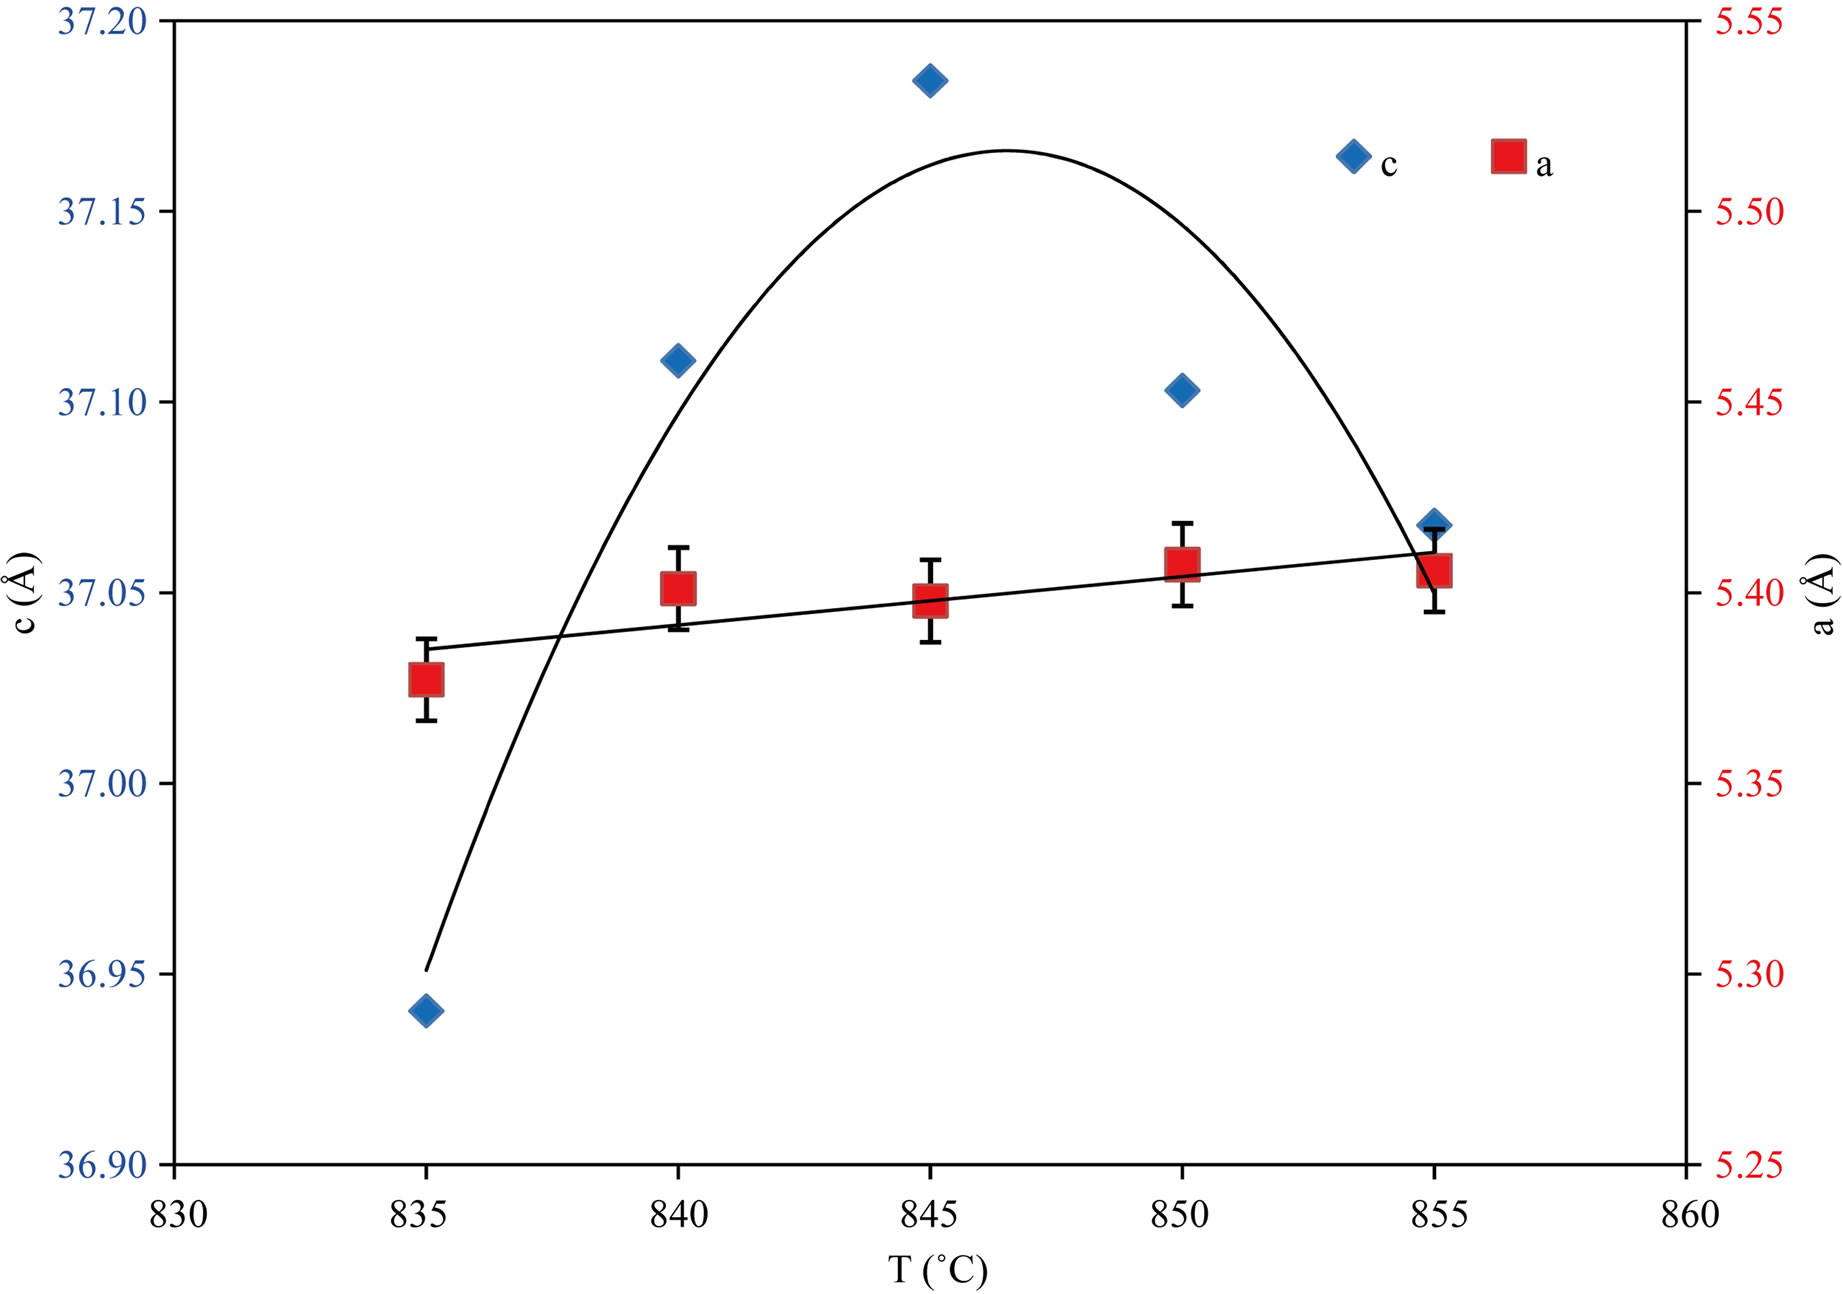
Figure 3. The variation of lattice parameters a and c with the sintering temperatures.
phenomenon still exists. It seems that the increase of sintering temperature from 850˚C up to 855˚C leads to the formation of a liquid phase that acts as insulating layers around the superconductor grains. This may be the reason for the quasi-melted for them. This increases the resistance of grain boundaries, leading to a decrease in the Jc [27]. Figure 5 shows the variation of grain size with sintering temperature. The grain size increases with two rates according to the sintering temperature range. For 835˚C - 845˚C the rate is 0.07 mm/˚C, while at 845˚C - 855˚C it is 0.19 mm/˚C. The later can be explained by the fact that the residual (Bi, Pb)-2201 phase is located at grain boundaries, although this phase does not appear in XRD data [28].
One of the most important measurements is the energy dispersive x-ray, EDX, which is used to confirm if the real compositions of our phase exists or not at different sintering temperatures 835˚C - 855˚C. To clarify this
 (a)
(a)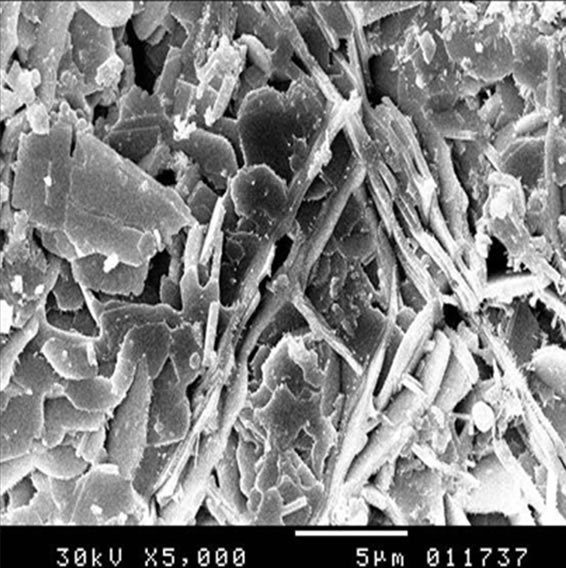 (b)
(b)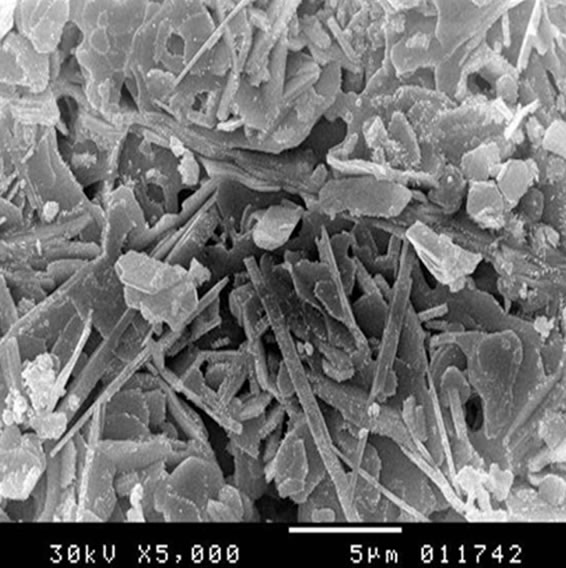 (c)
(c)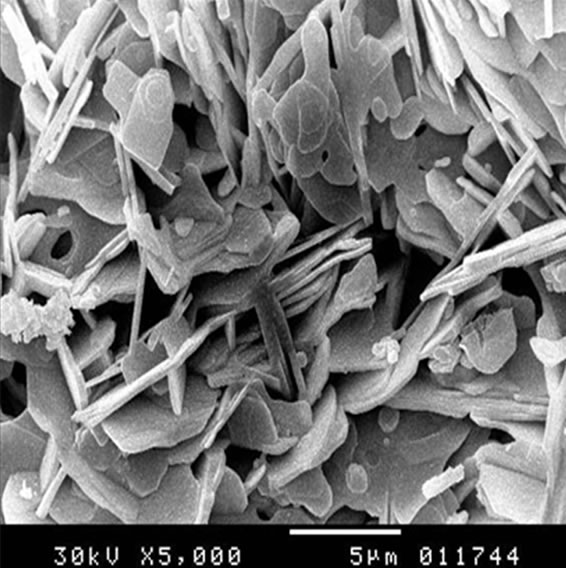 (d)
(d)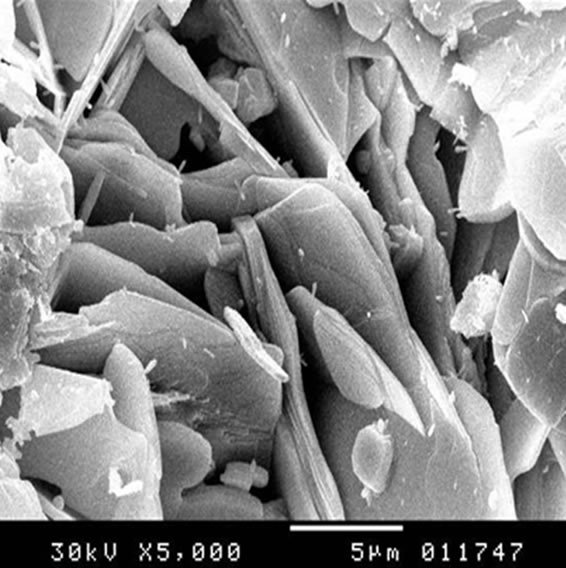 (e)
(e)
Figure 4. SEM images for (Bi, Pb)-2223 phase with different sintering temperatures: (a) 835˚C; (b) 840˚C; (c) 845˚C; (d) 850˚C; (e) 855˚C.
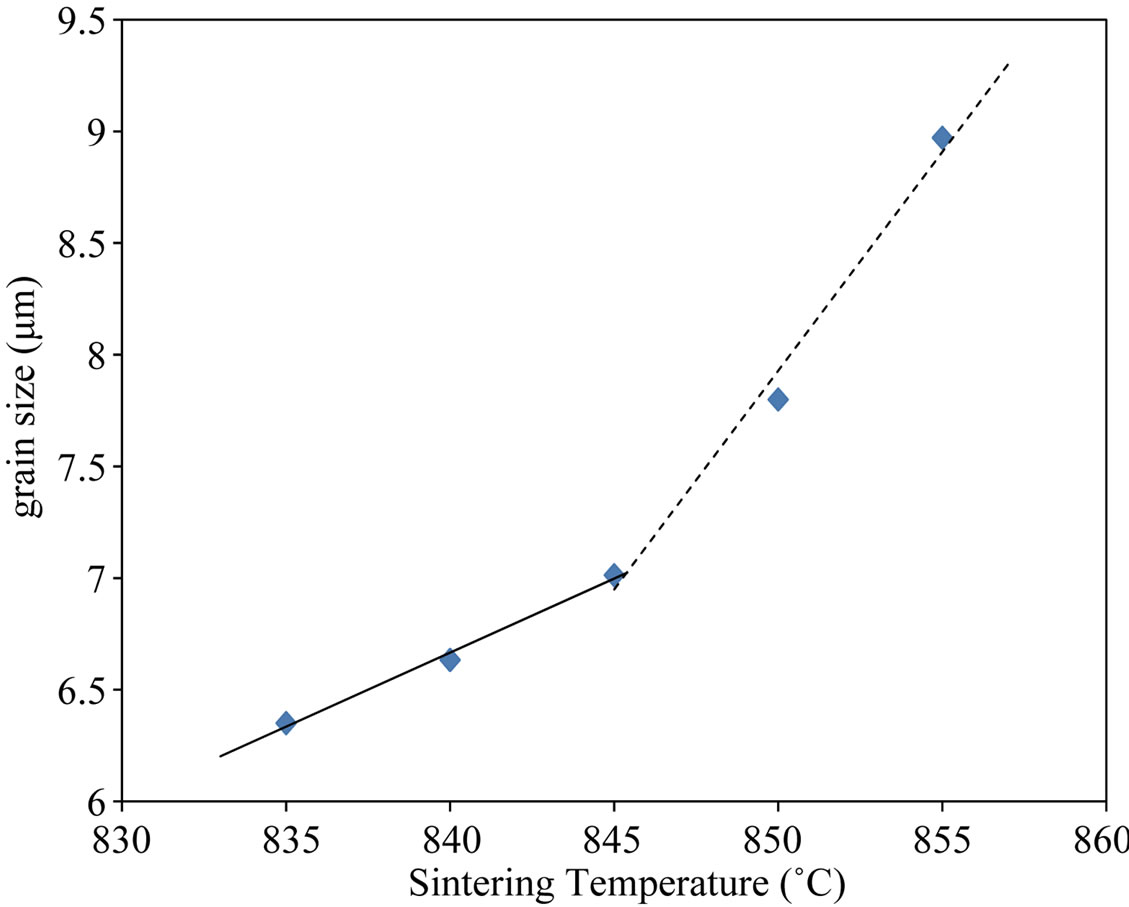
Figure 5. Variation of grain size with sintering temperature.
point, EDX spectra for the prepared samples were carried out for the same regions of SEM. Figure 6 displays EDX spectra for (Bi, Pb)-2223 phase sintered at temperatures 835˚C, 845˚C and 855˚C. All peaks show that there is no change in the position of Bi, Pb, Sr, Ca and Cu peaks after the partial replacement of the Bi3+ ions by Pb2+ and Pb4+ ions. These results indicate that these ions are well substituted in the micro-structure of (Bi, Pb)-2223. The mean real composition of Bi, Pb, Sr, Ca and Cu, determined from EDX analysis, showed that Ca composition for 850˚C and 855˚C are lower than that for 845˚C, this proves that Pb4+ could be substituted in the Ca2+ sites which in agreement with the decrease in the lattice parameter c [25]. On the other hand, the ratio (Bi + Pb)/Cu has value below 1, indicating the formation of (Bi, Pb)- 2223 phase [20]. It is clear that the sample sintered at 845˚C has the lowest ratio, about 0.68. This means that this sample is nearly single phase of (Bi, Pb)-2223 phase, consistent with the results of Calestani et al. They found that the single phase of (Bi, Pb)-2223 was formed at ratio £ 0.66.
Figure 7 shows the DSC curves for the (Bi, Pb)-2223 phase sintered at different temperatures 835˚C - 855˚C. For samples sintered at 835˚C - 845˚C, two endothermic peaks are observed between 820˚C to 850˚C. This peak is related to the formation of a liquid phase in coexistence with the (Bi, Pb)-2122 phase due to a reaction between two or more of the secondary phases present at this stage as was first suggested by Hatano et al. [14]. The second peak corresponds to the melting temperature of the (Bi, Pb)-2223 substituted with PbO and PbO2 which is lower than that of the (Bi, Pb)-2223 phase substituted with PbO [15]. The decrease in the melting point is probably due to the change in the effective oxygen content in the final sample. For samples of sintering temperatures 850˚C and 855˚C, another peak is observed around 390˚C, indicating the formation of the (Bi, Pb)-2201 phase which did not appear in XRD. This result is in a good agreement with that obtained through SEM data. It is important to mention that the melting temperature of our sample sintered at 845˚C is close to its sintering temperature, while it decreases as the sintering temperatures increase up to 855˚C. This decrease may be due to the formation of (Bi, Pb)-2201 at the grains boundaries.
The temperature dependence of the electrical resistivity for (Bi, Pb)-2223 at different sintering temperatures 835˚C - 850˚C in the temperature range T0 £ T £ 300 K, where T0 is the zero resistance temperature, is shown in Figure 8. All the samples show a metallic like—behavior at high temperature followed by a superconducting transition as the temperature is lowered. There are only a few models concerning the linear temperature dependence of the electrical resistivity of the cuprates. One may exclude the electron-phonon interaction because the very small
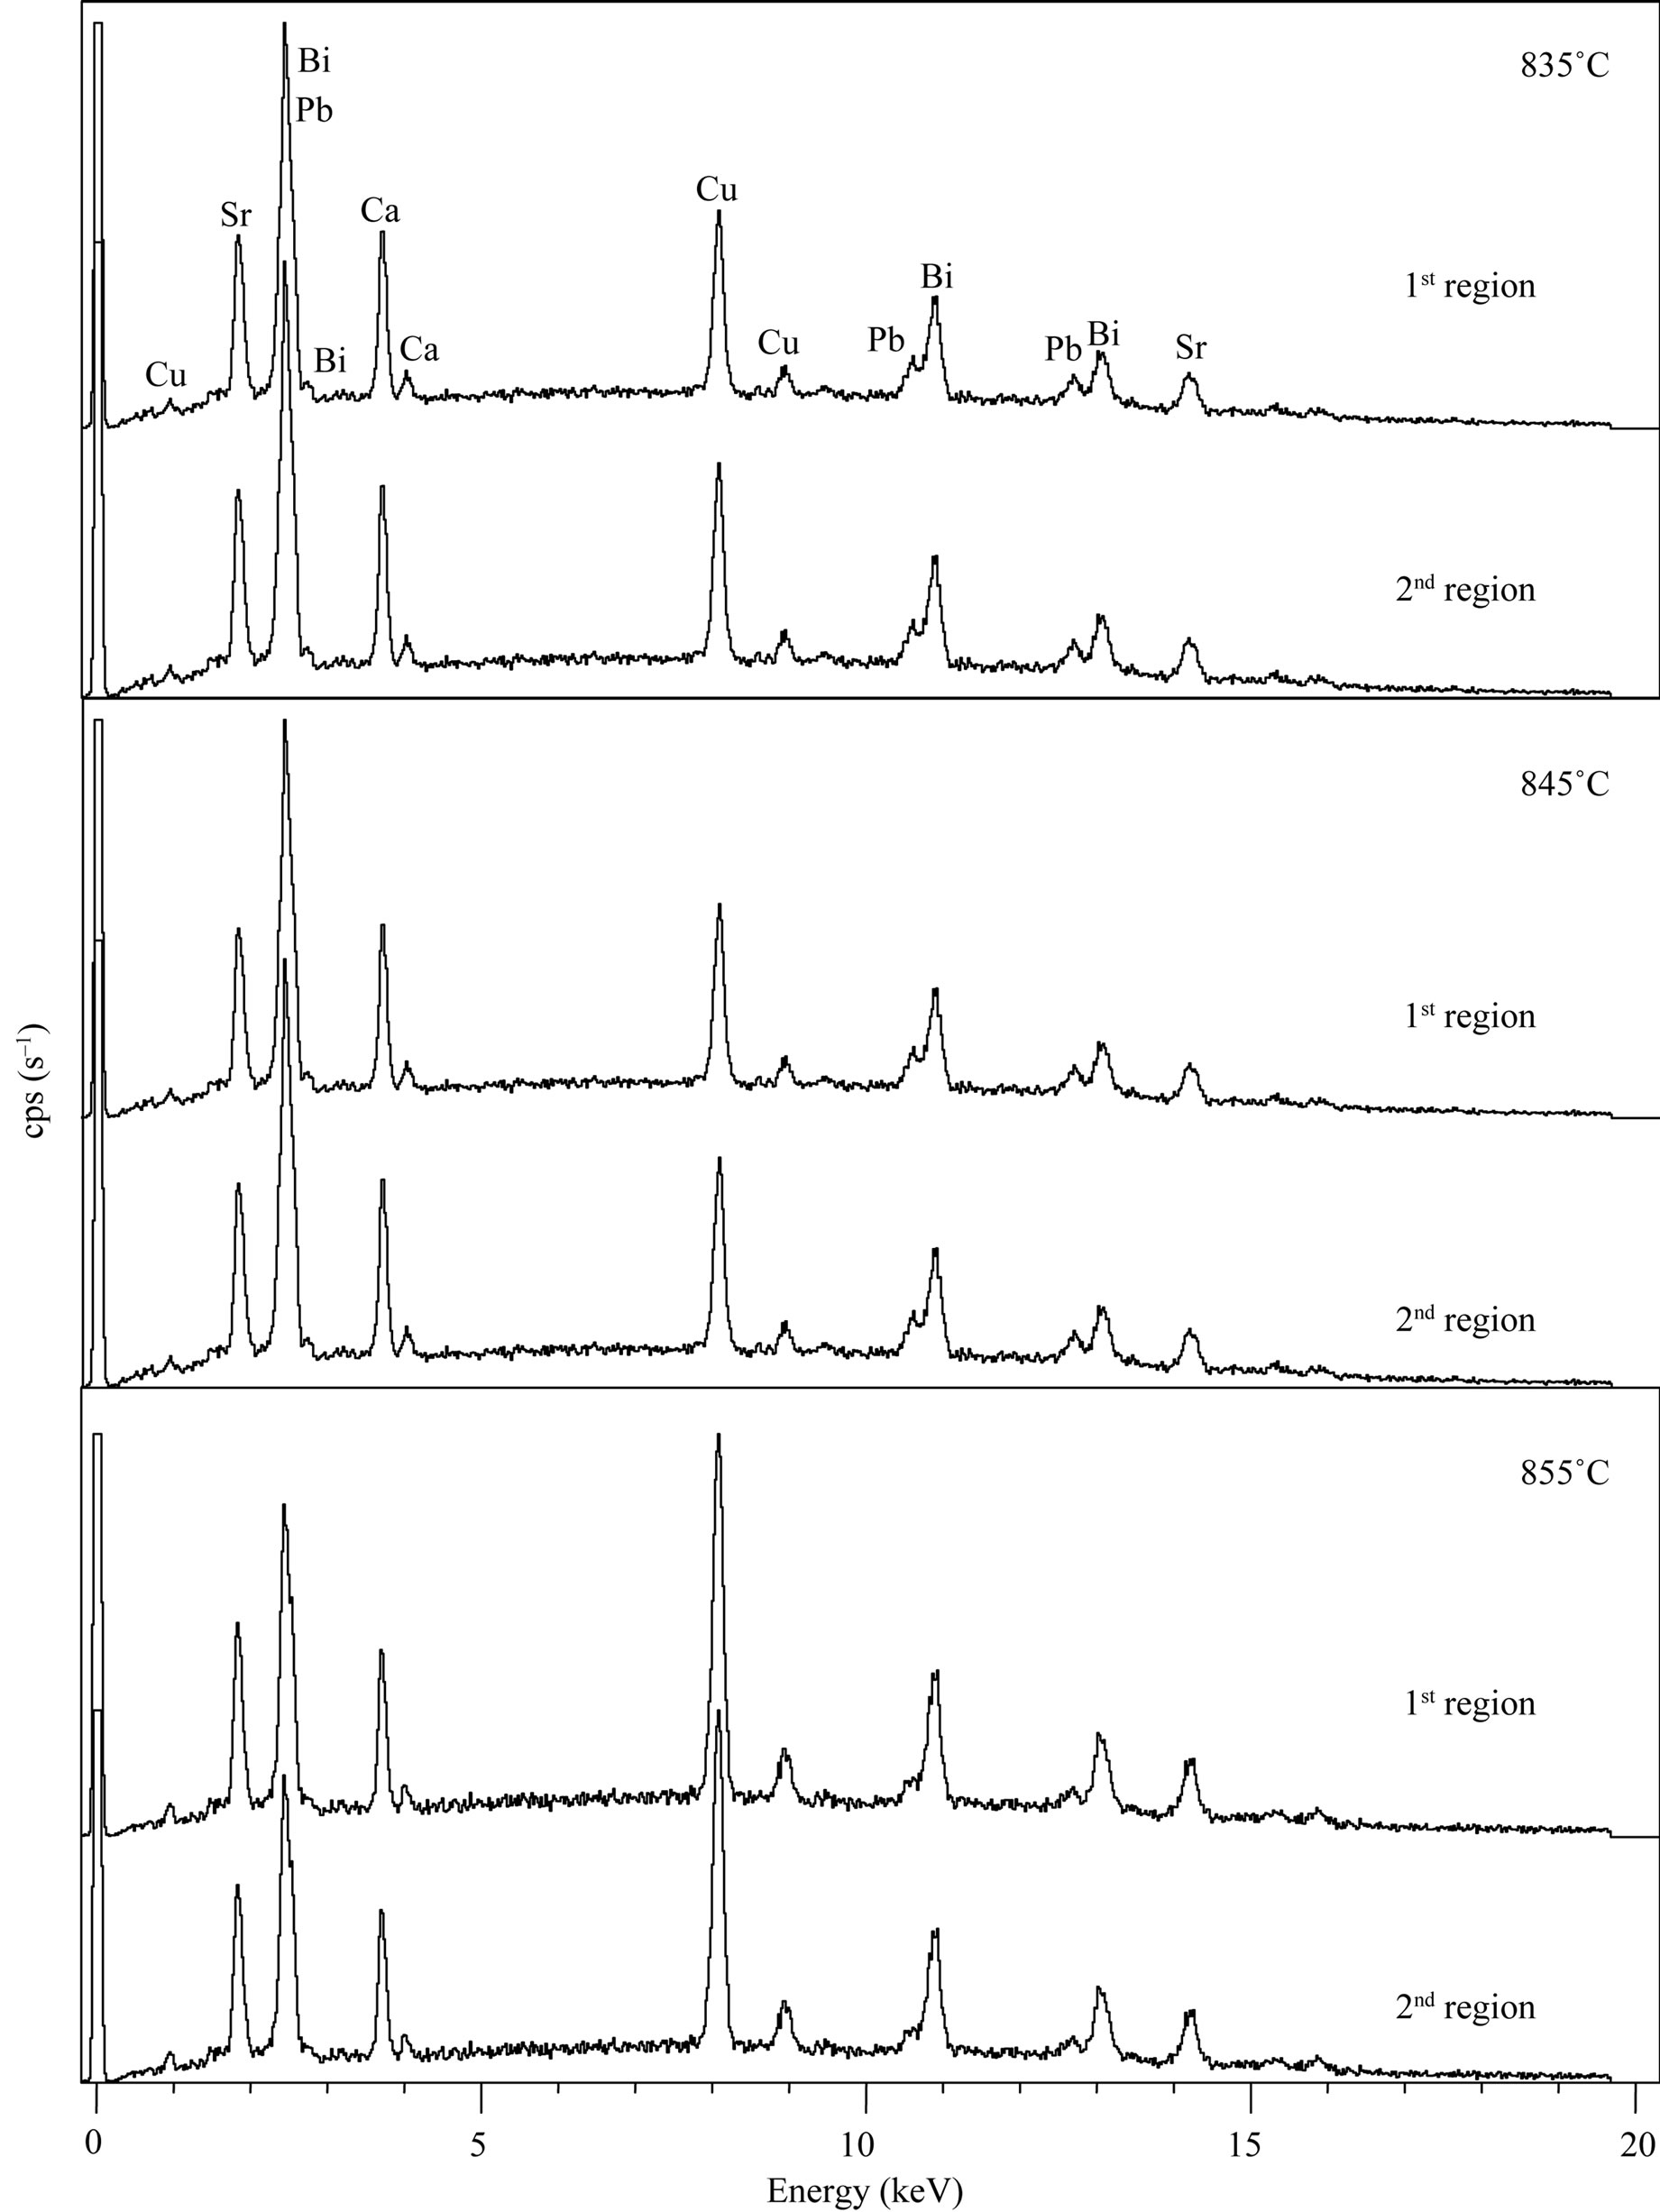
Figure 6. EDX spectra for (Bi, Pb)-2223 sintered at 835˚C, 845˚C and 855˚C.
electron-phonon coupling constant, estimated from the electrical resistivity in high temperature superconductors. Martin et al. [29] fitted a T-linear electrical resistivity in Bi-cuprates with the Bloch-Gruneisen formula, which gave an unreasonably low Debye temperature of less than 35 K. From the RVB model proposed by Anderson and Zou [30], the bosons and fermions are confined to the Cu-O planes, and the electrical resistivity in the plane is produced by the scattering of the bosons from the fermions, which will follow a linear-temperature dependence. By using the marginal-Fermi-liquid theory by Varma et al. [31] and the nested Fermi liquid by Virosztek and Ruvalds [32], one can also explain the T-linear electrical resistivity.
A small curvature in the electrical resistivity data is observed above the superconducting transition temperature Tc, indicating superconducting thermodynamic fluctuations. These superconducting thermodynamic fluctuations occur at finite range above Tc due to the appearance of cooper pairs above Tc [33]. For the samples sintered at 840˚C, 845˚C and 850˚C, the transition to T0 is nearly one step transition (nearly sharp), indicating the formation of
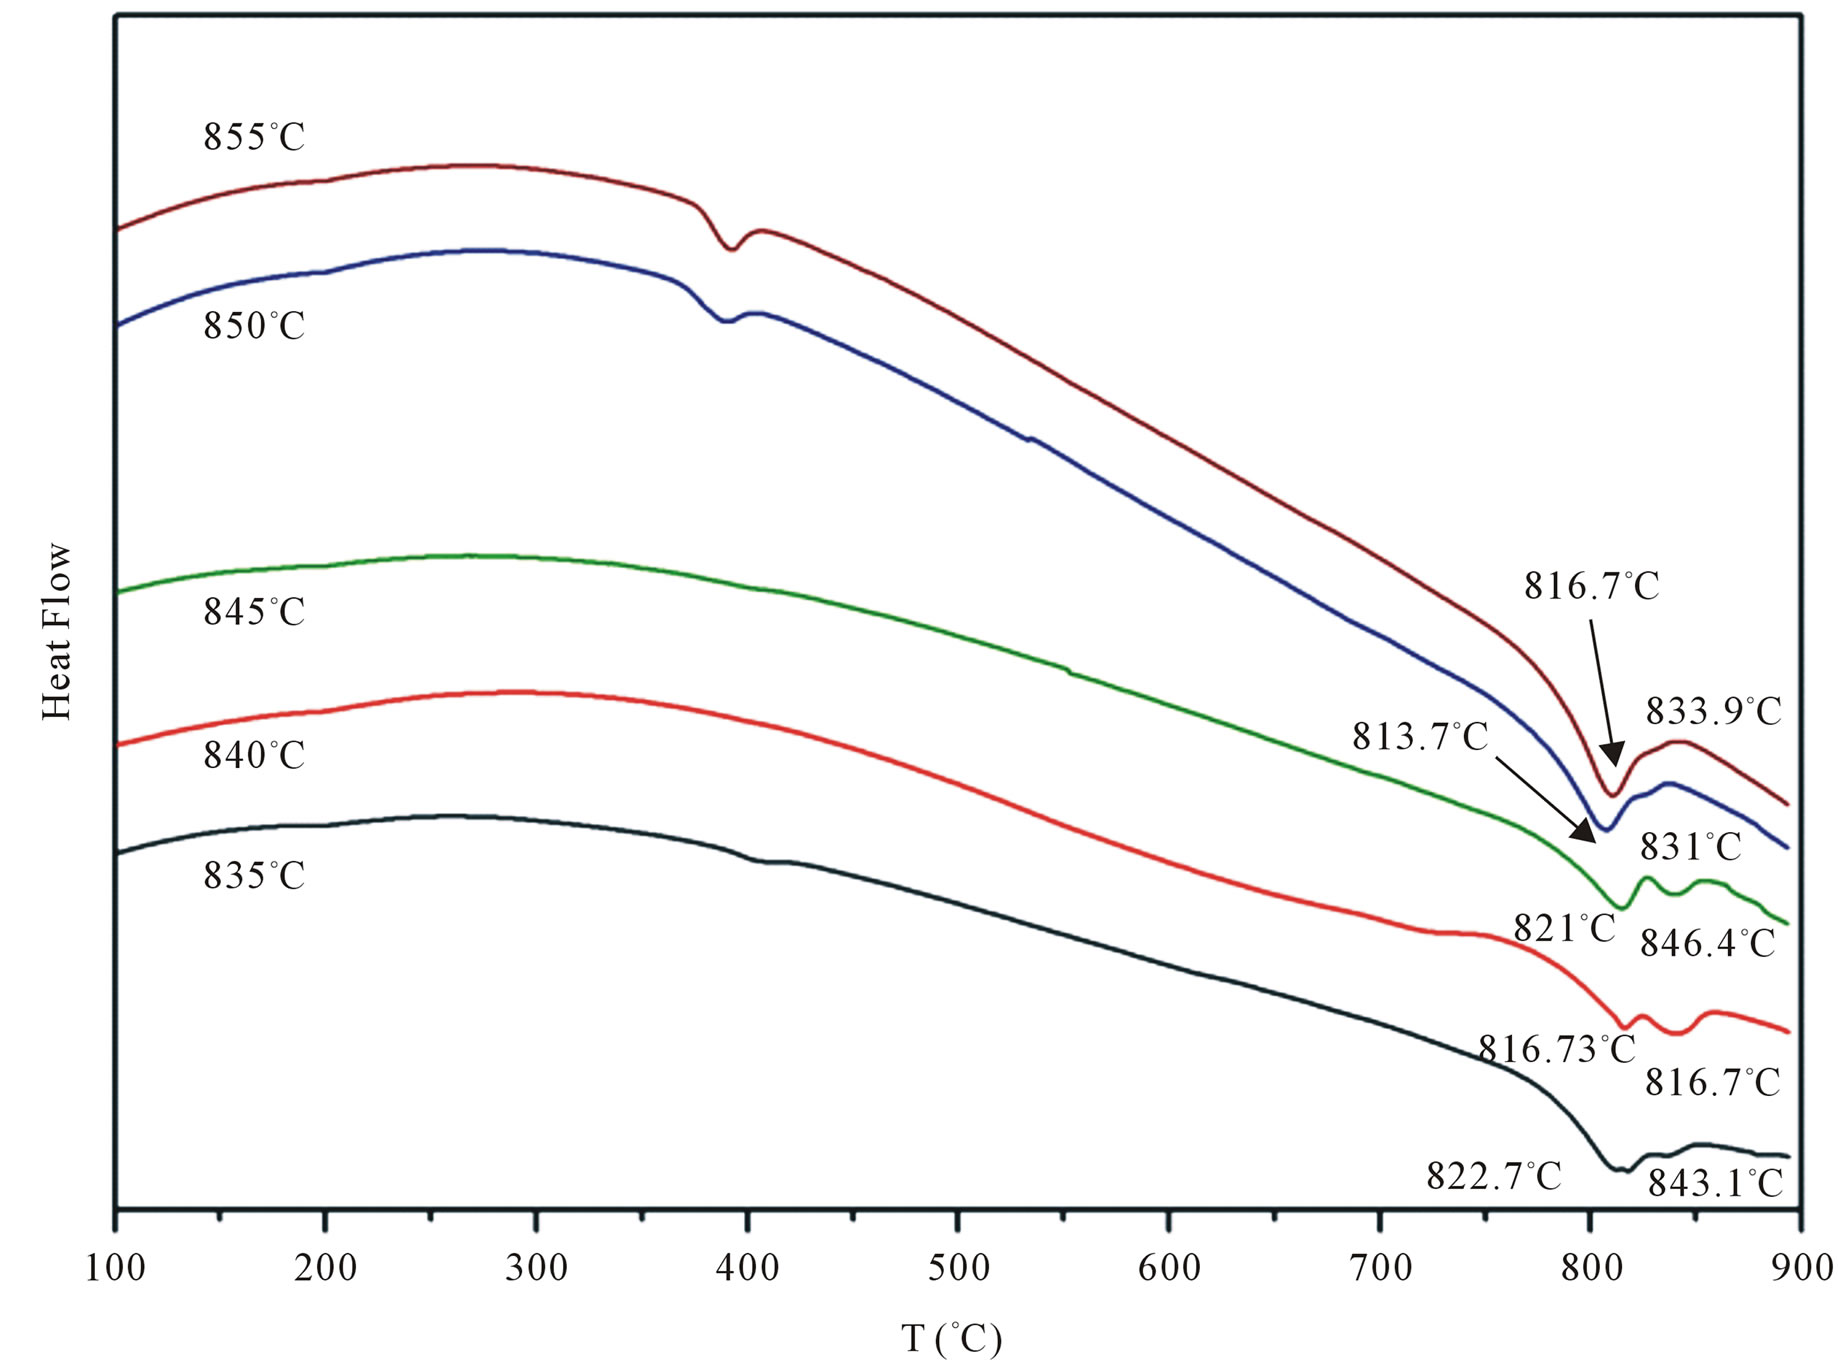
Figure 7. DSC curves for the sintered samples at 835˚C - 855˚C.

Figure 8. Temperature dependence of electrical resistivity for (Bi, Pb)-2223 at different sintering temperatures 835˚C - 850˚C.
nearly (Bi, Pb)-2223 single phase. While for samples sintered at 835˚C and 855˚C a broadening from the transition to T0 was observed causing a significant decrease in Tc value. The broadening in the transition width for the sample sintered at 835˚C is due to the existence of secondary phases and low connectivity between grains, resulting from low sintering temperature. But for the broadening in the transition width for the sample sintered at 855˚C is due to the formation of (Bi, Pb)-2201 at the grain boundaries. Table 1 summarizes the data of the residual resistivity “r0”, resistivity temperature coefficient “Q”, the superconducting transition temperature Tc and the transition width DT. It is clear that both Q and r0 decrease with increasing sintering temperature to reach minimum value at sintering temperature 845˚C after that they start to increase for sintering temperature greater than 845˚C. The lower residual resistivity values indicate that the samples are of high quality and contain fewer defects, while the higher residual resistivity can be explained in terms of increase in impurities. These results are consistent with those obtained from XRD data. It is known that the granular high-temperature superconductors having a well defined superconducting transition temperature Tc, generally determined from the derivative of r(T) with respect to T and the temperature corresponding to the peak is Tc [34]. dr(T)/dT curves for (Bi, Pb)-2223 at sintering temperatures 835˚C - 850˚C are shown in Figure 9. It is clear that the sample sintered at 845˚C has the highest superconducting transition temperature.
The E-J curves for (Bi, Pb)-2223 superconducting samples at different sintering temperatures 835˚C - 850˚C are shown in Figure 10. The general behavior can be described as follow. The current is not large enough to cause vortex pair unbinding and the system is resistanceless V(I) = 0 [35]. The voltage drop appeared at certain value of applied current Ic. With further increasing in current, we notice that all the curves exhibit non linear behavior followed by linear increase. The transport critical current density Jc, for all samples, was obtained using a criterion of 1 mV/cm. Table 1 summarized the variation
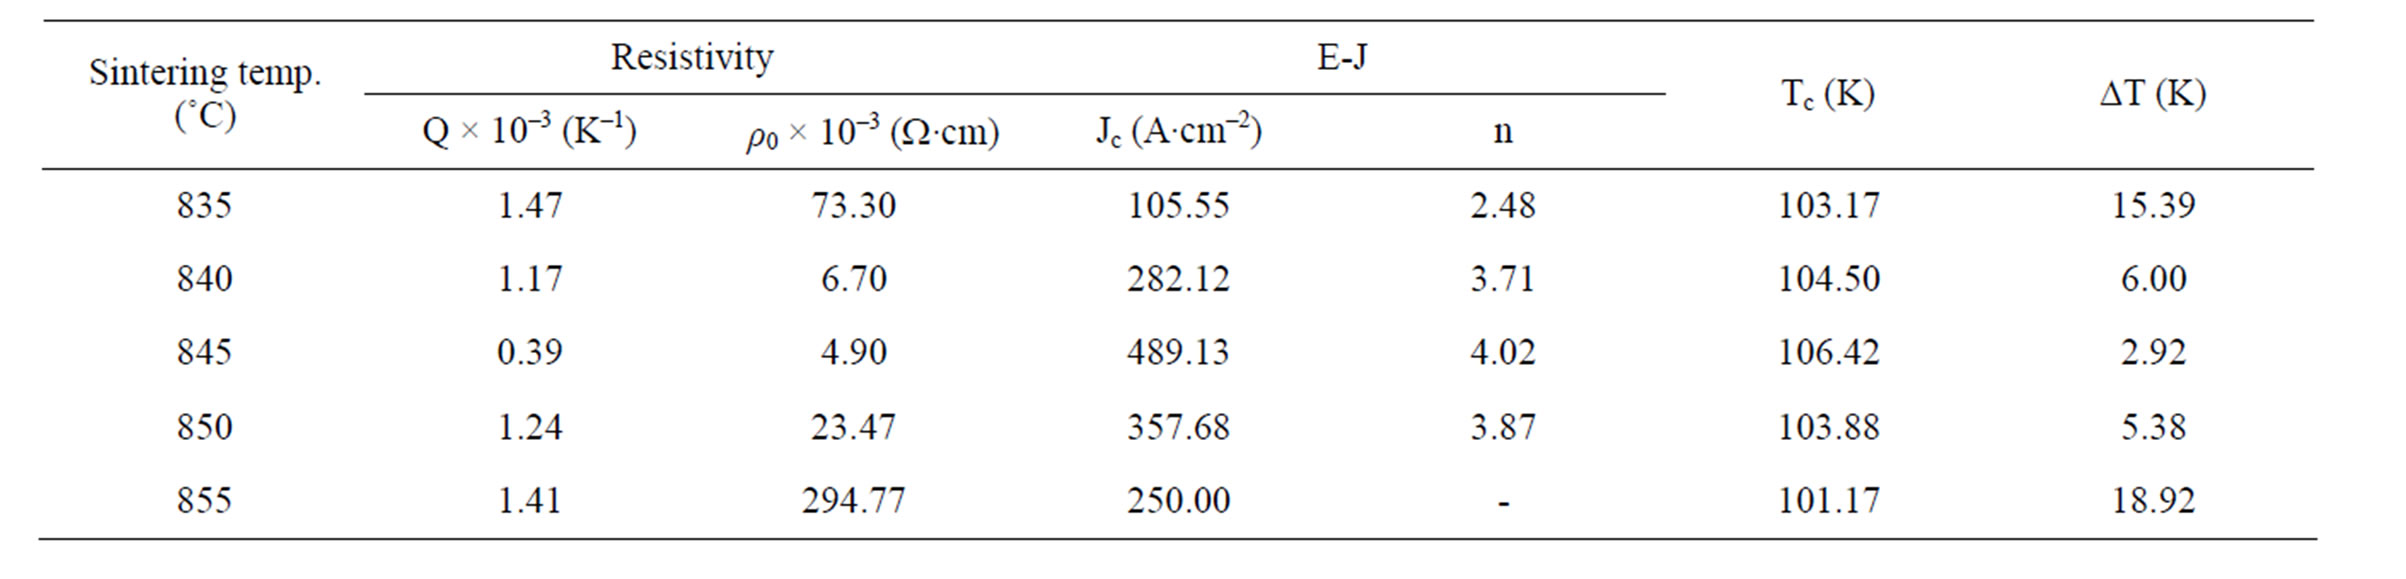
Table 1. Variation of ρ0, Q, Tc, ∆T, Jc, and n for (Bi, Pb)-2223 phase with sintering temperatures 835˚C - 855˚C.
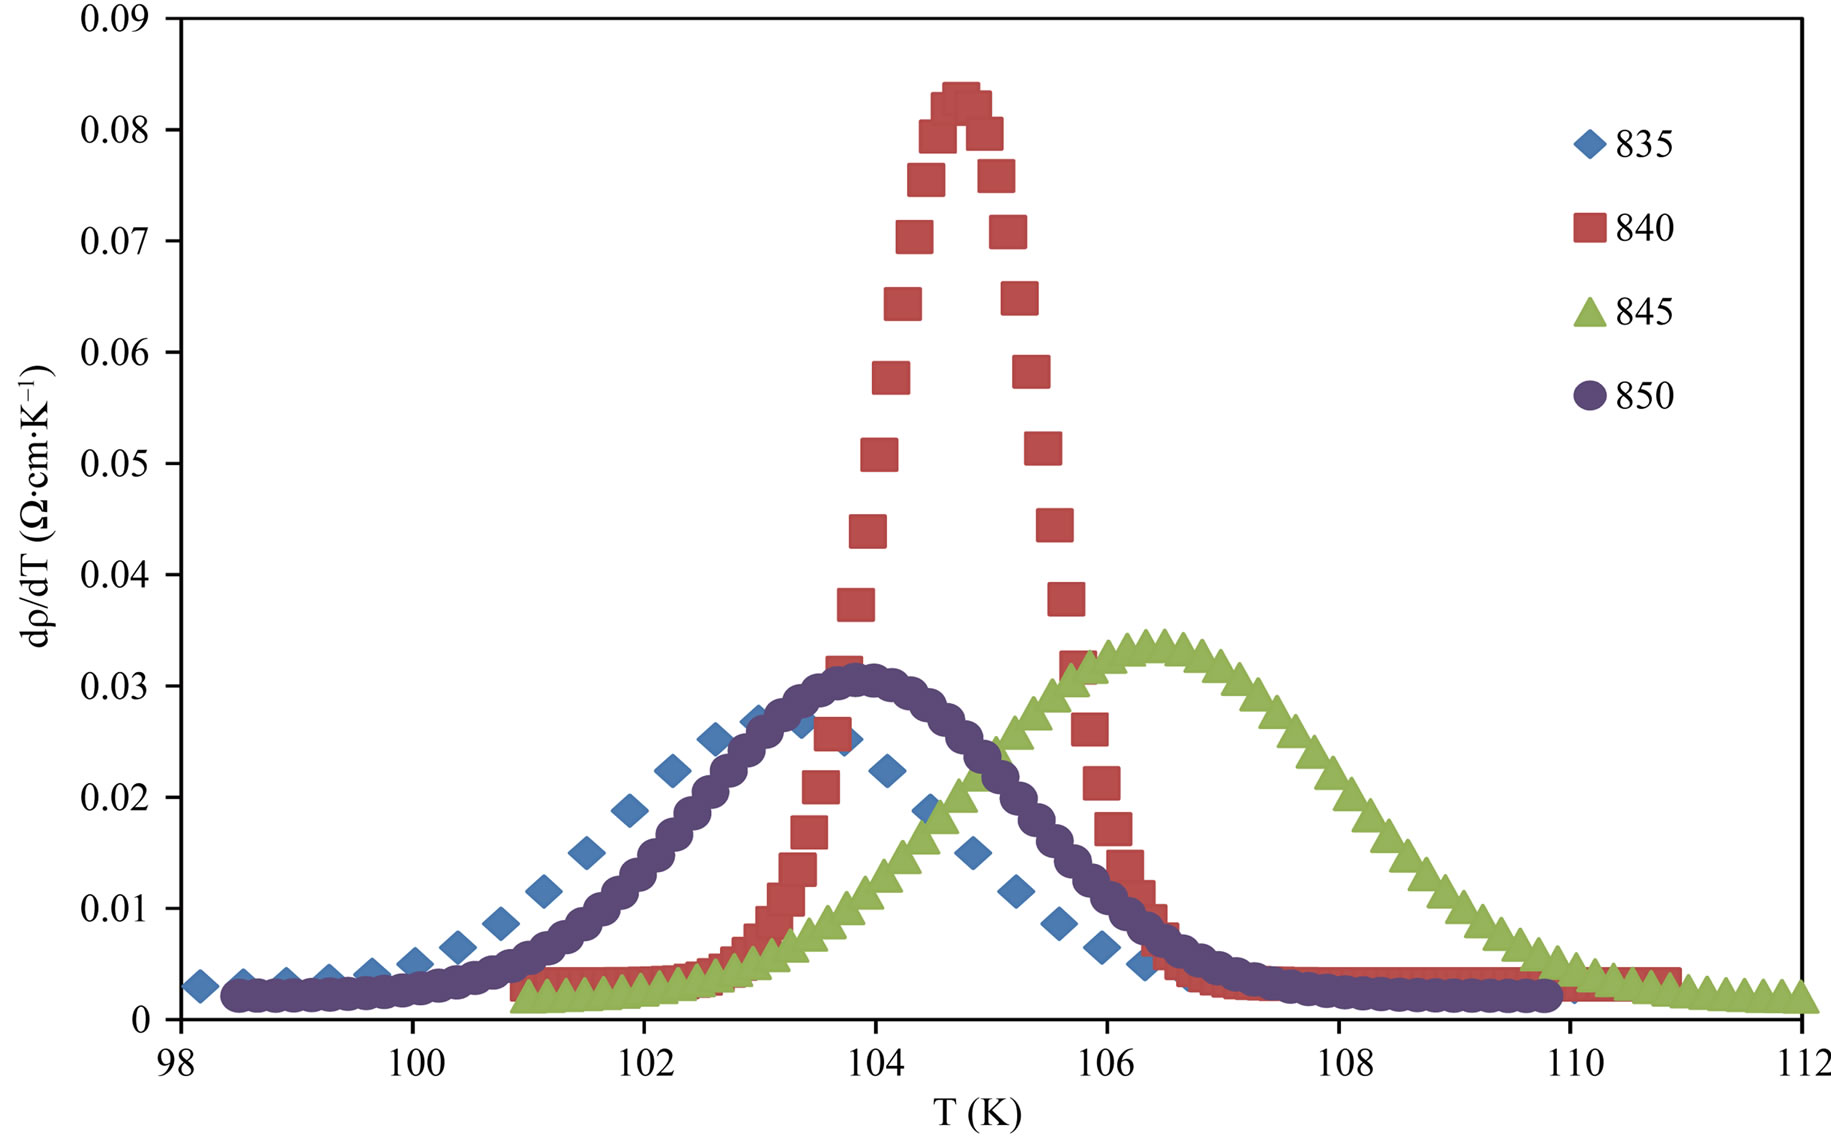
Figure 9. The derivative of the r(T) versus T for (Bi, Pb)-2223 at sintering temperatures 835˚C - 855˚C.
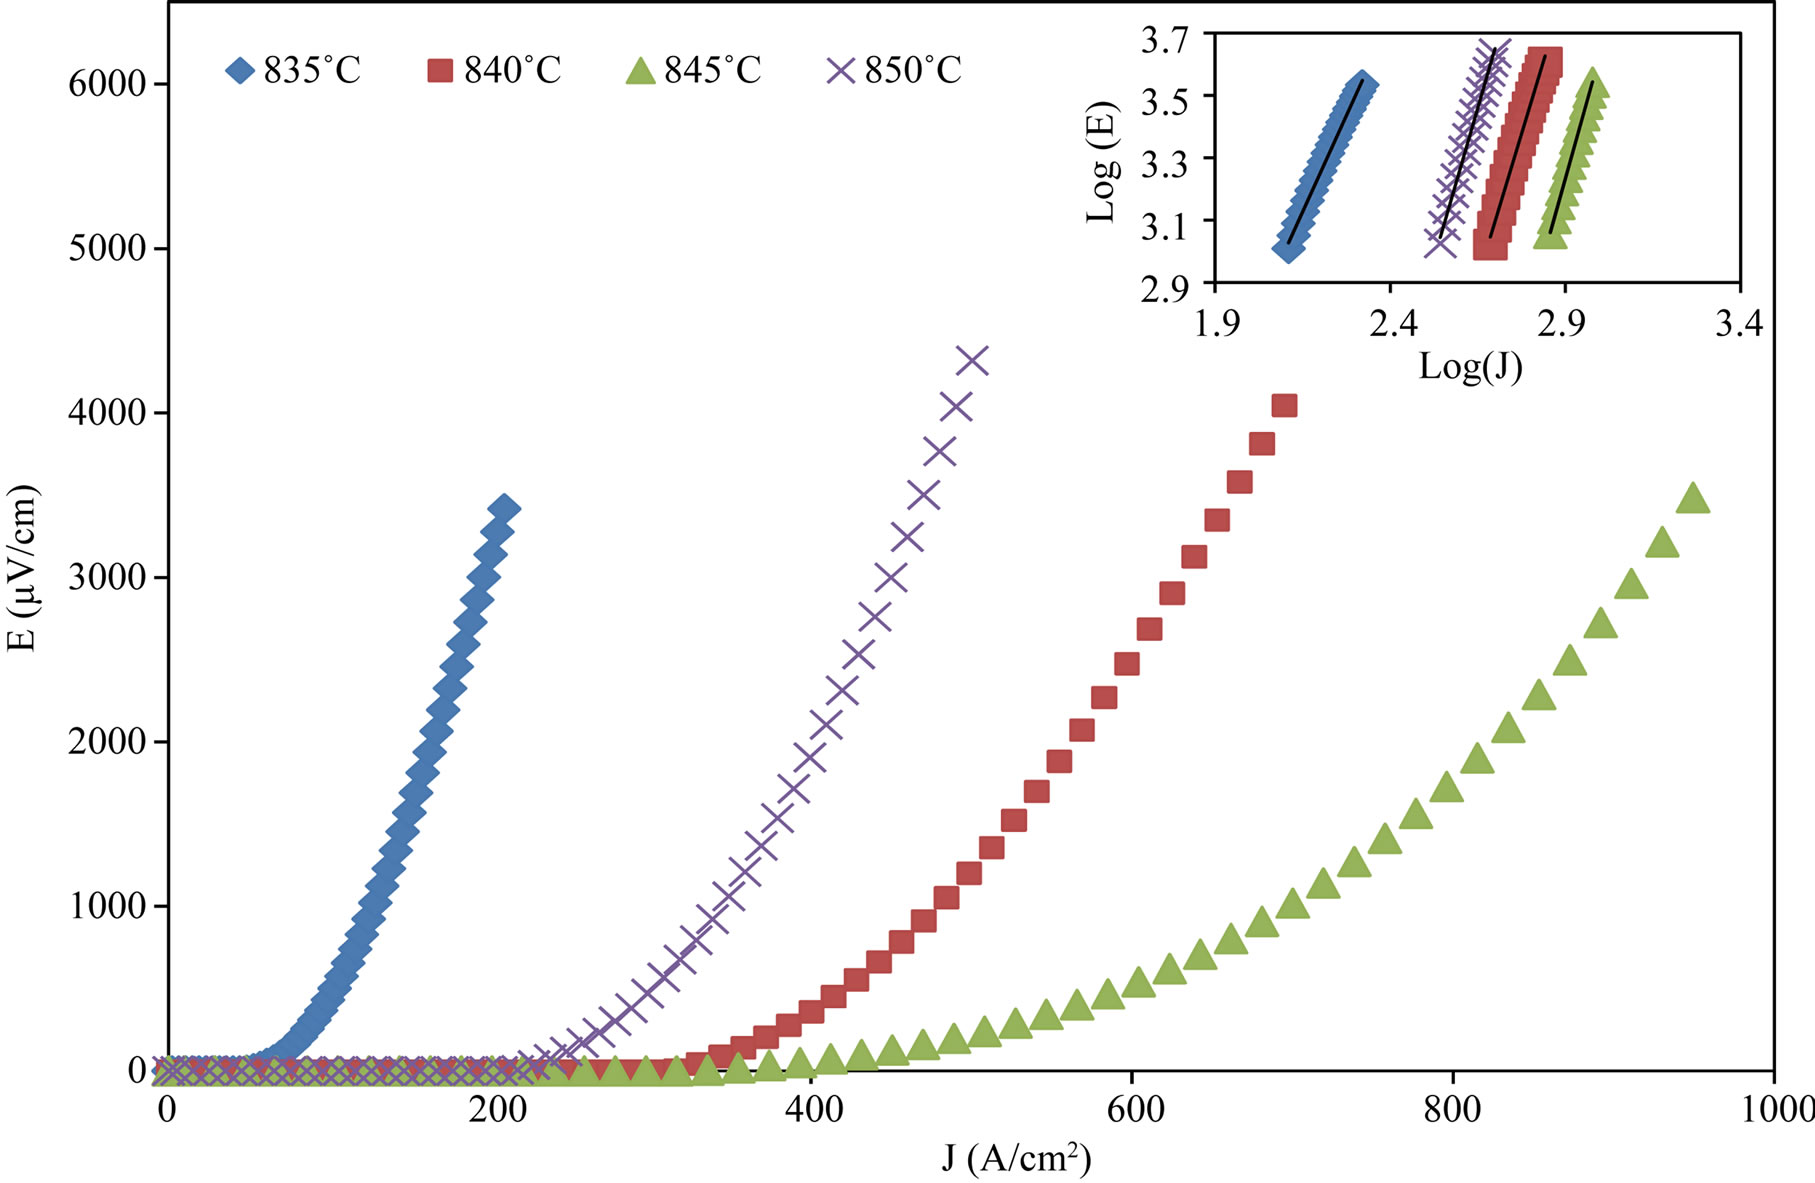
Figure 10. E-J curves for (Bi, Pb)-2223 superconducting samples with different sintering temperatures 835˚C - 850˚C.
of Jc with sintering temperature. It is clear that, Jc increases as sintering temperature increases from 835 to 845˚C, and they decreases with further increases in sintering temperature. The increase in Jc is probably due to the enhancement in intergranular flux pinning which results from the pinning centers in the (Bi, Pb)-2223 phase and also from the rearranging of the grains. While the decrease in Jc is attributed to the formation of a liquid phase that acts as insulating layers around the superconductor grains and decrease the grain connectivity leading to a decrease in Jc. Also, the shape of the E-J characteristic of a superconductor can be described using [36]
 (1)
(1)
where a, n are experimental or material constants. The n-value is often called the order of transition or index. It is important to note that n characterizes the homogeneity of superconductors. High n values tend to signify more homogeneous superconductors. To calculate n, we consider values in the linear region of E-J curves, 1000 mV∙cm–1 to 4300 mV∙cm–1, The LogE-LogJ curves for these values will represent a straight line of slope n, inset in Figure 10. Table 1 summarizes the n values with different sintering temperatures 835˚C - 850˚C. As we can see the n value increases with increase in sintering temperature till 845˚C then starts to decrease. The highest value of n at sintering temperature 845˚C indicates the high quality of this sample, consisting with the lowest value of residual resistivity and the highest superconducting tranaition temperature.
4. Conclusion
In summary, our experimental results show that the partial replacement of Bi2O3 by both PbO2 and PbO instead of PbO affected the formation, melting point, superconducting transition temperature and transport critical current density of (Bi, Pb)-2223 phase. It was found that the volume fraction of (Bi, Pb)-2223 phase increased as the sintering temperature increased. The samples sintered at temperature higher than 845˚C were stretched and quasi melted. Both values of liquid temperature and melting temperature of the (Bi, Pb)-2223 phase substituted by PbO2 and PbO were lowered than those prepared by PbO, indicting the change in the partial pressure of oxygen. The sample sintered at 845˚C had the optimum value of both superconducting temperature and transport critical current density, this leads to study the effect of Ag2O addition on (Bi, Pb)-2223 phase, prepared by both PbO2 and PbO instead of PbO at 845˚C, in the next article.
5. Acknowledgements
The authors of the present study wish to express their thanks to the superconductivity and metallic-glass lab, Physics Department, Faculty of Science, Alexandria University, Alexandria, Egypt, for aiding with the experimental procedures.
REFERENCES
- M. Cyrot and D. Pavuna, “Introduction to Superconductivity and High-Tc Materials,” World Scientific, Singapore, 1995.
- G. Blatter, M. V. Feigelman, V. B. Ceshkenbein, A. I. Larkin and V. M. Vinokur, “Vortices in High-Temperature Superconductors,” Reviews of Modern Physics, Vol. 66, No. 4, 1994, pp. 1125-1388. doi:10.1103/RevModPhys.66.1125
- F. Marti, G. Grasso, J. C. Grivel and R. Flükiger, “Effects of the Reaction Time on Various Properties of (Bi,Pb)2Sr2Ca2Cu3Ox Tapes,” Superconductor Science and Technology, Vol. 11, No. 5, 1998, p. 485. doi:10.1088/0953-2048/11/5/008
- K. Watanab and M. Kojima, “The Effect of V2O5 Additive on the High-Tc (2223) Phase of Bi-Pb-Sr-Ca-Cu-O System Superconductors,” Superconductor Science and Technology, Vol. 11, No. 4, 1998, p. 392. doi:10.1088/0953-2048/11/4/008
- V. Garnier, I. Monot-Laffez and G. Desgardin, “Kinetics Study of the Bi-2223 Grain Growth Thickness,” Physica C, Vol. 349, No. 1-2, 2001, pp. 103-112. doi:10.1016/S0921-4534(00)01534-3
- A. L. Crossley, Y. H. Li, A. D. Caplin and J. L. M. Drisoll, “The Effect of Low Oxygen Partial Pressure and High Pb-Doping on Bi-2212 Phase Formation and Flux Pinning,” Physica C, Vol. 314, No. 1-2, 1999, pp. 12-18. doi:10.1016/S0921-4534(99)00036-2
- C. N. R. Rao, L. Ganapathi, R. Vijayaraghavan, G. R. Rao, K. Murthy and R. A. Mohan Ram, “Superconductivity in the Bi2(Ca, Sr)n+1CunO2n+4 (n = 1, 2, or 3) Series: Synthesis, Characterization and Mechanism,” Physica C, Vol. 156, No. 5, 1988, pp. 827-833. doi:10.1016/0921-4534(88)90169-4
- C. Michel, M. Hervieu, M. M. Borel, A. Grandin, F. Deslandes, J. Provost and B. Raveau, “Superconductivity in the Bi-Sr-Cu-O System,” Zeitschrift für Physik B Condensed Matter, Vol. 68, No. 4, 1987, pp. 421-423. doi:10.1007/BF01471071
- J. Akimitsu, A. Yamazaki, H. Sawa and H. Fujiki, “Superconductivity in the Bi-Sr-Cu-O System,” Japanese Journal of Applied Physics, Vol. 26, No. 12, 1987, pp. L2080-L2081. doi:10.1143/JJAP.26.L2080
- H. Maeda, Y. Tanaka, M. Fukutomi and T. Asano, “A New High-Tc Oxide Superconductors without a Rare Earth Element,” Japanese Journal of Applied Physics, Vol. 27, No. 2, 1988, pp. L209-L210. doi:10.1143/JJAP.27.L209
- M. Takano, J. Takada, K. Oda, H. Kitaguchi, Y. Miura, Y. Ikeda, Y. Tomii and H. Mazaki, “High-Tc Phase Promoted and Stabilized in the Bi,Pb-Sr-Ca-Cu-O System,” Japanese Journal of Applied Physics, Vol. 27, No. 6, 1988, pp. L1041-L1043. doi:10.1143/JJAP.27.L1041
- A. Ono, S. Sueno and F. P. Okamura, “Preparation and Properties of Single Crystals of the High-Tc Oxide Superconductor in the Bi-Sr-Ca-Cu-O System,” Japanese Journal of Applied Physics, Vol. 27, No. 4, 1988, pp. L786-L789. doi:10.1143/JJAP.27.L786
- Y. Oka, N. Yamamoto, A. Yuba, H. Kitaguchi and J. Takada, “Crystal Phase of BiSrCaCu2Ox Heat Treat in Vacuum-Sealed System,” Japanese Journal of Applied Physics, Vol. 27, No. 8, pp. L1429-L1431.
- T. Hatano, K. Aota, S. Ikeda, K. Nakamura and K. Ogawa, “Growth of the 2223 Phase in Leaded Bi-Sr-Ca-Cu-O System,” Japanese Journal of Applied Physics, Vol. 27, No. 11, 1988, pp. L2055-L2058. doi:10.1143/JJAP.27.L2055
- H. Maeda and K. Tagano, “Bismuth—Based High— Temperature Superconductors,” Applied Physics Series, Vol. 6. 1996, p. 34.
- M. Mizuno, H. Endo, J. Tsuchiya, N. Kijima, A. Sumiyama and Y. Oguri, “Superconductivity of Bi2Sr2Ca2Cu3PbxOy (x = 0.2, 0.4, 0.6),” Japanese Journal of Applied Physics, Vol. 27, No. 7, 1988, pp. L1225-L1227. doi:10.1143/JJAP.27.L1225
- Y. Ikeda, M. Takano, Z. Hiroi, K. Oda, H. Kitaguchi, J. Takada, Y. Miura, Y. Takeda, O. Yamamoto and H. Mazaki, “The High-Tc with a New Modulation Mode in the Bi,Pb-Sr-Ca-Cu-O System,” Japanese Journal of Applied Physics, Vol. 27, No. 11, 1988, pp. L2067-L2070. doi:10.1143/JJAP.27.L2067
- V. Garnier, A. Ambrosini and G. Desgardin, “Secondary Phase Formation during the Bi-2223 Phase Calcination Process,” Journal of Materials Science: Materials in Electronics, Vol. 13, No. 6, 2002, pp. 353-356. doi:10.1023/A:1015648515789
- S. Koyama, U. Endo and T. Kawai, “Preparation of Single 110 K Phase of the Bi-Pb-Sr-Ca-Cu-O Superconductor,” Japanese Journal of Applied Physics, Vol. 27, 1988, pp. L1861-L1863. doi:10.1143/JJAP.27.L1861
- G. Calestani, C. Rizzoli, G. Andreetti, E. Buluggiu, D. C. Giori, A. Valenti, A. Vera and G. Amoretti, “Composition Effects on the Formation and Superconducting Character of c ≈ 31 Å and c ≈ 37 Å phases in the Bi-Sr-Ca-Cu-O and Bi-Pb-Sr-Ca-Cu-O Systems X-Ray and ESR Analysis,” Physica C, Vol. 158, No. 1-2, 1989, pp. 217-224. doi:10.1016/0921-4534(89)90320-1
- M. K. Crawford, R. L. Harlow, E. M. McCarron, W. E. Farneth, J. D. Axe, H. Chou and Q. Huang, “Lattice Instabilities and the Effect of Copper-Oxygen-Sheet Distortions on Superconductivity in Doped La2CuO4,” Physical Review B, Vol. 44, No. 14, 1991, pp. 7749-7752. doi:10.1103/PhysRevB.44.7749
- A. I. Abou-Aly, R. Awad, S. A. Mahmoud and M. Barakat, “EPR Studies of (Bi, Pb)-2223 Phase Substituted by Ruthenium Ions,” Journal of Alloys and Compounds, Vol. 509, No. 27, 2011, pp. 7381-7388. doi:10.1016/j.jallcom.2011.03.160
- S. Stassen, A. Rulmont, M. Ausloos and R. Cloots, “Interdiffusion between SrCuO2 and a Glassy Precursor. Toward the Understanding of the Mechanism of Formation of Bi Based 2223 Superconducting Bulk Ceramics,” Physica C, Vol. 270, No. 1-2, 1996, pp. 135-143. doi:10.1016/0921-4534(96)00487-X
- A. Jeremie, K. Alami-Yadri, J. C. Grivel and R. Flukiger, “Bi,Pb(2212) and Bi(2223) Formation in the Bi-Pb-Sr-Ca-Cu-O System,” Superconductor Science and Technology, Vol. 6, No. 10, 1993, p. 730. doi:10.1088/0953-2048/6/10/005
- A. K. Bandyopadhyay, E. Gmelin, B. V. Kumaraswamy, V. P. S. Awana, D. Varandani, N. Sen and A. V. Narlikar, “Effect of Lead Substitution in Bismuth-Based Cuprate Systems Containing Both Low-Tc and High-Tc Phases,” Physical Review B, Vol. 48, No. 9, 1993, pp. 6470-6476. doi:10.1103/PhysRevB.48.6470
- F. Ben Azzouz, A. M’chirgui, B. Yangui, C. Boulesteix and M. Ben Salem, “Synthesis, Microstructural Evolution and the Role of Substantial Addition of PbO during the Final Processing of (Bi,Pb)-2223 Superconductors,” Physica C, Vol. 356, No. 1-2, 2001, pp. 83-96. doi:10.1016/S0921-4534(01)00124-1
- E. Guilmeau, B. Andrzejewski and G. Desgardin, “The Effect of Bi2201 Phase on the Intergranular Critical Field and Current Density in Bi2223 Superconductors,” Physica C, Vol. 377, No. 3, 2002, pp. 304-312. doi:10.1016/S0921-4534(01)01207-2
- P. Kameli, H. Salamati and M. Eslami, “The Effect of Sintering Temperature on the Intergranular Properties of Bi2223 Superconductors,” Solid State Communications, Vol. 137, No. 1-2, 2006, pp. 30-35. doi:10.1016/j.ssc.2005.10.026
- S. Martin, A. T. Fiory, R. M. Fleming, L. F. Schneemeyer and J. V. Waszczak “Normal-State Transport Properties of Bi2+xSr2-yCuO6+δ Crystals,” Physical Review B, Vol. 41, No. 1, 1990, pp. 846-849. doi:10.1103/PhysRevB.41.846
- P. W. Anderson and Z. Zou, “‘Normal’ Tunneling and ‘Normal’ Transport: Diagnostics for the ResonatingValence-Bond State,” Physical Review Letters, Vol. 60, No. 2, 1988, pp. 132-135. doi:10.1103/PhysRevLett.60.132
- C. M. Varma, P. B. Littlewood, S. Schmitt-Rink, E. Abrahams and A. E. Ruckenstein, “Phenomenology of the Normal State of Cu-O High-Temperature Superconductors,” Physical Review Letters, Vol. 63, No. 18, 1989, pp. 1996- 1999. doi:10.1103/PhysRevLett.63.1996
- A. Virosztek and J. Ruvalds, “Nested-Fermi-Liquid Theory,” Physical Review B, Vol. 42, No. 7, 1990, pp. 4064-4072. doi:10.1103/PhysRevB.42.4064
- R. Awad, A. I. Abou Aly, M. Kamal and M. Anas, “Mechanical Properties of (Cu0.5Tl0.5)-1223 Substituted by Pr,” Journal of Superconductivity and Novel Magnetism, Vol. 24, No. 6, 2011, pp. 1947-1956. doi:10.1007/s10948-011-1150-4
- C. Terzioglu, H. Aydin, O. Ozturk, E. Bekiroglu and I. Belenli, “The Influence of Gd Addition on Microstructure and Transport Properties of Bi-2223,” Physica B, Vol. 403, No. 19-20, 2008, pp. 3354-3359. doi:10.1016/j.physb.2008.04.033
- M. Thomas, W. Katona and S. Pierson, “Zero-Field CurrentVoltage Characteristics in High-Temperature Superconductors,” Physica C, Vol. 270, No. 3-4, 1996, pp. 242-248. doi:10.1016/S0921-4534(96)00521-7
- D. A. Cardwell and D. S. Ginley “Handbook of Superconducting Materials,” Institute of Physics Publishing, London, 2003. doi:10.1887/0750308982
NOTES
*Corresponding author.