Advances in Bioscience and Biotechnology
Vol.4 No.5(2013), Article ID:32254,12 pages DOI:10.4236/abb.2013.45083
Evaluation of the effect of compound aqueous solubility in cytochrome P450 inhibition assays
![]()
1Fundación Centro de Excelencia, Investigación de Medicamentos Innovadores de Andalucía, Granada, Spain
2Instituto de Química Médica, Madrid, Spain
3Centro Nacional de Investigaciones Oncológicas (CNIO), Madrid, Spain
Email: jose.perezdelpalacio@medinandalucia.es
Copyright © 2013 José Pérez et al. This is an open access article distributed under the Creative Commons Attribution License, which permits unrestricted use, distribution, and reproduction in any medium, provided the original work is properly cited.
Received 26 February 2013; revised 10 April 2013; accepted 11 May 2013
Keywords: CYP Inhibition; Fluorogenic Substrates; Drug Safety; Human Liver Microsomes; Drug-Drug Interactions
ABSTRACT
It is a common practice in drug discovery organizations to screen new chemical entities in order to predict future drug-drug interactions. For this purpose, there are two main assay strategies, one based on recombinant cytochrome P450 (rCYP) enzymes and fluorescent detection, and other on human liver microsomes (HLM) and liquid chromatography coupled to mass spectrometry. Many authors have reported a poor correlation between both technologies, giving rise to concerns about the usefulness of fluorometric methods for predicting drug-drug interactions. In this study, we investigated the role that compound aqueous kinetic solubility may play in this lack of correlation. We found that drug discovery compounds with unacceptable kinetic solubility, measured by a turbidimetric solutibility assay, tended to yield higher IC50 values in in vitro models based on human liver microsomes, whereas compounds with kinetic solubility values higher than 50 µM showed very similar IC50 values in both in vitro models. Our results show that the turbidimetric solubility assay is a useful tool to identify those discovery compounds that may require further investigation in order to avoid overlooking future drug-drug interactions.
1. INTRODUCTION
In the drug discovery process, it is important to determine possible drug-drug interactions of new drug candidates mediated by CYP450 inhibition. These drug-drug interactions may lead to toxicity due to the elevation in plasma levels of one to the drugs involved in the interaction [1]. Monitoring the inhibitory potency of these compounds on cytochrome P450 (CYP) activity using well-characterized CYP substrates helps predicting these drug-drug interactions. In early drug discovery programs, the potential of CYP450 inhibition of new chemical entities is frequently quantified in terms of IC50 values. A risk classification of potential inhibitors as low (IC50 > 1 µM), medium (1 µM < IC50 < 10), or high (IC50 > 10 µM) is often sufficient for ranking and prioritizing compounds (Krippendorff et al., 2007).
The most widely accepted approach for in vitro evaluation of CYP inhibitory potential requires the use of hu man liver microsomes (HLM) as the source of enzyme, with “drug-like” substrates, using liquid chromatography coupled to mass spectrometry (LC-MS) for quantifying the enzymatic activity. However, this methodology is expensive and time-consuming, and therefore does not deliver the high throughput typically required in the drug discovery process. Alternatively, several high throughput methodologies have been developed using fluorogenic probe substrates and recombinant CYP450 enzymes (Miller et al., 2000).
Interestingly, it has been demonstrated that IC50 values obtained for certain compounds in cytochrome P450 inhibition assays may vary considerably depending on the assay methodology used [2].
Several factors, such as enzyme source, enzyme concentration or substrate specificity are usually considered responsible for such variations. Our hypothesis is that the physicochemical properties of the tested compounds, such as their aqueous solubility, may also play a key role in IC50 value variations across methodologies.
When liver microsomes are used for CYP inhibition experiments, the excess of lipids in the assay can increase the apparent aqueous solubility of lipophilic compounds. Actually, the solubility of the test compounds remains the same while the concentration of the free test compound decreases. The decreased free concentrations during the incubation result in an apparent increase in the IC50 value. In contrast, when recombinant enzymes are used, the higher specific enzymatic content results in a much smaller amount of lipids in incubation, thereby minimizing the partitioning of test compounds in incubation and the uncertainty in test compound concentration [3]. According to the hypothesis that the phospholipid component of microsomes is the primary contributor to the non-specific binding of inhibitors, the physicochemical properties of the compounds, such as aqueous solubility, might have a strong influence on their behavior in the different assays.
The determination of aqueous solubility in the early stages of drug discovery is commonly conducted by means of a turbidimetric measurement, a technique frequently labeled as a kinetic solubility (KS) assay, which allows a relatively high throughput.
This study was undertaken to assess how compound aqueous solubility contributes to the potential variation in IC50 between CYP inhibition assays. For this purpose we selected 42 compounds from the Instituto de Quimica Médica-CSIC (IQM-CSIC) drug discovery research program as lead compounds targeting different enzymes for the treatment of neurodegenerative diseases, along with 20 commercial specific inhibitors of different CYP450 isoforms. We determined the IC50 value of each molecule in both CYP inhibition assays, using rCYP/fluorometric or HLM-LC/MS-MS methodologies. In parallel, we determined the aqueous solubility by turbidimetric measurement for each molecule considered.
2. MATERIALS AND METHODS
Nicotinamide adenine dinucleotide phosphate reduced tetrasodium salt, standard CYP probe substrates (testosterone, diclofenac and dextromethorphan), LC-MS/MS internal standards (cortisone and levallorphan) and CYP control inhibitors (ketoconazole, quinidine, sulfaphenazole) were obtained from Sigma Aldrich (St. Louis, MO). LC-MS/MS internal standard 4’-hydroxydiclofenac 13C6 was purchased from Toronto Research Chemical (Toronto).
The fluorogenic reagents catalyzed 7-Benzyloxy-4-(trifluoromethyl) coumarin (BFC), 7-methoxy-4-trifluoromethylcoumarin (MFC), and 3-[2-(N,N-diethyl-N-methylamino)ethyl]-7-methoxy-4-methylcoumarin (AMMC) were obtained from BD GentestCorp (Woburn, MA).
IQM drug discovery compounds were obtained from the Instituto de Química Médica-CSIC (IQM-CSIC) library. All test compounds were provided in powder form and dissolved in 25 mM and 10 mM DMSO stock solutions and 1/2 serially diluted in DMSO.
For CYP inhibition assays, several concentrations were prepared and diluted with acetonitrile [35:65] [v/v] in order to minimize the DMSO final content in enzyme incubations. The same stock solutions were used for the comparisons of CYP inhibition assays and turbidimetric solubility assays.
Human liver microsomes (mixed gender, pool of 22) were purchased from BD Gentest Corp (Bedford, MA). The recombinant CYP3A4 + OR, CYP2D6*1 + OR, CYP2C9*1 + OR, were purchased from BD Gentest Corporation. The marketed compounds evaluated in these assays were obtained from Sigma Aldrich.
Before CYP inhibition reactions, reaction times and microsomal protein concentrations were verified to be within the limits of kinetics linearity (not shown). All probe substrate concentrations selected for these determinations were approximately equal to the apparent reaction Km. All compounds were tested in triplicates in every methodology studied.
2.1. CYP Inhibition Assay by HLM-LC/MS-MS Method
Incubations for evaluating CYP inhibition were conducted in a 96-well plate format at 37˚C. The final incubation (200 μL total volume) contained 0.25 mg/mL of HLM protein in 100 mM potassium phosphate buffer (pH 7.4), 1 mM NADPH, and test compound at 0.078, 0.313, 0.625, 1.25, 2.5, 5, 11, 22, 44 and 88 μM. The probe reaction for CYP3A4 was conducted with 50 μM testosterone and HLM protein for 15 min. In the case of the CYP2D6 probe reaction was conducted with 22 μM dextromethorphan for 15 min. The CYP2C9 probe reaction was conducted with 10 μM diclofenac for 15 min.
Test compounds in DMSO/AcN (v/v) (2 µL) were combined with 98 µL NADPH solution, and reactions were initiated by the addition of 100 µL of enzyme-substrate solution. Reactions were terminated with the addition of a quench solution (90 μL) of acetonitrile containing internal standards for LC-MS/MS (60 ppb cortisone, 100 ppb 4’-hydroxydiclofenac 13C6, 60 ppb levallorphan).
Control inhibitors, such as ketoconazole for CYP3A4, quinidine for CYP2D6, or sulfaphenazole for CYP2C9, were included in all incubation plates. The final DMSO content was established at 0.35% for all isoforms. Reaction supernatants, clarified by 10 min of centrifugation at 3717 G (4˚C), were analyzed by LC/MS-MS for relative quantification of the metabolites (6β-hydroxy-testosterone, 4’-hydroxy-diclofenac, or dextrorphan) generated from the corresponding probe substrates.
2.2. LC/MS-MS Analysis
Quantitative analysis of probe substrate metabolites in quenched reaction supernatant was performed using a Shimadzhu AD10 liquid chromatography equipped with an API4000 (triple quadrupole) mass spectrometer (AB SCIEX). Chromatographic separation was achieved using a Discovery HS C18 (50 mm 2 mm, 5 µm) column (Supelco, Torrance, CA) preceded by a Discovery HS C18 precolumn. The column temperature was 25˚C. The mobile phase consisted of 2 solvents: (A) water/methanol 90/10 (v/v) in 0.1% formic acid and (B) acetonitrile/ water in 0.1% formic acid. Mobile phase B was held at 10% for 0.5 minutes, then increased to 45% B for 1.50 minutes. Solvent composition was held for 0.30 minutes, increased again to 95% B for 2.30 minutes and held for 0.50 minutes, and returned to 10% B for 0.10 minutes for re-equilibration, being held for 0.61 minutes. Total run time was 3.51 minutes, with a flow rate of 1mL/minute.
The mass spectrometer was operated with APCI ionization probe in positive mode using multiple reactionmonitoring scanning mode. Integration of reaction product and internal standard peak areas was performed using Analyst software.
2.3. CYP Inhibition Assay by rCYP Fluorometric Method
Fluorometric CYP inhibition assays were conducted at 37˚C in 96-well, flat-bottom, black polystyrene plates. Incubation mixtures containing CYP protein, substrate, and potassium phosphate buffer (pH 7.4) were prepared with the following final concentrations: CYP3A4, 25 pmol/mL, 20 µM BFC in 175 mM buffer; CYP2D6, 20 pmol/mL 1.5 µM AMMC in 25 mM buffer; and CYP2C9, 25 pmol/mL, 50 µM MFC in 25 mM buffer. Reaction times were verified to be within the limits of kinetics linearity (not shown). All probe substrate concentrations selected for these determinations were approximately equal to the Km. Test compounds dissolved in DMSO/AcN (v/v) (2 µL) were combined with 98 µL NADP/cofactors solution, and reactions were initiated by the addition of 100 µL of enzyme-substrate solution. Incubation times for CYPs 3A4, 2D6, and 2C9 were 15, 30 and 45 minutes, respectively. Then fluorescence was determined in a Tecan Ultra Evolution reader, using the following excitation/ emission wavelengths: 3A4 (430/535 nm), 2D6 (360/465 nm), and 2C9 (430/535 nm). Two separate control incubations for fluorescent interference and quenching interference containing test compound (88 µM) and recombinant enzymes (at the same concentration as the inhibition incubations) were included for each compound tested. A compound was excluded from the data set if the fluorescent signal from the control incubation was >30% of the dynamic window for the reaction, as evidence of fluorescence interference. Conversely, a known amount of product metabolite was added to quenching control positions post-incubation. This determined whether the production of metabolites from potential inhibitors could result in a quench of signal of product metabolite units (RFU) produced for a known amount, established in the absence of potential inhibitors. If the fluorescent signal from the control incubation was <30% of the known fluorescent signal for post-incubation addition of metabolite product, as evidence of quenching interference, the IC50 value for those potential inhibitors was not calculated.
The key differences between the 2 CYP innibition methodologies are summarized in Table 1.
2.4. Turbidimetric Solubility Assay
The turbidimetric solubility assay was conducted in 96- well, flat-bottom, transparent polystyrene plates. Six 1/2 serial dilutions of an initial 10 mM test compound solution were prepared in DMSO. As currently practiced, 2 µL of a concentrated stock solution of the test compound in DMSO is added to a 198 µL of 100 mM potassium phosphate buffer (pH 7.4) solution to give a final DMSO concentration of 1% in each well and a final test compound concentration range between 3 µM and 100 µM. Three replicates were prepared per concentration. After a 2 hours incubation time, to avoid missing slow precipitation that could affect the outcome of a biochemical experiment, the absorbance is measured at 620 nm
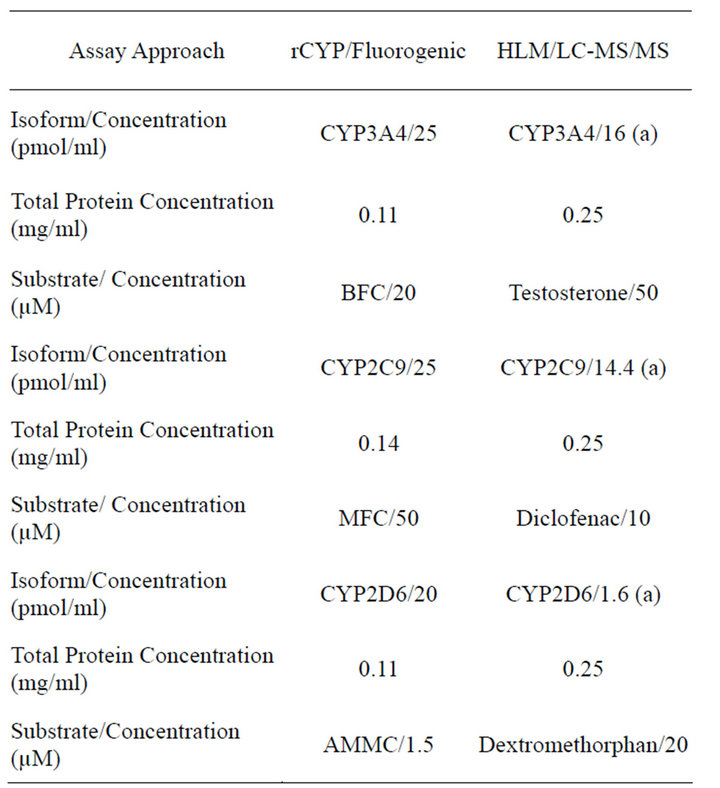
Table 1. Summary of key assay conditions.
rCYP = recombinantly expressed CYPs; HLM = human liver microsomes; LC-MS/MS = Liquid chromatography coupled to mass-mass spectrometry; (a) Calculated based on the total CYP450 content of 330 pmole/mg (BDBiosciences. Lot. Number 59488) and distribution of each isoenzyme (Rodrigues, 1999) [32] (3A4 = 20%, CYP2C9 = 18%, CYP2D6 = 2).
and solubility is estimated from the concentration of test compound that produced an increase in absorbance above the background levels (typically 1% DMSO in buffer). The results are presented as an estimated precipitation range (the lower bound is the concentration at which the compound has fully precipitated). It is assumed that the compound will precipitate at some point between the upper and lower bound range [4].
2.5. Data Analysis
For data analysis we categorized the IC50 values into two groups:
Non-qualified IC50 values are those with discrete value between the minimum dose and the maximum dose (i.e. IC50 = 25 µM).
Qualified IC50 values are those defined by a value higher than the maximum dose (i.e. IC50 > 88 µM).
Calculations of IC50 values and solubility limits were performed using Gene Data Screener® application software.
Calculations of cLogP values were achieved using ACDLAbs® application software.
Assay correlations (r) and p values were performed using SPPS® application software.
3. RESULTS
Two sets of compounds were used in this work. The drug discovery compound set was composed of 42 molecules from different drug discovery research programs of the IQM-CSIC. The commercial compound set comprised 20 commercial inhibitors with activity over the three major CYP450 isoforms involved in drug metabolism (CYP3A4, CYP2C9 and CYP2D6).
Each compound set was assessed for their CYP inhibitory potential using fluorogenic substrates together with rCYP isoforms, as well as in the standard HLM + LC-MS/MS CYP assays. In addition, the aqueous kinetic solubility of each compound was determined using a turbidimetric solubility assay. The complete results for both compound sets are summarized in Tables 2 and 3.
3.1. Distribution of Compounds According to Their Solubility
According to the kinetic solubility classification bands established by Rogge and Taft (2010), the data from the turbidimetric solubility assay revealed that 50% of the commercial compounds showed an acceptable kinetic solubility (>50 µM) in assay buffer, whereas only 9.5% of the drug discovery compounds appeared in this solubility band. The percentage of commercial compounds classified within the marginal kinetic solubility band (12 - 50 µM) was 30%, whereas this percentage increased to 43% for drug discovery compounds. Compounds showing unacceptable kinetic solubility (12 - 3 µM) represented 20% and 47.7% of commercial and drug discovery compounds, respectively.
In contrast, data from calculated logP values (cLogP) did not reveal remarkable differences between the two compound sets. Most compounds (69% for drug discovery compounds and 50% for commercial compounds) displayed a cLog P value between 3 and 5. The distribution of compounds with a cLogP value higher than 5 was very similar for both compound sets (17% for drug discovery compounds and 15% for commercial compounds). Larger differences were observed for compounds displaying cLogP below 3 (14% for drug discovery compounds and 35% for commercial compounds).
3.2. Correlation between CYP Inhibition Assay Data
In general terms we observed a clear tendency of both compound sets to yield lower IC50 values in the flourometric based methodologies throughout the three CYP isoforms, as compared to the HLM + LC-MS/MS based assays (Figure 1, Tables 2 and 3). Only three compounds (IQM 11, IQM 12, IQM 13) displayed much lower IC50 values in the CYP3A4 HLM/LC-MS assay than in the CYP3A4 fluorometric assay. According to the linear correlation analysis, performed with the compounds with IC50 values under the maximum dose tested in both assay formats (Figure 1), the commercial compounds showed higher correlation coefficients in the three isoforms (r = 0.81 - 0.98, N= 8 - 13) than drug discovery compounds (r = 0.18 - 0.68, N = 12 - 30). For both sets of compounds, CYP2C9 displayed the weakest correlation (Tables 1 and 2, Figure 1).
3.3. Correlation of the CYP Inhibitory Potential Category between Assays
In drug discovery programs, compounds are often categorized in three groups according to their activity as CYP inhibitors [5]: Potent inhibitors (IC50 < 1 µM), moderate (IC50 between 1 and 10 µM) and weak inhibitors (IC50 > 10 µM).
In order to analyze in more detail the extent of the matching between the fluorometric and LC/MS based methods, we followed the following criteria: one compound was considered as matching, or giving comparable results in both methodologies, if it was categorized in the same classification band in both assays, or displayed an IC50 ratio between both methodologies of 3-fold or lower. For this analysis, we considered all of the compounds tested in both the drug discovery compound set and the commercial compound set.
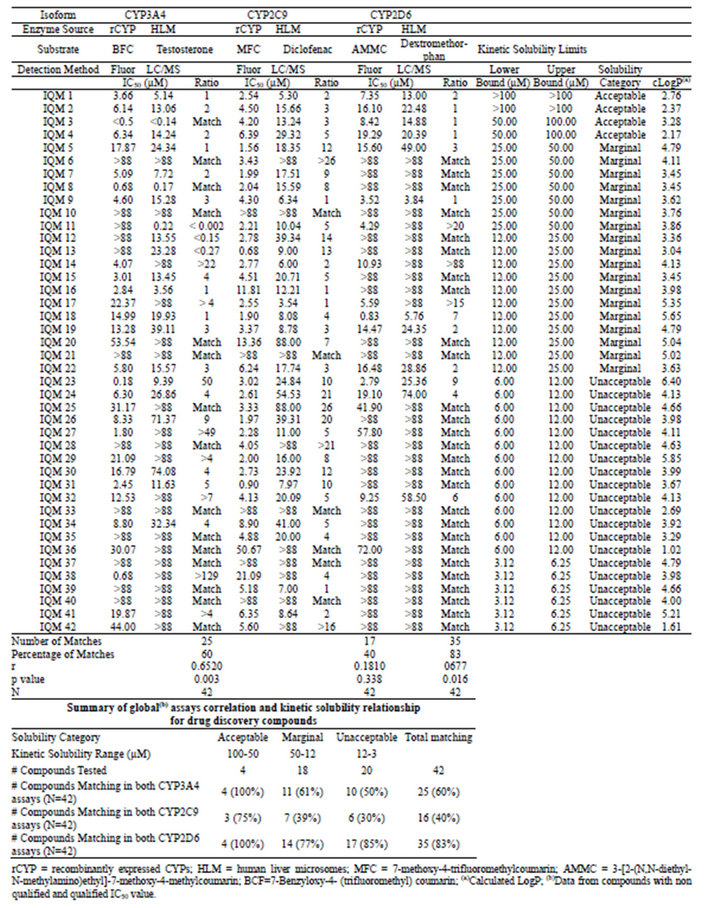
Table 2. Summary of IC50 values and kinetic solubility obtained for drug discovery compounds.
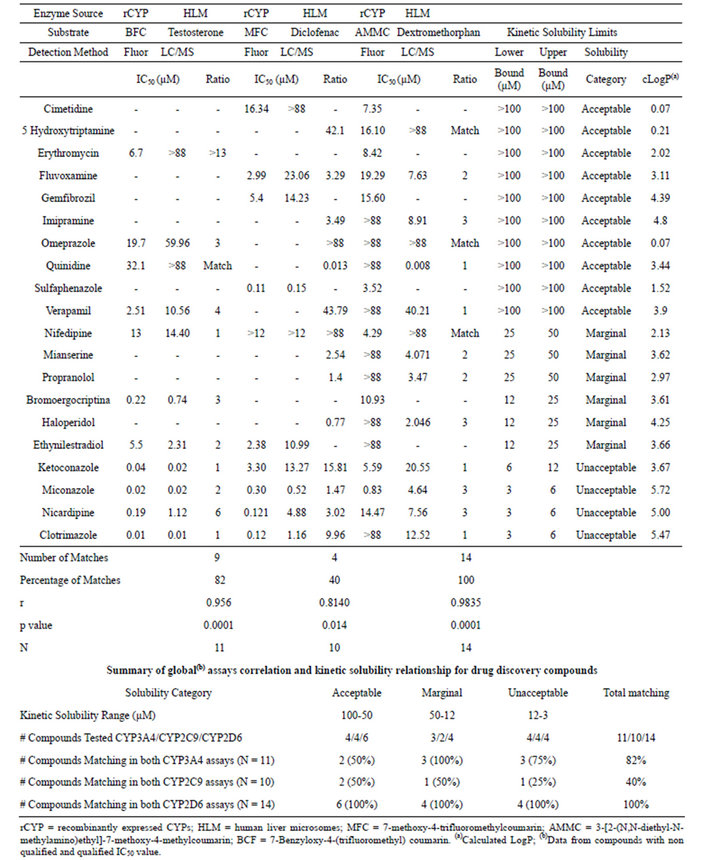
Table 3. Summary of IC50 values and kinetic solubility obtained for drug discovery compounds.
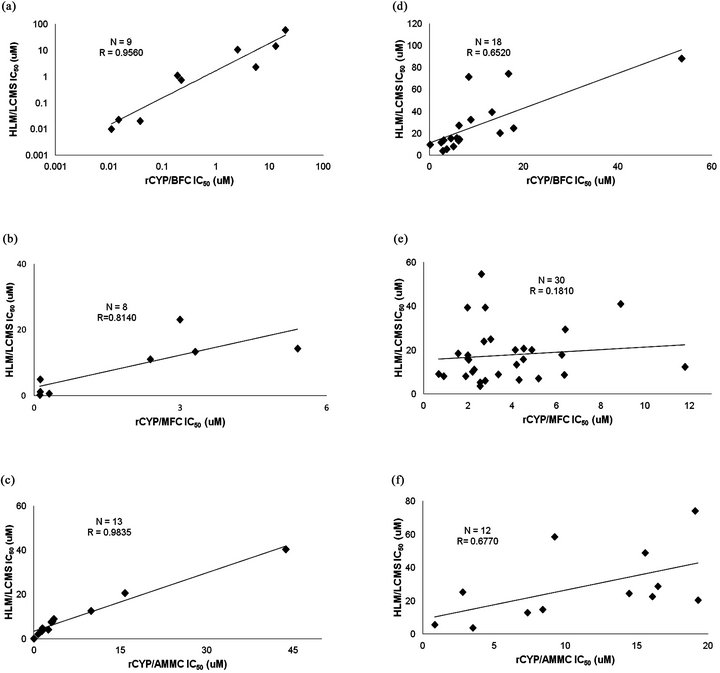
Figure 1. Correlation between rCYP fluorometric and HLM/LC-MS assays. Non-qualified IC50 values obtained in rCYP fluorometric assays are represented versus the values obtained in HLM/LC-MS for the same compounds, in order to calculate the coefficient of linear correlation. (a) CYP3A4 BFC versus Testosterone for commercial compounds; (b) CYP2C9 MFC versus Diclofenac for commercial compounds; (c) CYP2D6 AMMC versus Dextromethorphan for commercial compounds; (d) CYP3A4 BFC versus Testoterone for drug discovery compounds; (e) CYP2C9 MFC versus Diclofenac for drug discovery compounds; (f) CYP2D6 AMMC versus Dextromethorphan for drug discovery compounds.
According to these criteria, we observed that for the drug discovery set in CYP3A4, 25 out of 42 compounds (60%) showed comparable results in both assay methodologies. For the same set of compounds, 17 out of 42 (40%) in CYP2C9, and 35 out of 42 compounds (83%) in CYP2D6, complied with this condition. For the commercial compound set, this concordance was observed for 9 out of 11 compounds (82%) in CYP3A4 assays, 4 out of 10 compounds (40%) in CYP2C9 assays and 14 out of 14 compounds (100%) in CYP2D6 assays.
3.4. Relationship between Solubility and Correlation of CYP Inhibition Assay Data
In this analysis, we used all of the compounds tested in both compound sets, and compared the results from the different assay types for the compounds grouped within each category of kinetic solubility. Thus, considering the compounds classified in the acceptable solubility range (>50 µM), all the drug discovery compounds (4 out of 4) tested in the CYP3A4 assays showed matching results between the two assay methods. The same results were obtained for the CYP2D6 assays. For the CYP2C9 assays, 3 out of 4 compounds (75%) matched (Table 2). For the commercial compound set, 2 out of 4 (50%) matched for CYP3A4 and CYP2C9 assays, while for CYP2D6, the 4 compounds tested matched results (Table 3).
In the marginal solubility band (50 µM to 12 µM), the number of drug discovery compounds correlated between the two assay types decreased significantly for the three isoforms. For CYP3A4, the matching compounds were 11 out of 18 (61%), for CYP2C9 7 out of 18 (39%), and for CYP2D6 14 out of 18 (77%) (Table 2). The commercial compounds tested in the same solubility range yielded a matching rate of 3 compounds out of 3 for CYP3A4 and 4 compounds out of 4 for CYP2D6 assays, and 1 compound out of 2 for CYP2C9 (Table 3).
For the compounds within the unacceptable solubility band, the drug discovery compound matching rate was even lower for CYP3A4 and CYP2C9, with 10 out of 20 compounds (50%) and 6 out of 20 compounds (30%), respectively. However CYP2D6 with 17 out of 20 compounds (85%) displayed a matching rate very similar to the previous solubility band (Table 2). The commercial compounds classified in this band showed a matching rate of 3 compounds out of 4 in CYP3A4, 1 compound out of 4 in CYP2C9, and 4 compounds out of 4 in CYP2D6 (Table 3).
3.5. Restricted Compound Analysis
For this analysis, we selected data from compounds with non-qualified IC50 ratio and with qualified IC50 ratio higher than 3-fold.
The effect of compound aqueous solubility on the correlation of CYP450 assay data was evaluated by classifying compounds in two groups according the ratio of their IC50 in the two types of CYP assays below 3-fold or higher than 3-fold (Table 4).
Compounds were grouped based on their kinetic solubility as described above.
Within the drug discovery compound set, none of the 3 compounds in the acceptable solubility classification band (>50 µM) showed an IC50 ratio higher than 3-fold in the CYP3A4 assays. Identical results were obtained in CYP2D6 for the 4 compounds in this solubility band, and just one compound out of the 4 with acceptable KS displayed an IC50 ratio higher than 3-fold for CYP2C9 (Table 4). In the marginal band of aqueous solubility (50 - 12 µM), the IC50 ratio distribution was slightly different. For CYP3A4, 6 compounds out of 14 yielded an IC50 ratio that was higher than 3-fold, whereas for CYP2C9 this proportion was 10 out of 16. For CYP2D6, 4 compounds out of 8 showed an IC50 ratio higher than 3-fold (Table 4). For the compounds with low aqueous solubility (12 - 3 µM), most of the compounds showed an IC50 ratio higher than 3-fold for the three CYP isoforms (all the compounds for CYP3A4 (N = 11) and CYP2D6 (N = 3), and 12 out of 14 compounds for CYP2C9). In relative terms there is a clear bias in the number of drug discovery compounds with IC50 ratios higher than 3-fold towards lower aqueous solubility bands (Figure 2).
As for the commercial compound set (N = 11 for CYP3A4, N = 9 for CYP2C9 and N = 11 CYP2D6), for 2 out of the 4 compounds in the acceptable solubility classification band displayed an IC50 ratio higher than 3-fold in the CYP3A4 and CYP2C9 assays. All the compounds with acceptable solubility displayed an IC50 ratio below 3-fold for CYP2D6. In the marginal band of aqueous solubility (50-12 µM), none of the compounds grouped into this band (N = 3 for CYP3A4, N = 1 for CYP2C9, N = 3 for CYP2D6) showed an IC50 ratio higher than 3-fold. In the unacceptable band of aqueous solubility (12 - 3 µM), only 1 compound out of 4 showed an IC50 ratio higher than 3-fold in the CYP3A4 assays. Just the opposite behavior was observed for these 4 compounds for CYP2C9 (3 out of 4 with IC50 ratios higher than 3-fold), whereas for CYP2D6, all these compounds displayed IC50 ratios below 3-fold.
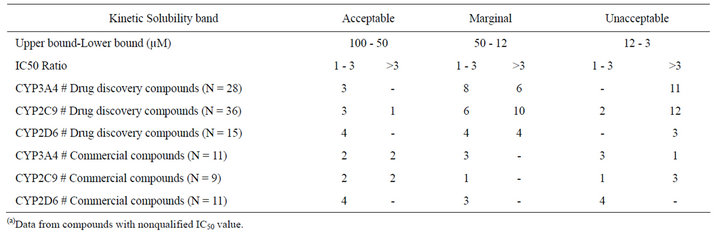
Table 4. Summary of restricted(a) assay correlation and solubility relationship for drug discovery compounds and commercial drugs.
In terms of their IC50 ratio, the commercial compounds are distributed with no clear trend among the three solubility bands (Figure 2).
4. DISCUSSION
Our results with commercial compounds and previous data [6] support the notion that CYP fluorometric assays can rapidly determine a compound’s potential to inhibit CYP450 in a drug discovery setting, based on their good correlation with the standard HLM + LC-MS assays. However, data from our drug discovery compound set showed disparities between rCYP fluorometric and HLM + LC-MS/MS based assays for a significant number of compounds. Therefore the results from fluorometric inhibition assays are sometime insufficient for determining structure-activity relationships predicting drug-drug interactions mediated by CYP inhibition. This general observation is consistent with other studies [2,7,8].
The main causes for such differences have been reviewed [2,7], and key experimental differences, e.g., the choice of the probe substrate, enzyme source and enzyme concentration, might partly explain disparities. However, the role of physicochemical properties, e.g. compound aqueous solubility, has not been properly studied to date. Compound solubility is a well-known source of variability for in vitro compound profiling tests. Poorly soluble compounds may precipitate or bind non
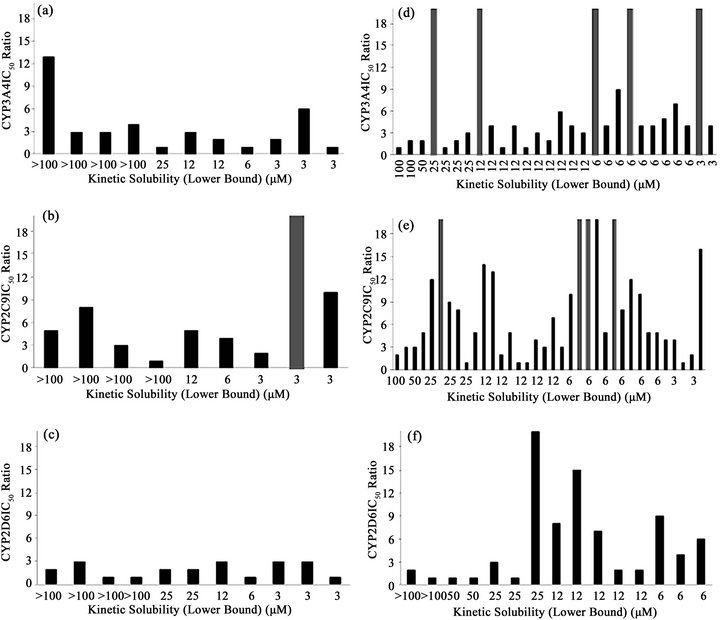
Figure 2. Distribution of IC50 ratios between CYP assay types in terms of compound kinetic solubility. Each bar represents the IC50 ratio between the two asays, for each compound, sorted by their kinetic solubility. Dark gray columns indicate higher IC50 ratios than the maximum values in the y axis. (a) Commercial compounds in CYP3A4 assays; (b) Commercial compounds in CYP2C9 assays; (c) Commercial compounds in CYP2D6 assays; (d) Drug discovery compounds in CYP3A4 assays; (e) Drug discovery compounds in CYP2C9 assays; (f) Drug discovery compounds in CYP2D6 assays.
specifically to other components of the incubation mix during in vitro assays, lowering expected concentrations of free compound. In a CYP450 inhibition assay, poorly soluble compounds might artificially behave as weakor non-inhibitors, which could miss potential drug-drug interactions [9,10]. Turbidimetric solubility assay results indicated that the compound distribution according to their kinetic solubility clearly differed between drug discovery compounds and commercial compounds, especially between the acceptable and unacceptable solubility bands. Obviously, drug discovery compounds were still unoptimized for aqueous solubility, because barely 10% were classified within the acceptable solubility range, whereas half of the commercial compounds fall into this category. At the other extreme, in the unacceptable solubility range, nearly half of the drug discovery compounds were found to fall in this category, more than twice the proportion of commercial compounds.
Computer applications can estimate a compound’s cLogP value, an estimate of its lipophilicity [11]. Interestingly, no major differences in cLogP values were observed between drug discovery and commercial compounds sets. In both cases, calculated cLogP values ranged between 3 and 5. The distribution of compounds with a high cLogP value (>5) was also very similar in both sets. Thus, no clear relationship was observed between the cLogP values and the lack of correlation in the CYP assays.
Although an inverse relation between lipophilicity and solubility is expected, factors such as high/low melting points or pKa influence the rule, making it possible to have water soluble compounds with high cLogP values and low cLogP compounds with a high melting point, and thus very low water solubility. cLogP values are not directly correlated with solubility limits; they merely indicate whether compounds are more or less soluble in water vs. organic solvent [12]. Two compounds may both have cLogP values of –1, indicating that they are more soluble in aqueous than in organic solvents; but nonetheless, they may differ in solubility in aqueous buffers.
As stated previously [13], our drug discovery compounds trended towards molecules with low kinetic solubility. This effect has been previously described as the term, molecular obesity. Higher lipophilicity has consequences during the quest for potency and impacts various factors leading to the attrition of compounds during drug development. The phenomenon of molecular obesity affects development risks and could contribute substantially to the limited productivity of drug discovery programs (Hann and Keseru, 2012).
Low water solubility may contribute to the poor correlation observed for drug discovery compounds in the CYP assays. The excess of lipids in HLM incubations (compared to the rCYP assays), even at low total protein concentrations, can increase nonspecific binding to the lipid membranes for compounds with low aqueous solubility, resulting in an apparent increase in the IC50 value [3]. Tran et al. (2002) demonstrated that lipophilic agents with moderate-to-extensive nonspecific binding exhibited were less inhibitory as the concentration of inactive microsomal protein increased. Hence, compounds displaying lower limits of kinetic solubility conceivably could yield higher IC50 values in the HLM/LC-MS in vitro system.
During experiments with drug discovery compounds, we observed a decrease in the number of compounds matching or achieving IC50 ratios within the 3-fold threshold, as the kinetic solubility range decreased. These observations indicated that those drug discovery compounds with very low kinetic solubility tended to yield higher IC50 values (at least 3-fold) in the HLM/ LC-MS and consequently were more prone to being classified in different inhibitory potential categories. Conversely, drug discovery compounds with high kinetic solubility limits tended to yield more similar IC50 values (IC50 ratios of between 1 and 3) and therefore it is reasonable they will be equally classified for drug-drug interaction purposes.
No clear trend in IC50 value shifts between the two assays systems were observed for drug discovery compounds classified in the marginal kinetic solubility band. Interestingly, we observed (Table 2) that some compounds yielded similar IC50 values in one particular isoform whereas large differences were seen in other isoforms (e.g., IQM 5, IQM 8, IQM 17, IQM 18). These data suggest that factors other than compound aqueous solubility, e.g., probe substrate specificity [14-18], presence of non-target enzymes in HLM, multiple CYP450 metabolism, or accumulation of potent inhibitory metabolites [19], could cause these differences.
Enzyme concentration can also affect the final outcome of CYP inhibition assays [20,21]. However, under a low microsomal protein concentration (0.25 mg/ml), molecules such as ketoconazole and clotrimazole with proven extensive unspecific binding, displayed very similar IC50 values [10]. In our experiments, the concentrations of each isoenzyme in the assay and total protein content were adjusted when possible to reach comparable concentrations in both in vitro models and to minimize unspecific binding (Table 1). In fact, the IC50 values for ketoconazole, sulfaphenazole and quinidine, selective inhibitors of CYP3A4, CYP2C9 and CYP2D6 respectively, were very similar in both in vitro models (Table 3) and were also in very good agreement with results obtained in inhibition experiments carried out by other investigators [20] with much lower total protein concentration. Therefore when using low enough total protein concentrations (e.g. 0.25 mg/ml) in the incubations, this factor seems to contribute in a lesser extent to the IC50 variation. According to these results, a difference of 3-fold or less in the IC50 value as a result of the different protein concentrations could be expected.
In accordance to other investigators [22] we found in previous studies that DMSO inhibited CYP3A4 activity even at low concentrations (0.35%). To asses this issue we performed in former works [23,24] extensive IC50 comparisons of drug discovery compounds and commercial compounds using different organic solvent contents and we did not find significant differences when keeping DMSO level at 0.35%. Although it is still possible that organic solvents could affect differentially depending on the enzyme source studied it does not seem to be the major driver contributing for the lack of correlation between rCYP and HLM.
It is also relevant to point out that when drug discovery compounds with unacceptable kinetic solubility from the linear correlation analysis were excluded, the correlation coefficients increased (r = 0.882 for CYP3A4, r = 0.369 for CYP2C9 and r = 0.824 for CYP2D6), reaching similar values to those observed for commercial compounds except CYP2C9 isoform that still displayed a low correlation coefficient. The same poor correlation was observed when comparing different drug inhibition for the diclofenac and MFC (Cohen et al., 2003).
For commercial compounds, the relationship between assay data correlation and aqueous solubility was less clear. In the acceptable solubility band, both methods should yield similar IC50 values. However, for CYP3A4 and CYPC9 isoforms, 2 compounds out of 4 yielded IC50 ratios higher than 3-fold. The behavior of some of these compounds as CYP inhibitors has been previously reported. Thus, [25] demonstrated that large molecules. e.g., erythromycin, can occupy the CYP3A4 active site, differentially affecting metabolic activity toward testosterone and BFC. Compounds, e.g., fluoxetin and verapamil, that are metabolized by multiple CYP450 isoforms [26- 29] in HLM incubations during the course of IC50 measurements may be prone to underestimation of inhibitor potential in microsomal system, relative to measurements made simply with rCYPs, because of lower effective assay concentrations of parent drug. Others [30] have demonstrated that main verapamil metabolites are irreversible inhibitors of rCYP3A4 and CYP3A activity in HLM, which are further breakdown via CYP3A5 and CYP2C8 [29]. This fact may also contribute to the higher IC50 values observed for verapamil during HLM incubations.
On the contrary, for the commercial compounds within the unacceptable solubility range, no significant IC50 value variations for the CYP3A4 and CYP2D6 isoforms were observed. As previously shown [31], when protein concentration is low enough, very strong inhibitors of CYP3A4, such as ketoconazole, miconazole or clotrimazole, displayed very similar IC50 values regardless of the probe substrate or kinetic solubility. Although some compound properties, e.g., pKa or compound formulation, might partially explain these results, low kinetic solubility seems not to produce a lack of correlation for commercial compounds.
In summary, we can conclude that the distribution of kinetic solubility clearly differs between commercial compounds and drug discovery compounds, with a clear bias towards low water solubility molecules in the latter set. Drug discovery compounds with low kinetic solubility values largely contribute to the lack of correlation between testing methods for CYP inhibition. Drug discovery compounds with low kinetic solubility are prone to be categorized differently in terms of CYP450 inhibitory potency depending on the in vitro model used. The kinetic solubility turbidimetric assay may effectively flag this kind of compounds early in the drug discovery process, ensuring that additional research avoids overlooking any potential drug-drug interactions.
5. ACKNOWLEDGEMENTS
The authors acknowledge and thank Dr Gerald Bills (FUNDACIÓN MEDINA), Dr. Manuel Sánchez, Dr. Consuelo Tudela, and Robert Pelletier for helpful discussion. We also thank Dr. Ana Martinez (IQMCSIC) for kindly providing the drug discovery compound set. This work was funded by the Fundación MEDINA, a public-private partnership of Merck Sharp & Dohme de España S.A./Universidad de Granada/Junta de Andalucía. IGS and DIP acknowledge a pre and postdoctoral fellowship from Ministerio de Ciencia e Innovacion (FPI program) and CSIC (JAE program). This work was supported by MICINN (SAF2009-13015-C02-01), MINECO (SAF2012-37979-C03- 01), Association Francaise contre les Myopathhies (AFM-16169) and MICINN (PPT-300000-2009-11).
REFERENCES
- Zlokarnik, G., Grootenhuis, P.D. and Watson, J.B. (2005) High throughput P450 inhibition screens in early drug discovery. Drug Discovery Today, 10, 1443-1450. doi:10.1016/S1359-6446(05)03580-4
- Bell, L., et al. (2008) Evaluation of fluorescenceand mass spectrometry-based CYP inhibition assays for use in drug discovery. Journal of Biomolecular Screening, 13, 343-353. doi:10.1177/1087057108317480
- McMasters, D.R., et al. (2007) Inhibition of recombinant cytochrome P450 isoforms 2D6 and 2C9 by diverse drug-like molecules. Journal of Medicinal Chemistry, 50, 3205-3213. doi:10.1021/jm0700060
- Rogge, M.C. and Taft, D.R. (2010) Preclinical drug development. 2nd Edition, D.A.T.P. Sciences, 187, Informa Healthcare USA, Inc., New York.
- Krippendorff, B.F., et al. (2007) Optimizing classification of drug-drug interaction potential for CYP450 isoenzyme inhibition assays in early drug discovery. Journal of Biomolecular Screening, 12, 92-99. doi:10.1177/1087057106295897
- Crespi, C.L., Miller, V.P. and Penman, B.W. (1997) Microtiter plate assays for inhibition of human, drug-metabolizing cytochromes P450. Analytical Biochemistry, 248, 188-190. doi:10.1006/abio.1997.2145
- Di, L., et al. (2007) Comparison of cytochrome P450 inhibition assays for drug discovery using human liver microsomes with LC-MS, rhCYP450 isozymes with fluorescence, and double cocktail with LC-MS. International Journal of Pharmaceutics, 335, 1-11. doi:10.1016/j.ijpharm.2006.10.039
- Cohen, L.H., et al. (2003) In vitro drug interactions of cytochrome p450: An evaluation of fluorogenic to conventional substrates. Drug Metabolism and Disposition, 31, 1005-1015. doi:10.1124/dmd.31.8.1005
- Di, L. and Kerns, E.H. (2003) Profiling drug-like properties in discovery research. Current Opinion in Chemical Biology, 7, 402-408. doi:10.1016/S1367-5931(03)00055-3
- Gibbs, M.A., et al. (1999) Inhibition of cytochrome P- 450 3A (CYP3A) in human intestinal and liver microsomes: Comparison of Ki values and impact of CYP3A5 expression. Drug Metabolism and Disposition, 27, 180- 187.
- Lipinski, C.A., et al. (2001) Experimental and computational approaches to estimate solubility and permeability in drug discovery and development settings. Advanced Drug Delivery Reviews, 46, 3-26. doi:10.1016/S0169-409X(00)00129-0
- Bergstrom, C.A., et al. (2002) Experimental and computa-tional screening models for prediction of aqueous drug solubility. Pharmaceutical Research, 19, 182-188. doi:10.1023/A:1014224900524
- Lipinski, C.A. (2000) Drug-like properties and the causes of poor solubility and poor permeability. Journal of Pharmacological and Toxicological Methods, 44, 235- 249. doi:10.1016/S1056-8719(00)00107-6
- Stresser, D.M., et al. (2000) Substrate-dependent modulation of CYP3A4 catalytic activity: Analysis of 27 test compounds with four fluorometric substrates. Drug Metabolism and Disposition, 28, 1440-1448.
- Wang, R.W., et al. (2000) Human cytochrome P-450 3A4: In vitro drug-drug interaction patterns are substrate-dependent. Drug Metabolism and Disposition, 28, 360-366.
- Korzekwa, K.R., et al. (1998) Evaluation of atypical cytochrome P450 kinetics with two-substrate models: Evidence that multiple substrates can simultaneously bind to cytochrome P450 active sites. Biochemistry, 37, 4137- 4147. doi:10.1021/bi9715627
- Kenworthy, K.E., et al. (1999) CYP3A4 drug interactions: Correlation of 10 in vitro probe substrates. British Journal of Clinical Pharmacology, 48, 716-727. doi:10.1046/j.1365-2125.1999.00073.x
- Galetin, A., et al. (2005) CYP3A4 substrate selection and substitution in the prediction of potential drug-drug interactions. Journal of Pharmacology and Experimental Therapeutics, 314, 180-190. doi:10.1124/jpet.104.082826
- Lin, J.H. (2000) Sense and nonsense in the prediction of drug-drug interactions. Current Drug Metabolism, 1, 305- 331. doi:10.2174/1389200003338947
- Walsky, R.L. and Obach, R.S. (2004) Validated assays for human cytochrome P450 activities. Drug Metabolism and Disposition, 32, 647-660. doi:10.1124/dmd.32.6.647
- Margolis, J.M. and Obach, R.S. (2003) Impact of nonspecific binding to microsomes and phospholipid on the inhibition of cytochrome P4502D6: implications for relating in vitro inhibition data to in vivo drug interactions. Drug Metabolism and Disposition, 31, 606-611. doi:10.1124/dmd.31.5.606
- Chauret, N., et al. (1999) Description of a 96-well plate assay to measure cytochrome P4503A inhibition in human liver microsomes using a selective fluorescent probe. Analytical Biochemistry, 276, 215-226. doi:10.1006/abio.1999.4348
- Pérez, J., Sánchez, M. and Peláez, F. (2004) Suitability of DMSO as a solvent for the compounds to be tested in cytochrome 3A4, 2C9 and 2D6 P450 isoforms inhibition assays. Annual Meeting of Society of Bimolecular Screening, Madrid.
- Di Marco, A., et al. (2005) Development and validation of a high-throughput radiometric CYP3A4/5 inhibition assay using tritiated testosterone. Drug Metabolism and Disposition, 33, 349-358. doi:10.1124/dmd.104.002873
- Fowler, S.M., et al. (2002) CYP3A4 active site volume modification by mutagenesis of leucine 211. Drug Metabolism and Disposition, 30, 452-456. doi:10.1124/dmd.30.4.452
- Kroemer, H.K., et al. (1993) Identification of P450 en-zymes involved in metabolism of verapamil in humans. Naunyn Schmiedebergs Archives of Pharmacology, 348, 332-337. doi:10.1007/BF00169164
- Busse, D., et al. (1995) Cytochromes of the P450 2C sub-family are the major enzymes involved in the O-demethylation of verapamil in humans. Naunyn Schmiedebergs Archives of Pharmacology, 353, 116-121. doi:10.1007/BF00168924
- Venkatakrishnan, K., von Moltke, L.L. and Greenblatt, D.J. (1999) CYP2C9 is a principal low-affinity phenacetin O-deethylase: Fluvoxamine is not a specific CYP1A2 inhibitor. Drug Metabolism and Disposition, 27, 1519- 1522.
- Tracy, T.S., et al. (1999) Cytochrome P450 isoforms in-volved in metabolism of the enantiomers of verapamil and norverapamil. British Journal of Clinical Pharmacology, 47, 545-552. doi:10.1046/j.1365-2125.1999.00923.x
- Wang, Y.H., Jones, D.R. and Hall, S.D. (2004) Prediction of cytochrome P450 3A inhibition by verapamil enantiomers and their metabolites. Drug Metabolism and Disposition, 32, 259-266. doi:10.1124/dmd.32.2.259
- Racha, J.K., et al. (2003) Substrate dependent inhibition profiles of fourteen drugs on CYP3A4 activity measured by a high throughput LCMS/MS method with four probe drugs, midazolam, testosterone, nifedipine and ter-fenadine. Drug Metabolism and Pharmacokinetics, 18, 128-138. doi:10.2133/dmpk.18.128
- Rodrigues, A.D. (1999) Integrated cytochrome P450 reaction phenotyping: Attempting to bridge the gap between cDNA-expressed cytochromes P450 and native human liver microsomes. Biochemical Pharmacology, 57, 465-480.