Advances in Bioscience and Biotechnology
Vol.1 No.1(2010), Article ID:1586,4 pages DOI:10.4236/abb.2010.11005
Biomass and productivity in sal and miscellaneous forests of Satpura plateau (Madhya Pradesh) India
![]()
1Wood Anatomy Discipline, Botany Division, Forest Research Institute, Dehradun, India;
2Conservator of Forest, Bokaro (Jharkhand), India.
Email: Pandep123@rediffmail.com
Received 18 January 2010; revised 25 January 2010; accepted 28 January 2010.
Keywords: Biomass; Net Ecosystem Productivity; Net Primary Productivity; Litter Production
ABSTRACT
The paper deals with the biomass and productivity of sal (SF) and miscellaneous forests (MF) of Satpura plateau (Madhya Pradesh) India. These forest types were divided into four sites namely open miscellaneous (OMF, site-I), closed miscellaneous (CMF, site-II), open sal (OSF, site-III) and closed sal (CSF, site-IV). The degree of disturbance followed the order: III (0.70) < I (0.12) < II (0.054) < IV (0.018) while considering total trees as measure. OSF (III) and CSF (IV) were most and least disturbed sites among the four. The percent allocation of above ground tree biomass followed the order: 85.08 (II) < 85.51 (I) < 81.31 (III) < 78.09 (IV). The higher above ground tree biomass was produced by MF than of SF. Closed canopy forests produced higher above ground tree biomass than of the open forests. OMF produced 9.5% less biomass than of the CMF whereas, OSF has 39.91% less biomass than of the CSF. The contribution of above ground biomass of shrubs (%) are as follows: 8.3 (IV)< 32.72 (I) <33.77 (III) <52.63 (II). The percent contribution of root biomass was higher for closed sites as compared with open and sites. The root: shoot ratio was ranged between 0.169-0.249. NPPtree (kg ha-1yr-1) was highest for site –IV (38094.79), followed by III (33384.29), II (12374.89 and I (9736.52). NPPshrub followed the order: 204 (IV) > 109 (III) wang##Bracket# 79.80 (I) > 52.69 (II), while for NPPherb, the order of importance was, 109.50 (IV) > 73.27 (I) > (II), 71.75 (III) > 55.71 (II). NPPtotal was highest for closed forest stands than of the open ones. NPPteak was lower for high-disturbed site than of the less disturbed site. Photosynthetic/ non - photosynthetic ratio follows the order: 0.067 (II) > 0.030 (III) > 0.026 (IV) > 0.018 (I). Open forests showed lower values for this ratio. NEP was higher for SF than of the MF. Further closed forests showed higher values of NEP. OSF showed lower values of NEPsal than of the CSF. Disturbances in open forests not only reduced stand biomass of tree species, dominant species in particular, but also declined the tree productivity. So, gap filling plantation in side the forest is suggested to improve the productivity of open forests.
1. INTRODUCTION
Satpura plateau is a wide table land stretching from Maikal range in the east to Nimar in the west. It covers Chhindwara, Betul, Seoni, Hosngabad and Balaghat district of Madhya Pradesh (India). The total geographical area of these districts is 49882 km2. Total dense and open canopy forests were 14291 km2 (28.65% of the total area) and 5128 km2 (10.29% of the total area) respectively. The loss in forest area was 83 km2 as compared to 1997 assessment [1]. The villages of the Satpura are mainly inhabited by tribals. The tribals are mostly Jharias and Gond. They mostly depend on these forest for their livelihood. This creates the pressure on these forests. As a result, closed canopy forests are converting into open canopy forests, and open canopy forests into shrub-lands, savanna and finally to barren lands.
Most of the studies have been carried out on biomass estimation and productivity in different types of forest ecosystems [2-8]. The information on the tropical dry disturbed forests is sparse. In view of the above, the paper deals with: 1) the allocation of biomass in different life forms and their components at different sites and 2) comparison of the standing biomass and productivity of the selected sites. An attempt has also been made to compare the biomass and current productivity of the study sites with other forests of India.
2. MATERIAL AND METHODS
2.1. Study area
The study area is located in Chhindwara district of Madhya Pradesh (India). The forest area comes under Delakhari and Tamia Range of Chhindwara West Forest
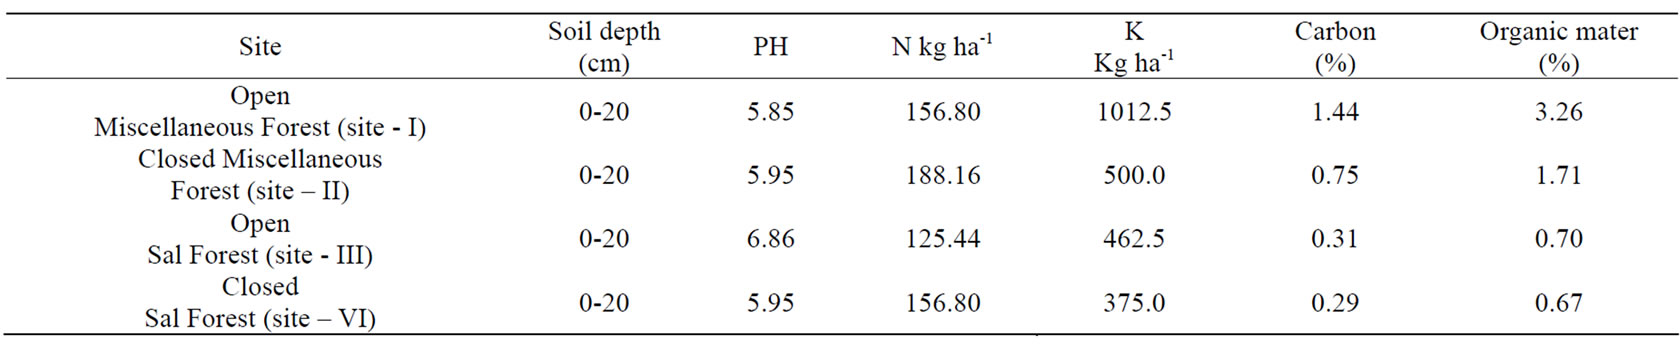
Table 1. Physico-chemical properties of soil at different sites.
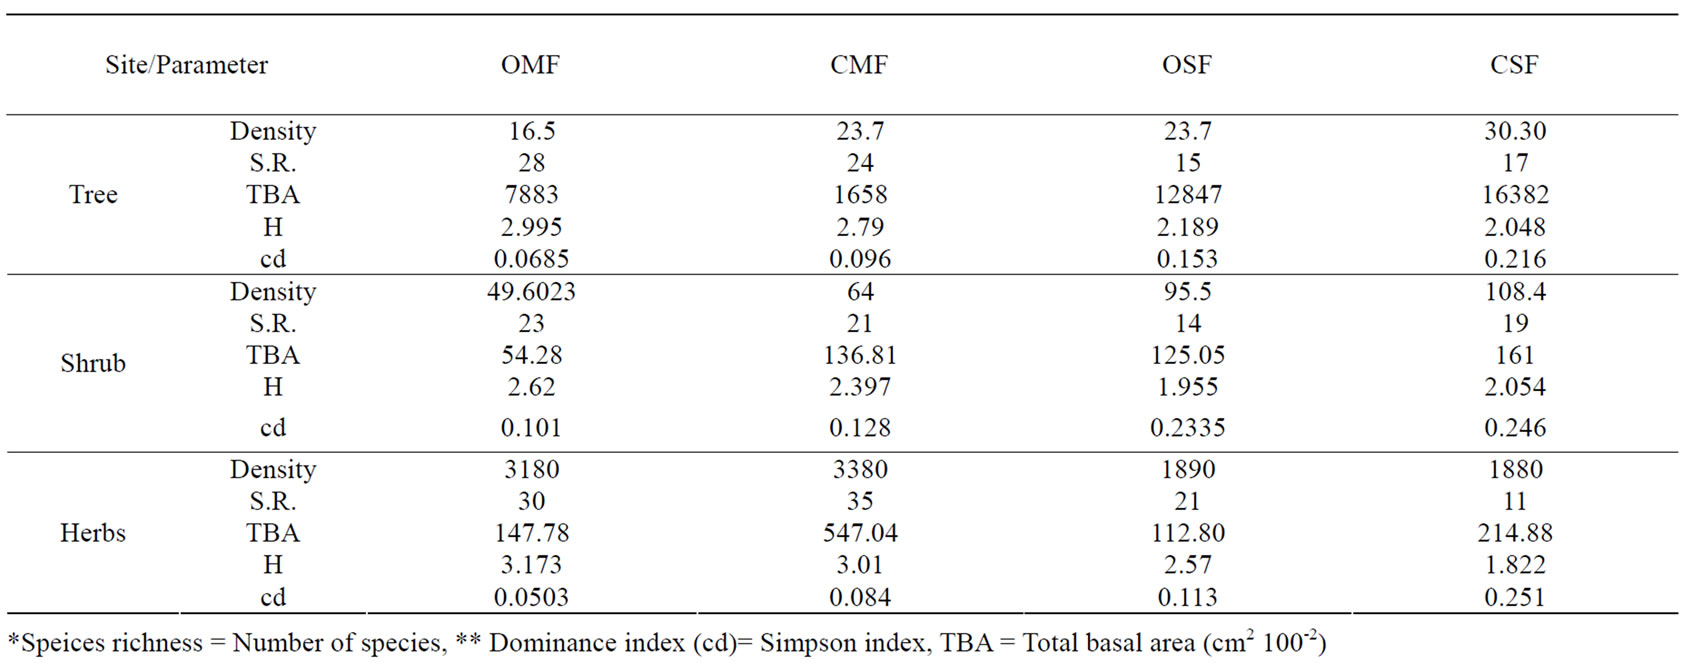
Table 2. Density (Plant 100m-2), species richness (SR)*, Shannon – Wiener diversity index (H) and dominance index (cd)**.
Division. The area lies between 78°.17’ to 79° 10’ E longitude and 20°.52¹ to 20°-43’N latitude. The attitude ranges from 387 to 1242 m asl. The study pertains to southern tropical dry peninsular Sal (Shorea robusta Gaertn.) forest (5B/C-1c) and southern tropical dry deciduous mixed forest (51/ c-3) [9]. Sal (Shorea robusta Gaertn.) was dominating in moist Sal type while teak (Tectona grandis Linn.) was in dry mixed forest. These forest types were divided into four sites as open and closed forests on the basis of records of Forest Department and further confirmed by tree density and other parameters of vegetation (Table 1). These sites were open miscellaneous (OMF, site-I), closed miscellaneous (CMF, site-II), open sal (OSF, site-III) and closed sal (CSF, site-IV) of tropical dry deciduous mixed (MF) and tropical dry sal forests (SF).
The degree of past disturbances was estimated by calculating coefficient of determiners (R2) between density and diameter relationship [10]. The magnitude of coefficient indicates the degree to which a stand approximates a balanced structure. The values of ‘R2 ’ closer to ‘one’ means the system is more balanced. The lower values of ‘R2’ for these stands are due to unbalanced distribution of many species as a result of disturbances [10]. Examination of R2 values, the degree of disturbance followed the order: OSF (0.70) < OMF (0.12) < CMF (0.054) < CSF (0.018) while considering total trees as measure. OSF and CSF were most and least disturbed sites far as past disturbances are concerned. While considering main species as measure, the degree of disturbances followed the order: OMF (0.85) < CMF (0.63) < CSF (0.38) < OSF (0.24).
The geology of the ares is extremely complex. Principal geological formations are oldest Archeans, upper and lower Gondwans, Lametas and Deccan trap with patches of recent Alluvium, Talchirs, Barakar, Mootur and Bijories. The soil type was sandy loam to black cotton. Other characteristics of the site are given in Table 2.
2.2. Climate
Climate of the area is monsoonal with seasonal rainfall. Average annual rainfall in recent years has been 1100 mm. Approximately 90% of annual precipitation occurs during the wet period (June to September) and distributed over about 120 rainy days. Relative humidity is 22% to 89%. Mean minimum to maximum temperature ranges from 15°C to 40°C. January and May are the coldest and hottest months respectively.
2.3. Biomass Studies
Biomass studies were conducted during 2004 using Harvest method of stratified tree technique, following Peterken and Newbould [11]. In the study, ‘multiple random quadrat method’ was used. The advantages of multiple random quadrat method over single plot method are; firstly, it samples optimum area and secondly, it avoid homogeneity of the samples. Twenty quadrats (size, 10 × 10 m for trees, 3 × 3 m for shrubs and 1 × 1 m for herbs) were laid randomly along the transect on each site to sample the maximum representative area. The size of quadrat was determined by plotting species area curve and number of quadrats was determined by plotting increasing number of quadrats against the number of species [12]. The girth (gbh) and height of each tree was measured, individually. In order to have better distribution of sample trees over the population, the whole number of trees was divided into different girth classes. Sample trees for each girth class were selected as being nearest to the average of each class [13]. These sample trees were felled and roots were excavated for underground biomass. The whole tree biomass was recorded for different components viz. leaves, twigs, branches, bole and roots and presented on oven dry weight basis. The tree biomass was calculated as total biomass of standing crop minus leaf biomass plus litter stock. Shrub biomass was estimated using mean tree technique [13]. The mean girth was also calculated for estimating shrub biomass for each species. One plant of near to mean girth of each species was selected for felling. In all, 10 plants of different shrub species were felled and roots were excavated. The ‘harvest method’ was also used for estimating herb biomass. Five quadrats (1 m × 1 m) were laid randomly at each site for estimating herb biomass. Biomass was harvested and separated into different species as far as possible. Unidentified material is grouped as ‘miscellaneous’. The herb biomass was divided into shoot and root and weighed and presented on oven dry weight basis. The biomass of all herbs pooled to get total herb biomass.
The calculated biomass of each sample tree leaving leaf biomass of each girth class was divided by age. Age was determined by volume tables and further confirmed by counting growth rings. The growth rings were counted manually after the smoothing the cross surfaces mechanically and applying glycerin on the smooth surface of the basal disc of each sample [14]. The density of that diameter class was multiplied by this value. This exercise was done for each species. Finally, all the values were summed and value of litter production was added to get ‘net primary productivity’ (NPP). NEP (Net Ecosystem Productivity) was calculated as bole production of trees [15]. NPPtree is derived from bole, bark, twigs, roots and litter production, while NEP is bole production of trees.
2.4. Litter Studies
Three permanent quadrats of 5 × 5 m size were randomly placed in each site. All the quadrat were initially cleared and swept of any deposited debris. A total of 9 × 12 samples in each site were considered for the estimation of annual litter production. Collecting the litter from these quadrates made monthly estimation of litter fall and then sorting it into leaves and twigs. The miscellaneous litter, which consists of leaf litter of other than of the main species and other unidentified organic matter, was included in leaf litter. Triplicate samples of leaf and twig litter fractions were collected and brought to the laboratory for determining oven dry weight (80°C) from each quadrat. All results are expressed on oven dry weight basis.
3. RESULTS AND DISCUSSION
All the results of biomass and productivity are set in Tables 3-9.
3.1. Allocation of Biomass in above Ground and below Ground Components
In general higher value of biomass was observed in bole followed by root, bark, twig and leaves irrespective of species and sites. Further, higher girth classes showed higher biomass in all the sites. It is the reflection of both the age and stature.
The percent allocation of above ground tree biomass followed the order: 85.08 (II) < 85.51 (I) < 81.31 (III) < 78.09 (IV). The higher above ground tree biomass was produced by MF than of SF. Further, closed canopy forests produced higher above ground tree biomass than of the open forests. The contribution of above ground biomass of shrubs (%) were as follows: 8.3 (IV) < 32.72 (I) < 33.77 (III) < 52.63 (II). The MF showed higher biomass than of the SF. It simply reflects the more number of tree species and density of the stand (Table 3).
The percent contribution of root biomass was higher for closed sites as compared with open and disturbed sites. Moreover, this was also more for dominant tree species like sal and teak in their respective stands as indicated by below ground and above ground biomass ratio. It indicated that teak and sal allocated more resources to root system at the early stages of tree growth to optimize the nutrient uptake.
The root: shoot biomass ratio was ranged between 0.169-0.249. The mean root: shoot biomass ratio was reported as 0.24±0.14 for tropical forests [16]. The values of root: shoot ratio for present are well within the reported range for tropical forests [16]. Further this ratio was higher for closed and undisturbed sites.
The allocation of biomass in different components in tropical and subtropical forest is given in Table 4. The total above ground biomass ranged between 27.5-205.50 t ha-1. The range for the below ground biomass is in between 7.6-34.3 t ha-1. Total biomass ranged between 37.12-239.80 t ha-1. The ranges for the present study for above ground, below ground and total biomass (t ha-1) were 154.9-345.6; 35.60-62.16 and 190.53-406.27 respectively. The results on biomass of present study are on the higher side than the reported range for tropical/subtropical forests published elsewhere in literature
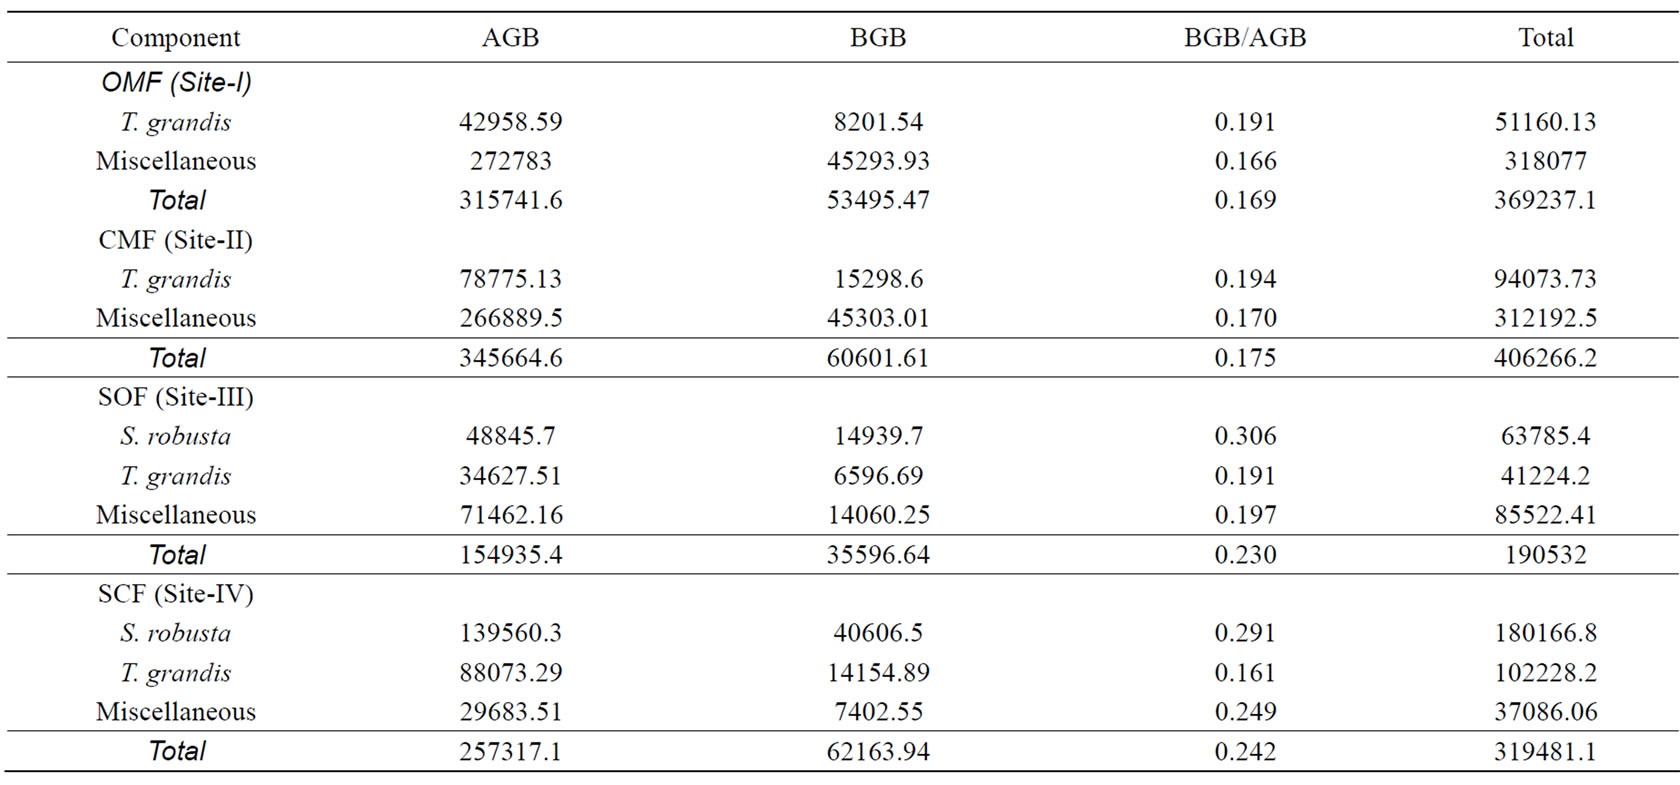
Table 3. Above ground biomass (AGB) and below ground biomass (BGB) at different sites (kg ha-1).
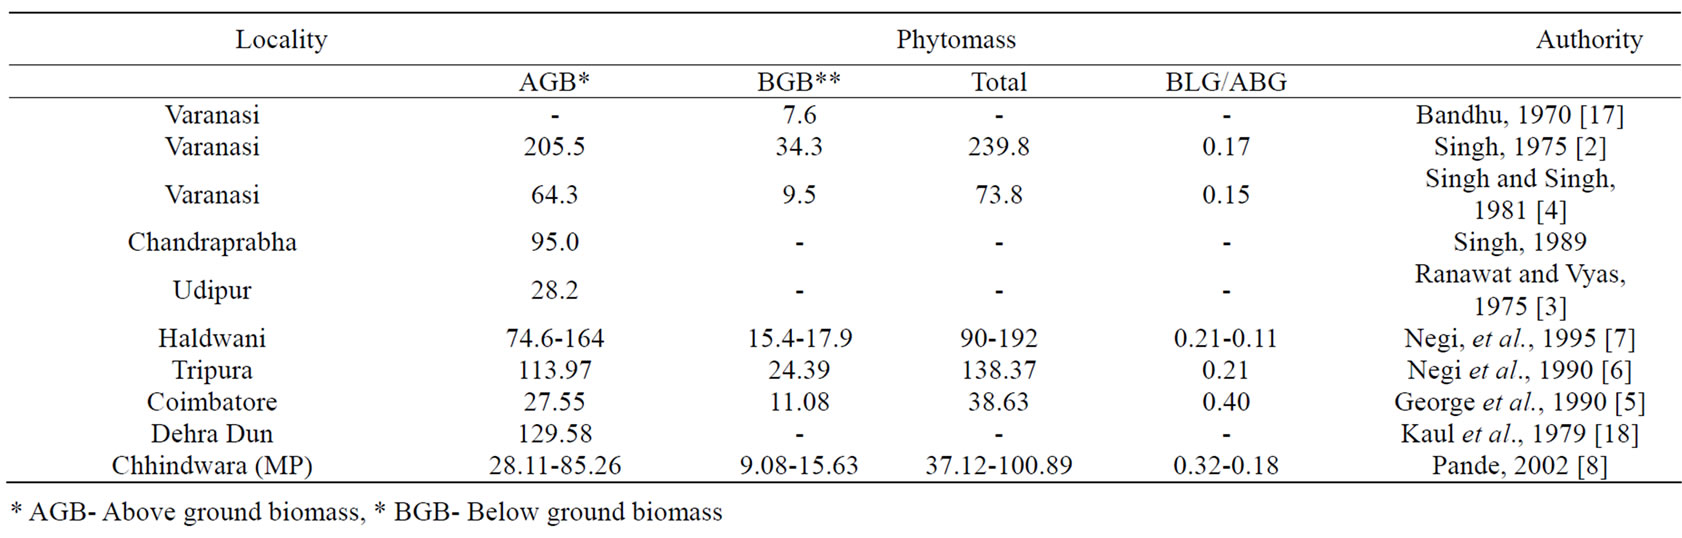
Table 4. Dry Phytomass (tha-1) of tropical dry forests.
(Table 4). It may be accounted for the higher tree density of the preset study sites.
Table 5 shows allocation of biomass (kg ha-1) in different tree species at different sites. Tectona grandis (51160.13) and miscellaneous species (318076.59) like Butea monosperma, Lagerstroemia parviflora, Anogeissus latifolia, Lannea grandis were the major contributors towards total tree biomass (kg ha-1) at site-I, whereas T. grandis (94073.7) and miscellaneous tree species like Butea monosperma, Diospyros melanoxylon, Buchanania lanzen, Butea monosperma and others have contributed 312192.46 towards total biomass at siteII. In site-III, Shorea robusta (63785.4) Tectona grandis (41224.2), and species like Buchanania lanzen, Terminalia tomentosa and others forms of the miscellaneous contributed major part (85522.41 kg ha-1) towards the total tree biomass. The site-IV, Shorea robusta (180166.84), Tectona grandis (102228.18) and other species like Buchanania lanzen, Madhuca latifolia, Diospyros melanoxylon, Lagerstroemia parviflora, Emblica officinalis, etc. forms miscellaneous and contributed (37086.06) towards total biomass. Invariably, higher age groups accounted for higher biomass for their higher total basal area.
The higher biomass values were obtained for closed forests than of the open forests. It is the reflection of higher tree density and total basal area of those stands which realized higher biomass at those sites. More herb and shrub biomass produced by OMF than CMF and is indicative of the space/resource created by disturbances are efficiently utilized by herbs and shrubs due to their relative smaller niche-size. The higher shrub biomass in CSF than of the OSF may be due to the higher regeneration potential of different tree species at that site.
Table 6 shows biomass stocks (kg ha-1) at different sites. MF showed higher biomass than of the SF. It may be due to more tree density, species richness and mean basal area. OMF produced 9.5% less biomass than of the CMF whereas, OSF have 39.91% less biomass than of the
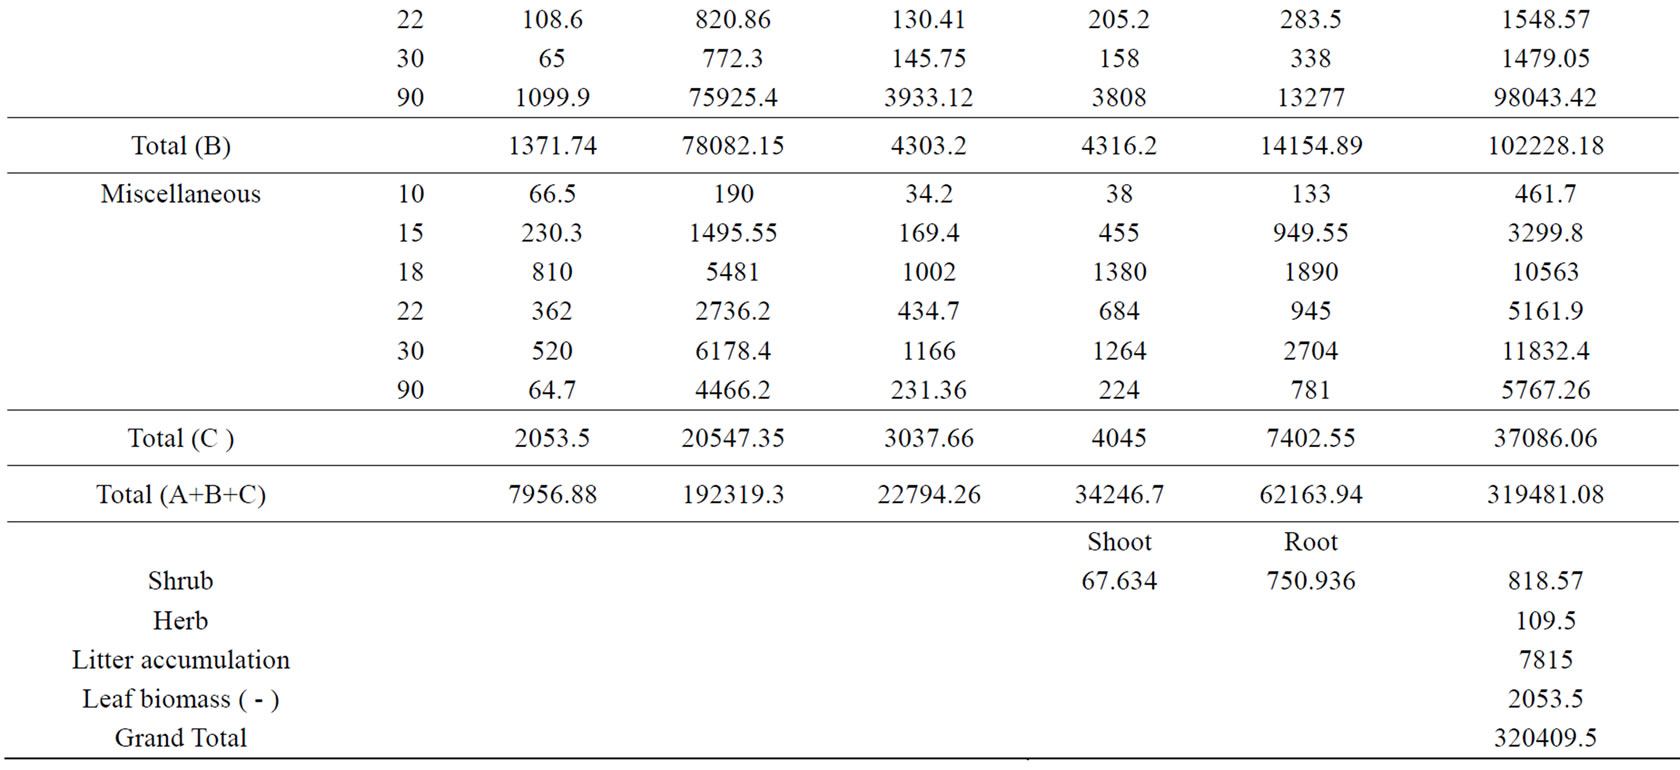
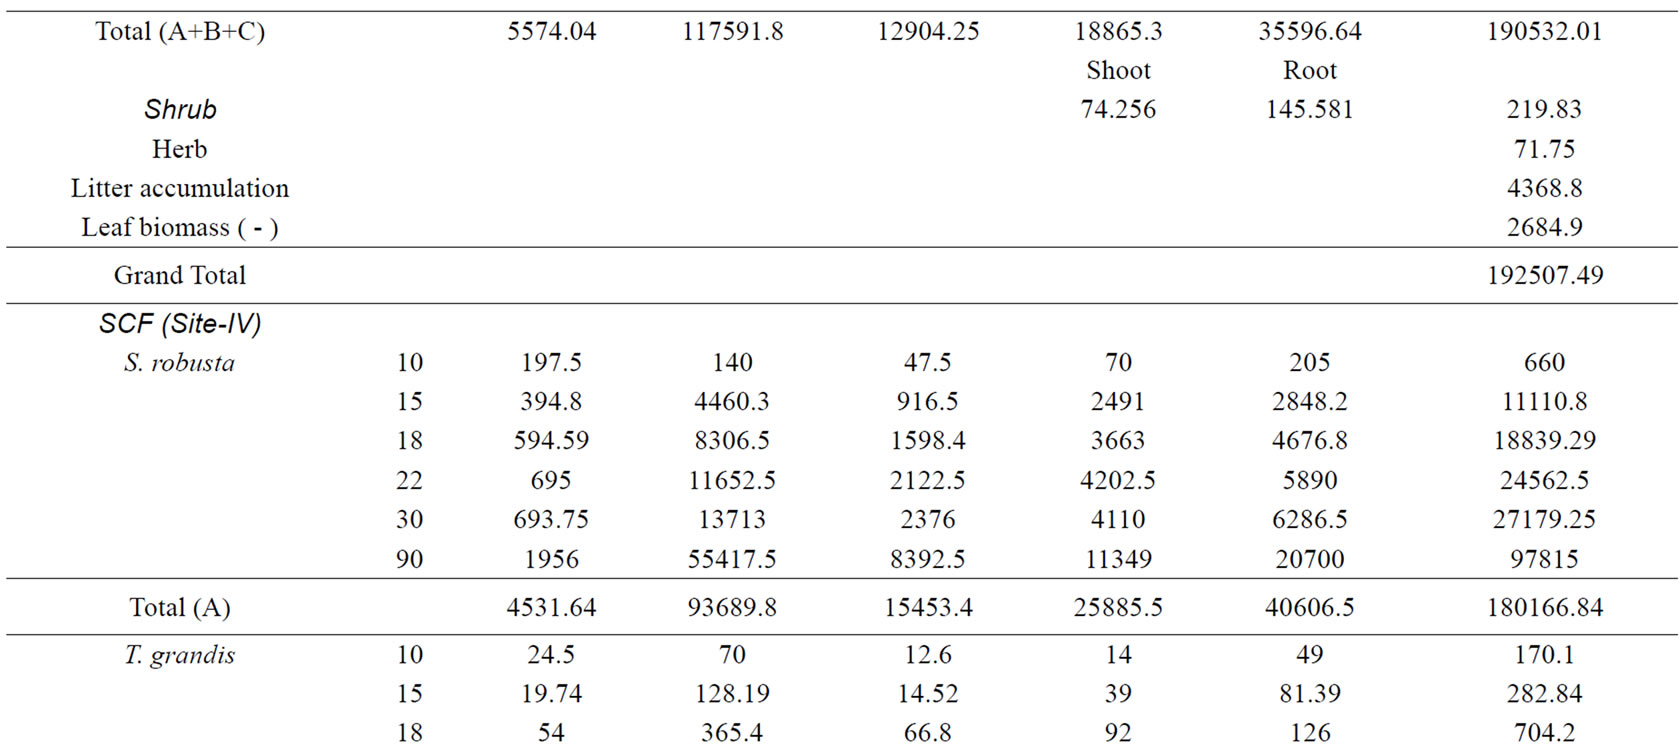
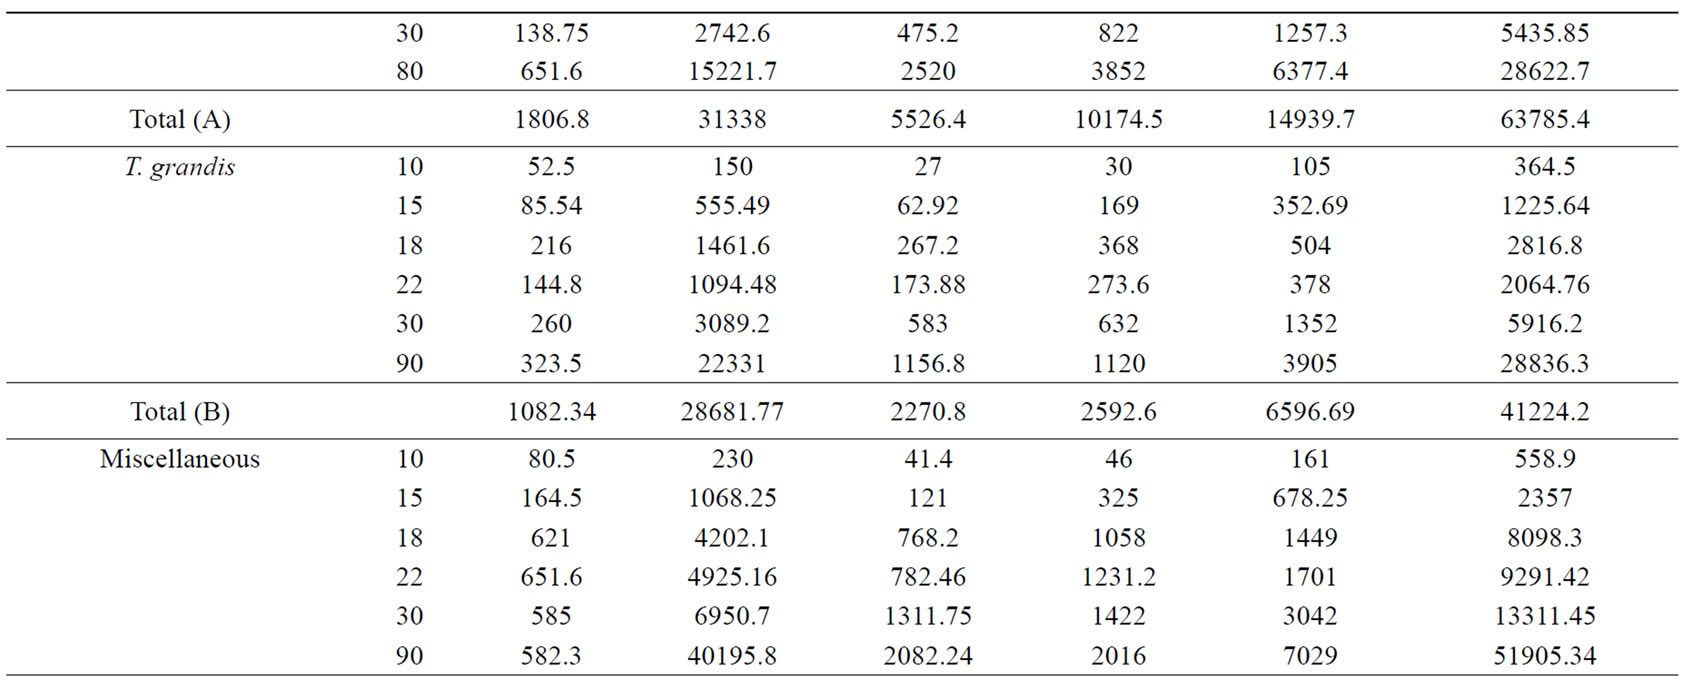
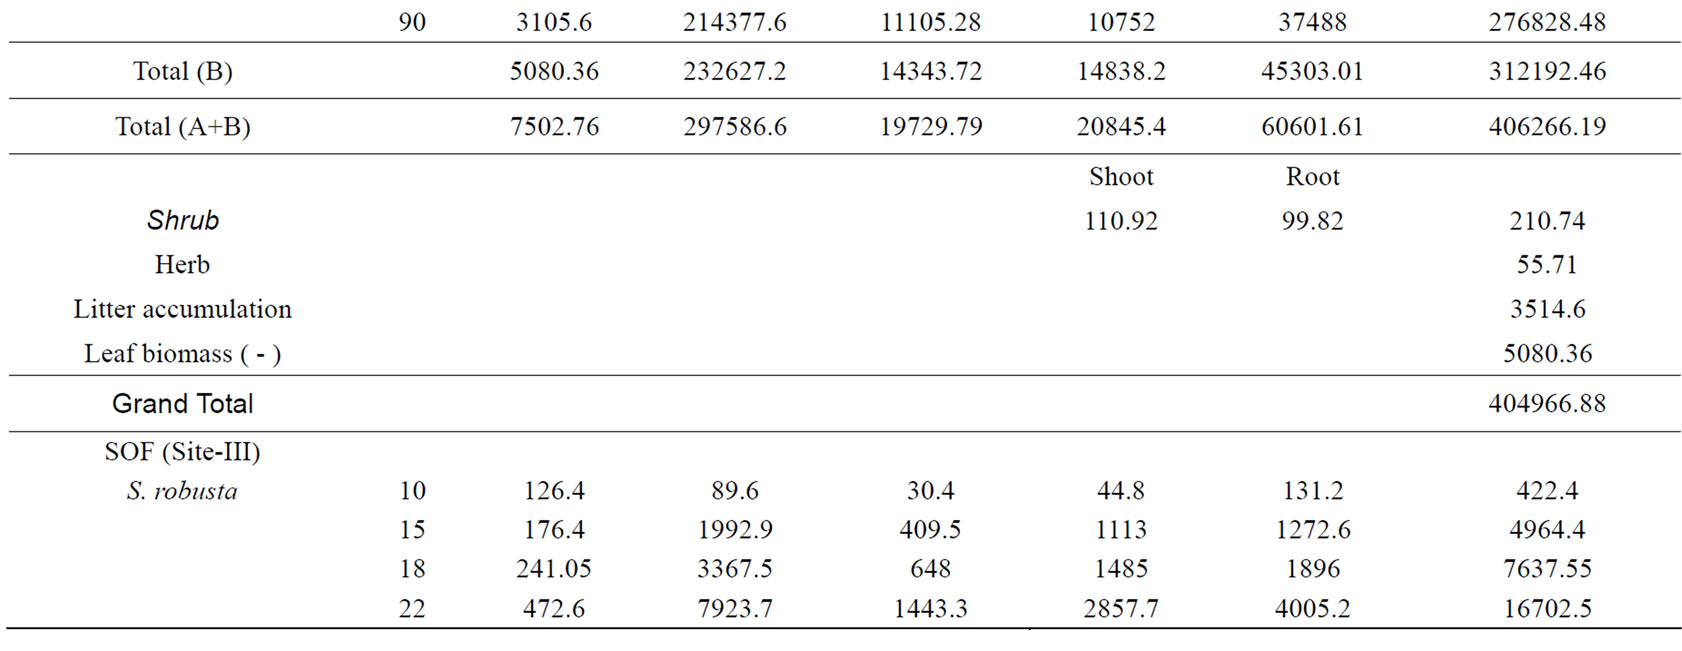
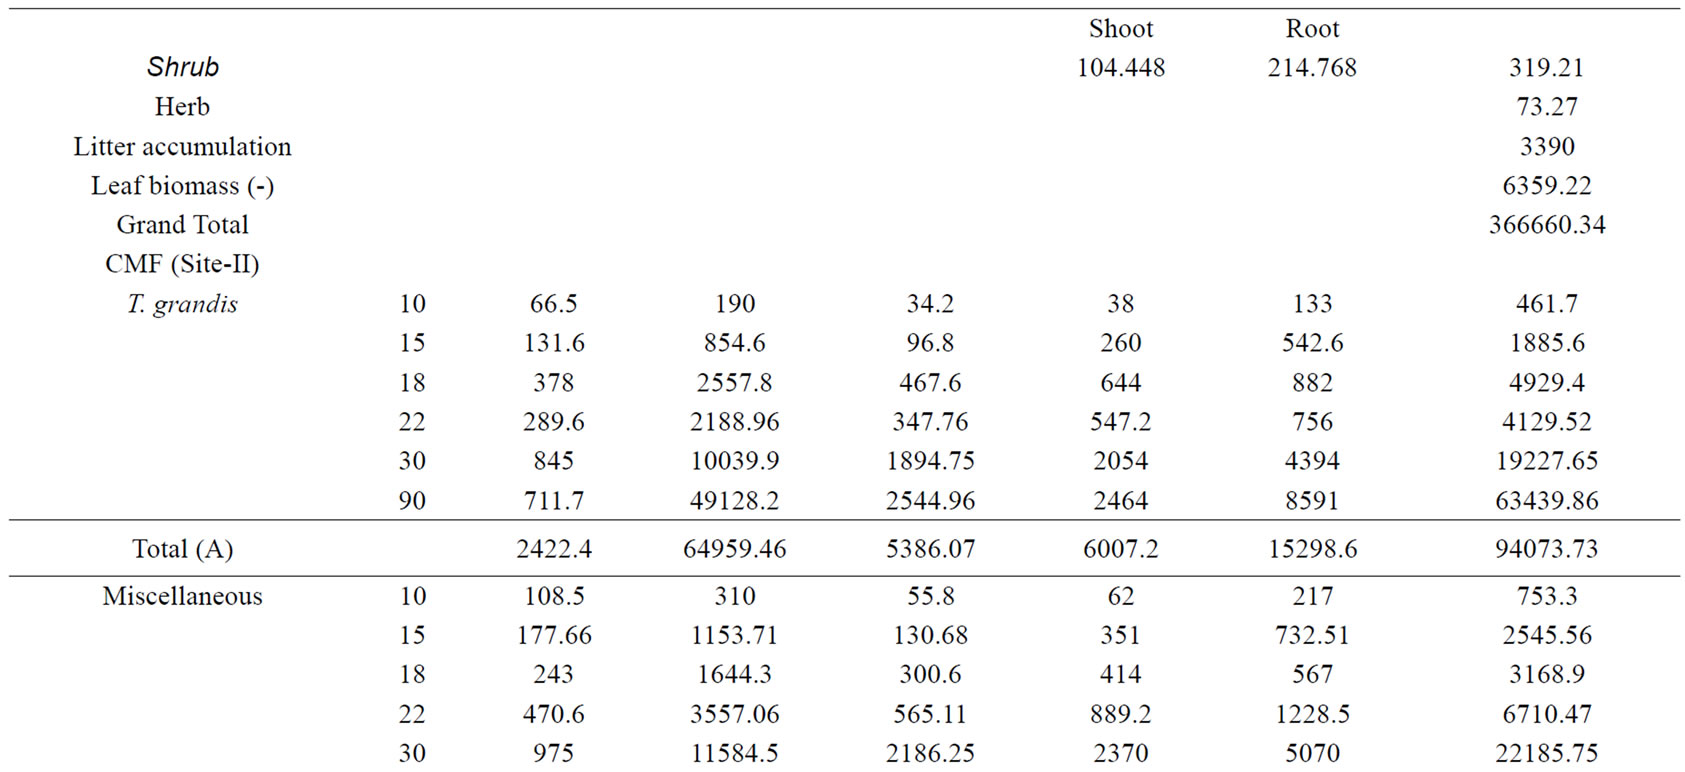
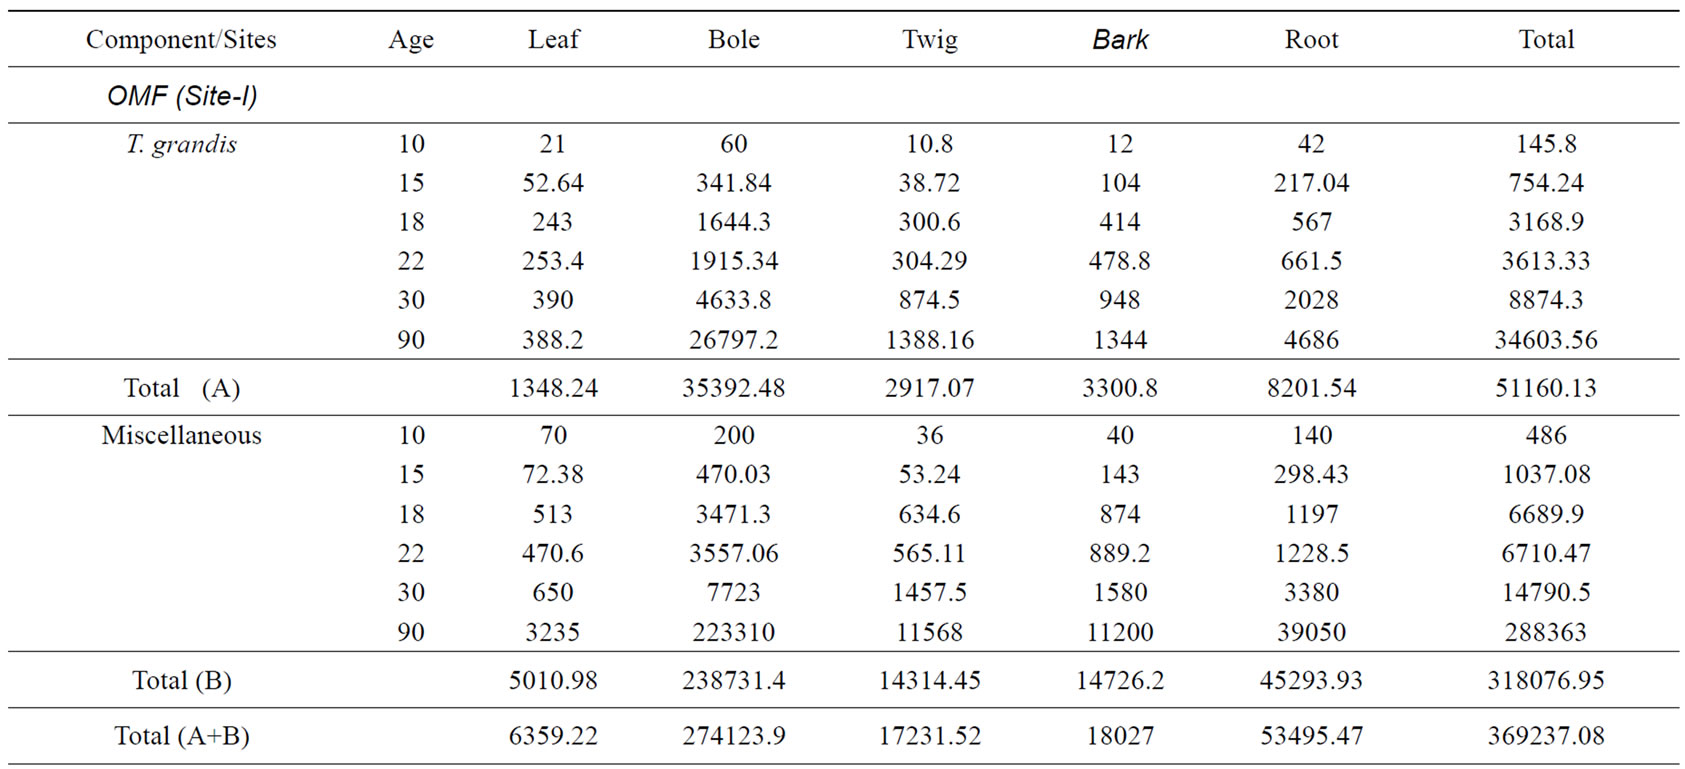
Table 5. Biomass (kg ha-1) in different components at different sites.
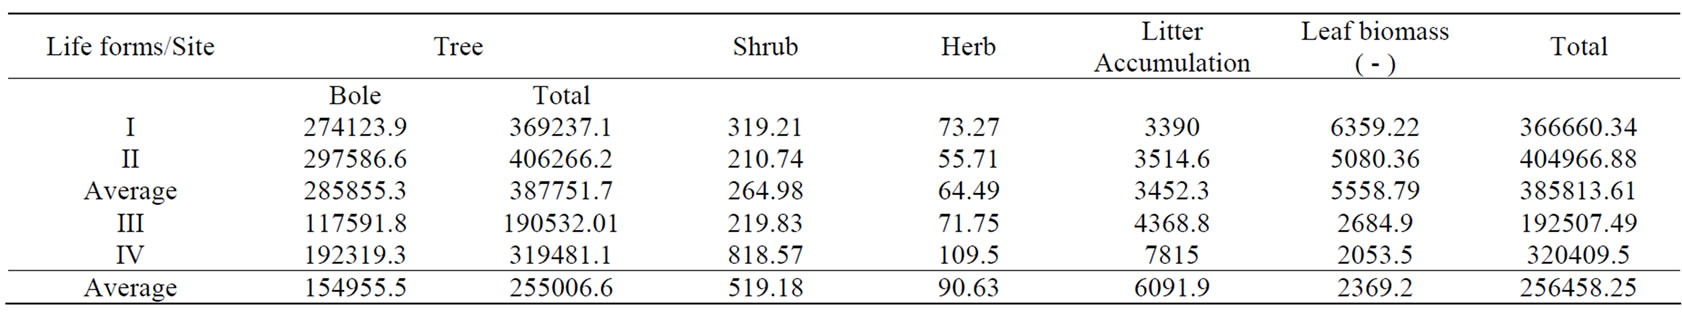
Table 6. Biomass stocks (kg ha-1) at different sites.
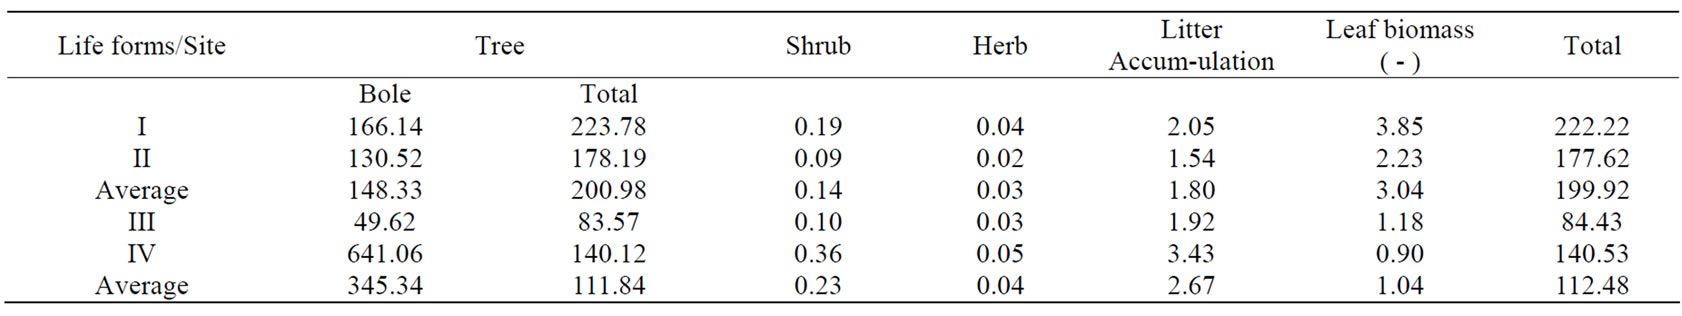
Table 7. Biomass stocks (kg ha-1) at per tree basis at different sites
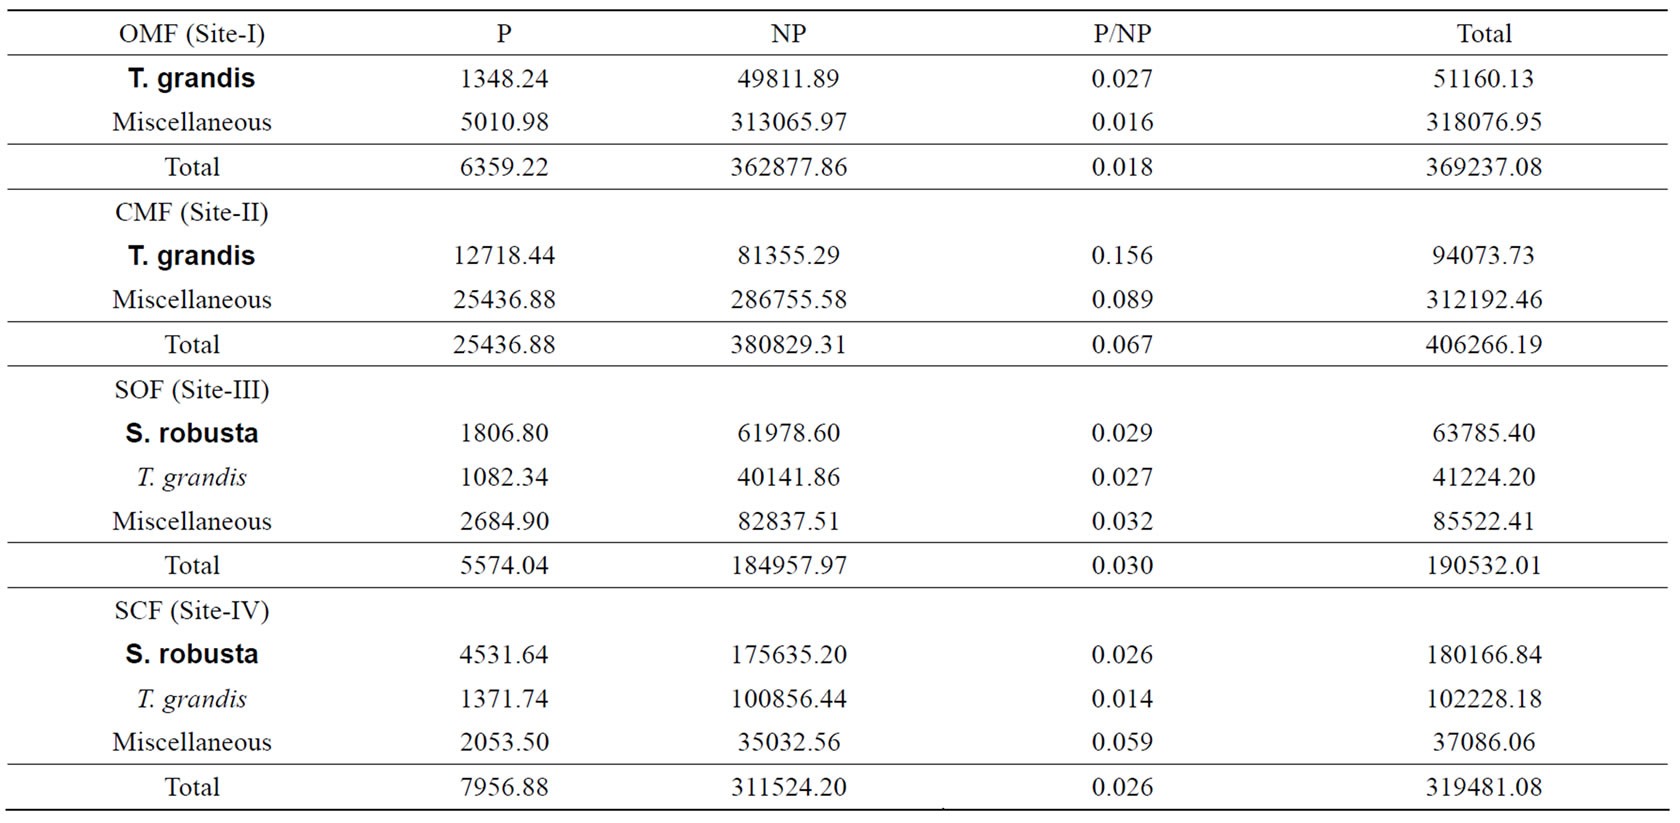
Table 8. Photosynthetic (P) and non-photosynthetic (NP) biomass ( kg ha-1).
CSF. OMF produced 9.1% less bole biomass than of the CMF while OSF produced 40.36% les biomass than of the CSF.
Biomass stocks on tree-1 basis (kg ha-1) and plant-1 are given in Table 7. The average values for total tree-1/ plant-1 and total biomass in all life forms was more in case of MF than of the SF. But the situation was reverse in case of bole biomass. While comparing the open and closed forests, it was higher for closed forests in both the cases.
3.2. Photosynthetic and Non-Photosynthetic Biomass
Allocation of biomass in photosynthetic and non-photosynthetic components at different sites is tabulated in Table 8. Photosynthetic/non-photosynthetic ratio follows the order: 0.067 (II) > 0.030 (III) > 0.026 (IV) > 0.018 (I). Open forests showed lower values for this ratio. It may be explained as; firstly, the photosynthetic demand is higher at early developmental stages of stand growth thus form higher foliage in closed forests and, secondly, the less disturbances protect the foliage from the lopping and grazing at closed forest sites.
3.3. Biomass: Total vs. Main Species
The contribution of biomass of Tectona grandis (teak) and Shorea robusta towards total biomass is given in
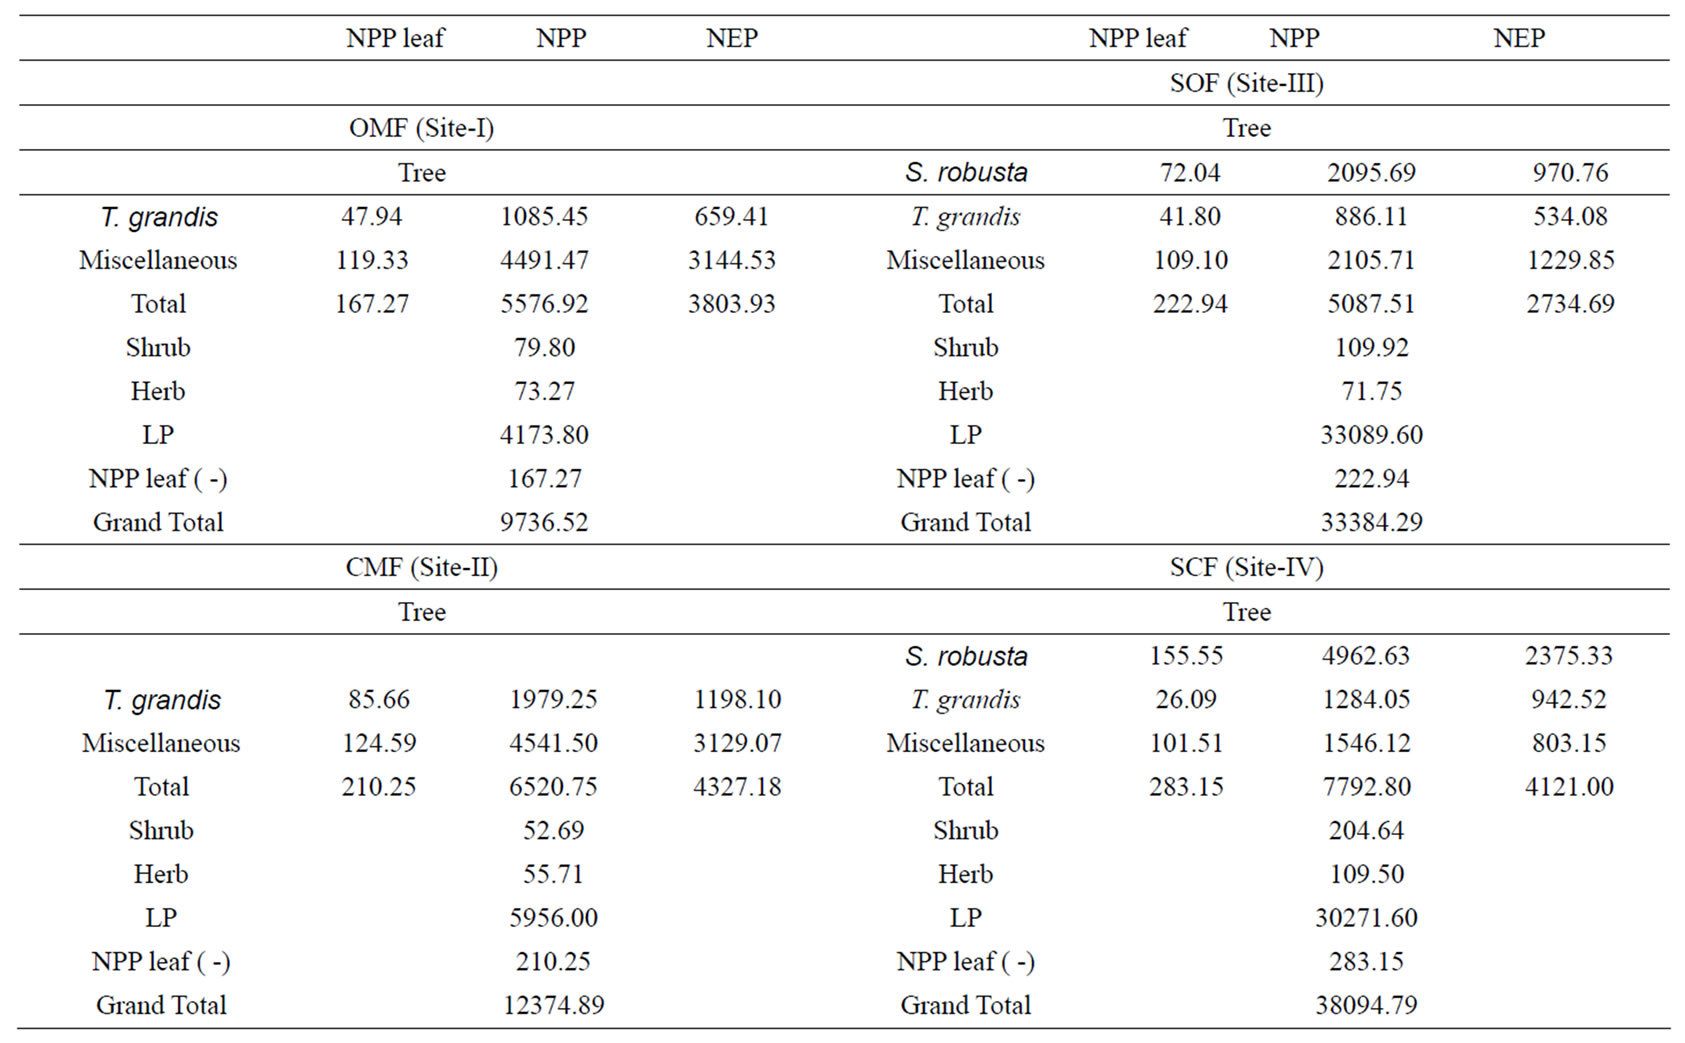
Table 9. NPP and NEP (kg ha-1 yr-1) at different sites.
Table 3. The highest percent contribution of teak towards total biomass is shown by site-IV (31.19) and followed by-II (23.15), -III (21.16), and -I (13.85). It clearly indicated negative impact of disturbance on dominant tree species (teak) at open forest sites. The highly disturbed site-I contributed only 13.85% biomass towards total, whereas site-III - the least disturbed, contributed 23.85% towards total biomass. The contribution of biomass of sal at open and closed forests was 33.47% and 56.37% respectively. The lower contribution of main species at open forest may be due to higher contribution of miscellaneous tree biomass. The open forest sites of the present study (I) and (III)undergone various anthropogenic disturbances like lopping, felling, grazing, etc. during the remote and recent past. It created large gaps inside the forest. These gaps provided space/resource for invading species. Thus, create opportunity to acclimatize and establish them in the prevailing climate. These species became second and even first canopy species at present and their contribution in total biomass is 86% and 44.88% respectively for OMF and OSF.
3.4. Net Primary Productivity
A perusal of Table 9 shows that NPPtree (kgha-1yr-1) is highest for site -IV followed by (38094.79), III (33384.29), II (12374.89 and I (9736.52). NPPshrub followed the order: 204 (IV) > 109 (III) > 79.80 (I) > 52.69 (II), while for NPPherb, the order of importance was, 109.50 (IV) > 73.27 (I)> (II), 71.75 (III) > 55.71 (II). NPPtotal was highest for closed forest stands than of the open ones. NPPteak was lower for high-disturbed site than of the less disturbed site. It indicated that disturbances decreased productivity of teak in the both miscellaneous and sal forests of Satpura forests. This is also true for NPPshrub. In contrary, NPPherb is almost accounting more or similar values for the sites.
Net primary productivity (kg ha-1 yr-1) of Tectona grandis is highest for site-II and followed by IV, I, III. NPP teak was higher for closed forest sites. George et al. [5] reported NPP in some southern tropical forests of Coimbatore as 2476 kg ha-1 yr-1. Karmacharya and Singh [19] reported NPP between 12933-25588 kg ha-1 yr-1 in some tropical teak plantations. Negi et al. [7] reported NPP in between 6421-11289 kg ha-1 yr-1 in some tropical teak plantations of Haldwani (UP). The values of NPPtree in present study are well with in the reported range for tropical forests. However, the values are higher than of George et al. [5] and Kaul et al. [18]. This is the reflection of good regeneration and - fertility of the forests. This view is also supported by George et al. [5]. The same is also true for NPP on per tree basis.
3.5. Net Ecosystem Productivity
NEP is calculated from bole biomass. NEP was higher for sal forests than of the miscellaneous forests. Further closed forests showed higher values of NEP. Net ecosystem productivity for Tectona grandis was also higher for sal ecotone forest. Open sal forest showed lower values of NEPsal than of the closed sal forest (Table 9).
3.6. Comparison with Other Forests
Murphy and Lugo [20] reported that stem wood biomass production ranged between 4 – 18 t ha-1 yr-1 in tropical dry regions compared with 10-30 t ha-1 yr-1 in tropical moist and wet region. The bole production (0.85-1.354 t ha-1 yr-1) in teak forests at Chhindwara towards the lower end of the dry tropical forests This is due to lower soil depth and nutrient poor soil of the investigation sites [8]. The bole production in the present study was in the range of 2.734-4.327 t ha-1. It is well with in reported range of tropical dry deciduous forests.
3.7. Management
It is clear from the preceding discussion that disturbances in open forests not only reduce stand biomass of tree species (dominant species in particular) but also decline the tree productivity. In another study, Pande (2002) reported that the NPPteak was 63% higher in the plantation inside the forest, than of the actual site. It clearly indicated that productivity of open forest sites increased substantially, for target species by gap filling plantation. Therefore, it is suggested to forest managers to fill the blanks in side the forest by target species so that tree productivity would be maintained. This will also helpful to maintain the tree composition of the forest.
REFERENCES
- F.S.I. (2000) State of Forest Report (1999) Forest Survey of India (Ministry of Environment & Forest, India), Dehradun, p. 113.
- Singh, R.P. (1975) Biomass, nutrient and productivity structure of a stand of dry deciduous forest of Varanasi. Tropical Ecology, 22, 97-105.
- Ranawat, M.P.S. and Vyas, L.N. (1975) Litter production in deciduous forests of Koriyat, Udaipur (South Rajesthan) India. Biologia, 30, 41-47.
- Singh, K.P. and Singh, R.P. (1981) Seasonal variation in biomass, nutrient and productivity structure of a stand of dry deciduous forest of Varanasi. Tropical Ecology, 16, 104-109.
- George, M., Varghees, G. and Manivachakam, P. (1990) Nutrient cycling in Indian tropical dry deciduous forest ecosystem. Proceeding of the Seminar on Forest Productivity Held at F.R.I. Dehradun, 23-24 April 1990, pp. 289-297.
- Negi, J.D.S., Bahuguna, V.K. and Sharma, D.C. (1990) Biomass production and distribution of nutrients in 20
- years old teak (Tectona grandis) and gamar (Gmelina arborea) plantation in Tripper. Indian Forester, 116, 681-686.
- Negi, M.S., Tandon, V.N. and Rawat, H.S. (1995) Biomass and nutrient distribution in young teak (Tectona grandis Linn f) plantations in Tarai region of Uttar Pradesh. Indian Forester, 121, 455-464.
- Pande, P.K. (2002) Structure and function of tropical dry deciduous teak forest as per their disturbance magnitude with emphasis on regeneration and management. Final Technical Report (CFRHRD/2; TFRI/18), ICFRE, Dehradun, India, 65.
- Champion, H.G. and Seth, S.K. (1968) A revised survey of forest types of india. Government, India Printers, New Delhi.
- Robertson, P.A., Weaver, G.T and Cavanaugh (1978) Vegetation and tree species patterns near the northern terminus of the southern flood plain forests. Ecological Monograph, 48, 249-269.
- Peterken C.F. and Newbould, P.S. (1966) Dry matter production Xlex aquifolium in New Forest. Journal of Ecology, 54, 143-150.
- Misra, R. (1968) Ecology work book. Oxford and IBP Publishing Co., Calcutta.
- Ovington, J.D., Forest, W.G. and Armstrong, J.S. (1967) Tree biomass estimation. Symposium primary productivity & mineral cycling in natural ecosystems. AAAS Ecological Society of America, 4-31.
- Ramesh Rao, K. (1966) Studies of density and fibre characteristics of Indian timbers. PL 480 Project, Final Technical Report Forest Research Institute, Dehradun.
- Turner, D.P., Koerper, G., Horman, M.E. and Lee, J.J. (1995) A carbon budget for the conterminous United States. Ecological Applications, 5, 421-436.
- Cairns, C.A., Brown, S., Heeler, E.H. and Baumgardner, G. A. (1997) Root biomass allocation in the world’s upland forests. Oecologia, 111, 1-11.
- Bandhu, D. (1970) A study of productive structure of northern tropical dry deciduous forest near Varanasi. I. Stand structure and non-photosynthetic biomass. Tropical Ecology, 11, 90-104.
- Murphy P.G. and Lugo, A.E. (1986) Ecology of tropical dry forest. Annual Review of Ecology & Systematics, 17, 67-88.
- Karmacharya, S.B. and Singh, K.P. (1992) Biomass and net production of teak plantation in a dry tropical region in India. Forest Ecology & Management, 55, 233-247.
- Kaul, O.N., Sharma, D.C., Tandon, V.N. and Srivatava, P.B.L. (1979) Organic matter and plant nutrients in a teak (Tectona grandis) plantation. Indian Forester, 105, 573-582.