Modern Economy
Vol.4 No.3(2013), Article ID:29123,6 pages DOI:10.4236/me.2013.43021
The Case for an M2 Growth Rate of 10%
School of Business, Duquesne University, Pittsburgh, USA
Email: Carlson@duq.edu, Lackman@duq.edu
Received December 7, 2012; revised January 9, 2013; accepted February 1, 2013
Keywords: Monetary Policy
ABSTRACT
The recovery from the 2008-2009 recession has been much slower than the average recovery since the 1924 recession. As analysts who believe that the St. Louis model created by Leonall Andersen and Jerry Jordan still has relevance we believe that the slow rate of M2 growth since 2Q2009 is a major reason why GDP growth has been so slow. At the 9th Annual Missouri Economics Conference on March 27, 2009 we presented a paper, “Interwar Hoarding, Liquidity Traps, and the 2008 Solvency Trap” in which we recommended that the Federal Reserve attempt to maintain a 10% growth rate for M2 (or a growth rate of 6.80% on an inflation adjusted basis similar to the 1960, 1970, 1982 recoveries) with the hope that the plan would lead to a real GDP growth rate of 7% with an inflation rate of 3%. The title of that paper indicates two other factors hindering both M2 and GDP growth. Bank hoarding of excess reserves far in excess of ratios seen in the 1930s put the US into a liquidity trap. But in 2008 this was not an ordinary trap. We tried to coin the term “solvency trap” to indicate our belief that, using mark to market accounting, the financial system was insolvent. As Reinhart and Rogoff have noted, recoveries from financial crises tend to be slower than those from ordinary recessions. Analyses of each downturn since 1922 are conducted along with what has happened after the economy bottomed in 2Q09 including money supply analysis. Three years have passed. We continue to believe our original recommendation was correct.
1. Introduction
As monetarists influenced by Karl Brunner, and Allan Meltzer believe that the growth rate of the money stock can have significant effects on the economy. In 1968 Leonall Andersen and Jerry Jordan [1] of the Federal Reserve Bank of St. Louis started a significant economic debate with the publication of their reduced form model of the economy. Basically, it was a regression of GNP versus various fiscal and monetary measures. We do not wish to get into the Monetarist, Keynesian, Rational Expectations, and, Supply Side arguments but we note that Andersen and Jordan [1], Keran [2], Laffer and Ranson [3], etc. found that money stock explanators were very significant with t-statistics of 4 and up. Summary statistics are provided for the 15 recessions from 1924 through 2009.
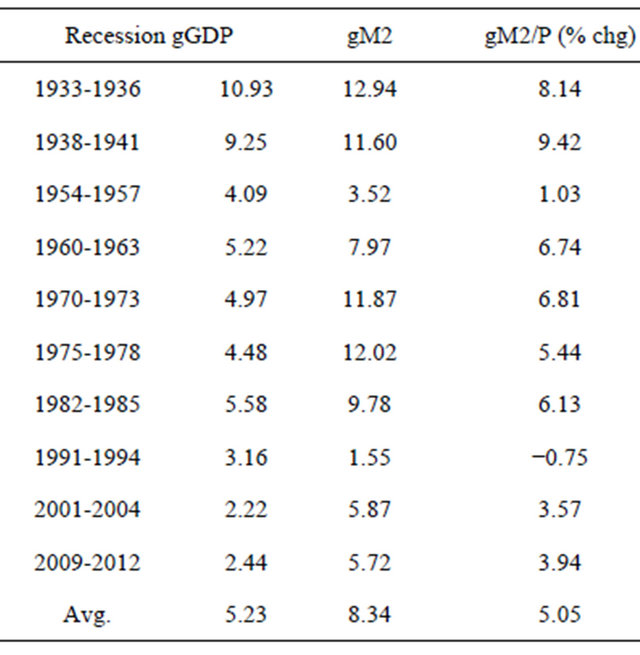
Definitions: gGDP is the growth rate of real GDP for the year following the recession bottom; gM2 the growth rate of the M2 money stock; and gM2/P the growth rate of the real M2 money stock as estimated by M2 divided by the GDP deflator.
Two regressions were run. The first is real GDP growth (Y) versus nominal M2 (X).The result is
 (1)
(1)
In the second regression gM2 is replaced with gM2/P. The result is better with the regression being
 . (2)
. (2)
In both cases 2Q09-2Q10 M2 growth was substantially below the historical recovery average and so was GDP growth. Of course other factors affect GDP, fiscal policy, lags, the state of inventories and perhaps in 2001 the loss of wealth from the dot com stock market crash, the NASDAQ crash was truly spectacular.
Data Notes: Real GDP from the National Income and Product Accounts of the BEA. Interwar figures use NIPA with interpolations from Balke and Gordon [4]. M2 from FRED, 1924 to 1959 from Friedman [5]. These data are shown in Table 1.
2. Longer Run Results
To find a longer run effect of money on recoveries we use a 3 year period which is what is available for 2Q09 to 2Q12, at this time. The sample is smaller because the 1924, 1927, 1958, and 1980 recessions run into the following down turn and 1949-1952 runs into the Korean War.
 (3)
(3)
Recommendation note. The growth rates of real M2 for the 1960-1963, 1970-1973, and 1982-1985 recessions averaged 6.56%, close to our 6.80% recommendation with real GDP growth rates averaging 5.36%. These data are shown in Table 2.
There are three generalizations about recoveries that
Table 1. GDP growth vs M2 growth—short run.

Source: FRED: Federal Reserve Bank of St. Louis, 2012.
Table 2. GDP growth vs M2 growth—longer run.

Source: FRED: Federal Reserve Bank of St. Louis, 2012.
are of interest. The first is that faster M2 growth tends to cause a faster recovery from the evidence above. Because of the liquidity trap problem discussed below we believe the focus should be on the growth of M2 rather than the size of the Federal Reserve’s balance sheet or the level of interest rates. The second is the Reinhart and Rogoff [6] conclusion that recoveries after financial upheavals are generally slower than average and that it takes time to repair damaged balance sheets. The third expressed by Scott Sperling of Thomas Lee Partners on CNBC’s August 22 program “Closing Bell” is that the deeper the recession the faster the recovery. Ex Reagan Treasury official Larry Kudlow now on CNBC takes delight in citing the fast recovery from the 1981-1982 recession compared to the current slow recovery. Testing Sperling-Kudlow model gGDP = 3.76 + 0.467 Decline; r2 = 0.07, t = 0.83, n = 11, post WWII.
3. Current Recovery versus Others
According to Sperling-Kudlow we should have had a sharp rebound post 2Q09 similar to the pattern of recovery after the sharp recessions of 1974-1975 and 1981- 1982. But the rate of real M2 growth after those two recessions was far higher than 2Q09-2Q12. Given the relatively low rate of money growth after 2009 (either M version, either time period) the growth of post 2009 GDP would be expected to be lower than the historical averages. A second factor retarding the recovery is the Reinhart-Rogoff effect [6]. A third factor in the three year result is that the trend of real M2 growth was, year by year: 0.74%, 3.68%, and 7.49%, averaging 3.94%. If there is a lagged effect it is possible that the effect of the recent 7.49% growth has not been felt yet.
We believe the 1933-1936 recovery should have been the pattern for post 2Q09. The 1933-1936 recovery was surprisingly strong given that the Great Depression downturn ended with a huge financial crisis and final run on banks that caused newly inaugurated President Franklin Roosevelt to declare a bank holiday on March 6, 1933 as his first act as president. Given the severity of the financial crisis which caused the banking system to collapse the Reinhart-Rogoff [6] observation would indicate a slow, painful recovery. It is suspected that ReinhartRogoff [6] did not hold in 1933-1936 for two reasons. First, whether by accident or not, the Fed did the correct thing (as opposed to standing by and allowing waves of bank failures from 4Q30 through March 1933) and let M2 expand at a high 12.94% nominal or 8.14% real rate.
A second reason is that in 1933 there was swift and true reform of the banking system which, except for the S&Ls—a separate category, was stable from 1933 to the 2006 real estate bubble and the change from the originate to hold loans model to the originate to securitize into CDOs model.
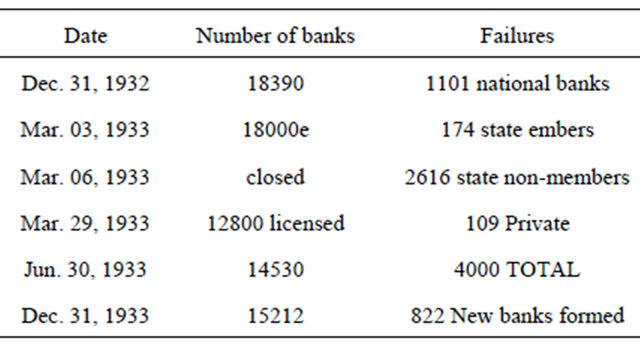
On March 9, 1933 the Emergency Banking Act was passed. One provision was the original TARP, the Reconstruction Finance Corporation was allowed to buy preferred stock and bonds from financial institutions along with the power to remove management and restrict pay if necessary. A curious side note: in 1932-1934 the RFC made more loans to banks than did the Fed (Federal Reserve Bulletin Dec. 1937, pp. 1222-1224, Banking and Monetary Statistics (BMS) 1914-1941, p. 399). Compared to 2008-2012 the cleanup of the 1933 banking mess was amazingly quick. A form of serious stress testing was done. Solvent Class A banks were reopened within days and weeks. Class B banks were reorganized and/or merged. 4000 insolvent Class C banks were closed out of an estimated 18000. Insolvency was not tolerated, in modern terms. Insolvent zombie banks with toxic waste assets were closed. Some BMS statistics show the cleansing:

Source: Federal Reserve Bulletin Dec. 1937, pp. 1222-124, Banking and Monetary Statistics (BMS) 1914-1941, p. 399.
An interesting observation is that while 4000 banks failed in 1933 the net loss was only 3178 implying that 822 new banks were formed. Creative destructionism was alive in 1933, but not in 2008-2009. Post Lehman no too big to fail banks failed (3 were merged: Washington Mutual, Wachovia, and National City). 140 smaller banks were closed. Only 21 new banks were formed in 2009 of 8019 existing on Dec. 31, 2009 (FDIC phone call—Aaron).
More reform came on June 16, 1933 in the Banking Act of 1933. This act was done in 61 pages 102 days after the bank holiday. The 848 page Dodd-Frank Act was passed on July 21, 2010 and 32 months later rules are still being formulated. The Bank Act of 1933 established deposit insurance, separated commercial from investment banking (the Glass-Steagall provision), and established Regulation Q (ultimately a big mistake leading to disintermediation and credit crunches 36 years later). Today there still is argument about the form of the Volcker Rule and continuing concern with the moral hazard problem of “too big to fail”. The cleanup and reforms of 1933 clearly were a success. We do not know about Dodd-Frank.
While the NBER classifies 2001 as a recession, it really is a flat spot. Here are the latest revised quarterly real GDP figures starting with the first top in 4Q00: 11325, 11288, 11362, 11330, and 11370 which ends it. The drops are trivial. The three year figures for the “recession” of 2001 are quite similar to that of the current recovery. A possible explanation for the sub-par growth of GDP is the low rate of growth of M2 compounded by the effects of the dot com stock market crash which sent the NASDAQ index from a peak of 5048 to a low of 1119.
There are two recoveries that do not fit the monetary pattern very well, 1954-1957 and 1991-1994. In both cases there was moderate GDP growth despite weak M2/P growth. In the 1991-1994 period the real growth of M2 was −0.75% annual rate but real GDP growth was 3.16%. A potential explanation could be an after effect of the first gulf war in 1990. After the “victory” oil prices dropped 36% from $20.55 to $13.23 per barrel which could have given a boost to the economy. Regarding 1954-1957 we have no explanation at this time but need to rerun the original Andersen-Jordan study to examine the residuals for this period.
4. Liquidity Trap
We are surprised that virtually no one besides Paul Krugman has discussed the idea that we are in a liquidity trap and how to combat it. Here is Krugman’s definition from Brad Delong’s blog of Jan. 29, 2009: “I keep seeing economics articles that insist that we are NOT in a liquidity trap (and, of course, that yours truly is all wrong) because the situation doesn’t meet the author’s definition of such a trap e.g. the interest rates at which businesses can borrow are not zero: or that there are things the Fed could do, like buying long term bonds, or corporate debt, or something. Well, my definition of a liquidity trap is, purely and simply, a situation in which conventional monetary policy—open market purchases of short term debt has lost effectiveness. Period. End of story. Now, if you prefer a different definition of a liquidity trap, OK, call it a banana, instead. But changing the name”.
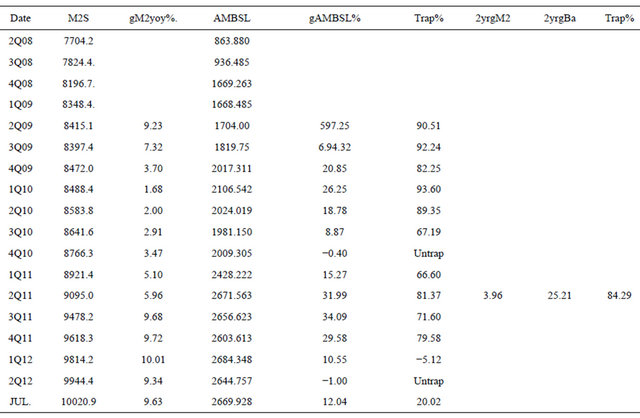
We have a simple quantitative method of measuring a trap. If conventional monetary policy has lost its effectiveness completely then an increase (or decrease) in the monetary base Ba has no effect on the money stock. This brings up the possibility of measuring a partial trap as mentioned in Carlson and Lackman [7]. Suppose the base goes up 20% and the money stock goes up 20% (the money multiplier remaining constant). Then there is no trap. If the money stock does not go up at all then there is a 100% trap. And if the money stock goes up 3% then there is an 85% trap (15% getting through means 85% was trapped). Diane Swonk of Mesirow Financial on CNBC had an interesting description of a trap. Paraphrasing: The helicopters (the Fed) were dropping dollar bills but they were getting caught in the trees (kept by the banks as excess reserves) and not reaching the ground where the people could get them (increasing the money supply). M2 and Ba figures from FRED:
The 2Q08-2Q09 Trap. During the Down turn. From 2Q08 to 2Q09 the base went up 97.25%, a record shattering rate of growth from the FRED chart which goes back to 1918. But M2 went up only 9.23%. The reason was that 90.51% of the base was trapped letting only 9.49% through. If a trap is perfect then the base can go to infinity without boosting M2. But if a trap is partial, even 90%, then it can be broken by a brute force increase in the base which is what the Fed did in 2Q08-2Q09 with QE-1.
The 2Q09-2Q11 Trap. Over tis two year period the base increased at a 25.21% rate. Encountering a trap rate averaging 84% the M2 growth rate was only 3.96%, the M2/P growth rate 2.20% and the real GDP growth rate also a disappointing 2.20%. On page 16 of our 2009 paper we recommended a growth rate of 175% for the base anticipating a trap rate of 94%. Given the actual trap rate of 84% that would have led to an M2 growth rate of 26%, obviously too high. But it could have been adjusted downward. We were too high but the actual path taken by the Fed was too low. The Fed finally recognized that growth was too low which is why there was a QE-2 and now talk of QE-3. In contrast we did not want a pause and wanted QE-1 to continue until the recovery was selfsustaining. So where are we now (4th quarter, 2012)?
Has the Trap Broken? As it turns out the trap may have broken. The 2Q2011 base was $2671.563 billion and the July 2012 level $2669.928 billion, virtually unchanged. Continuing with the Swonk analogy the helicopters stopped dropping dollars over the past year. But while the base has been constant M2 has grown from $9095.0 billion to $10021.1 billion June 2011 to July 2012, a 9.36% rate of growth as shown on Table 3. What has happened is that the dollars caught in the trees have finally started falling to the ground. Bank hoarding of excess reserves has dropped from $1588.7 billion to $1483.0 billion. $14.9 billion of that decrease went to an increase in required reserves and vault cash, the remainder to an increase in cash held by the public (Cp) which rose from $963.0 billion to $1051.4 billion. This kicked of the lending depositing process increasing both deposits and M2. Monetary statistics (from FRED) and the simple Brunner-Meltzer money stock formula show what happened. The money stock formula is;
 (4)
(4)
where the term in brackets is the money multiplier; k is
Table 3. Growth and trap analysis 2008-2012.

Source: FRED: Federal Reserve Bank of St. Louis, 2012.
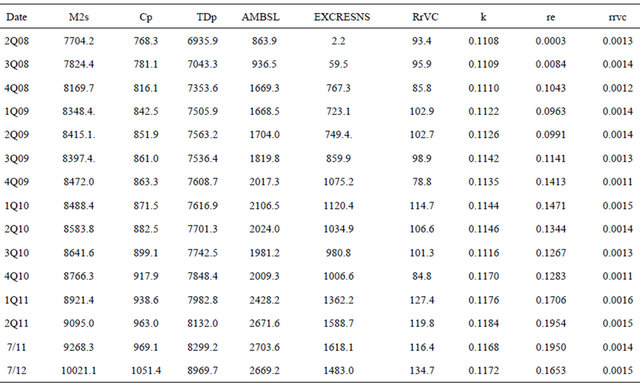
the currency/deposit ratio Cp/TDp, TDp is time plus demand deposits; re the excess reserve ratio Re/TDp; and rrvc is the required reserve and vault cash ratio (Rr + VC/TDp). Two definitions are M2 = Cp + TDp and Ba = Cp + Re + RrVC. Monetary data: In terms of the money stock formula the required reserve ratio is trivial and a non-factor. The currency/deposit ratio is nearly constant and also is a non-factor. The fate of the money stock was and is essentially a battle between the monetary base controlled by the Fed and the excess reserve ratio controlled by the banks.
From 2Q08 to 4Q08 excess reserves went from $2.2 billion to $767.3 billion and re from 0.0003 to 0.1043, an increase far outstripping anything ever experienced in US history, even during the Great Depression. But equally impressive was the QE-1 response of the Fed which virtually doubled the monetary base from $863.9 billion to $1669.3 billion in six months, a spectacular annual growth rate of 273%. Again, nothing like this had ever happened before. But the rise in the excess reserve ratio re cancelled much of the increase in the base. Hence the annual rate of growth of M2 was only 12.45% for the six month period (9.23% was for the year).
Then came the pause which we opposed. From 4Q08 to 4Q10 the base went from $1669.3 to $2009.3, an annual growth rate of 9.71%, very good in normal times but not with a dysfunctional banking system increasing its excess reserves from $767.3 to $1006.6 and the excess reserve ratio from 1043 to 1283 as shown on Table 4. Money stock growth was only 3.59% during this period and only 2.38% adjusted for inflation, far short of M growth after most other recessions.
QE-2 provided another rapid increase in the base. From 4Q10 to 2Q11 the base went from $2009.3 to $2671.6, an annual rate of 76.79%. But the banks hoarded another $582.1 billion sending the excess reserve ratio from 0.1283 to 0.1954 (in October 1940 re hit a peak of 0.1805). As a result M2 grew from $8766.3 to $9095.0, an annual rate of 7.64% and 5.23% adjusted for inflation, still below our targets. During QE-2 only 10% of the growth in the base got through to growth in the money stock implying a trap rate of 90%.
The last 13 months have been a surprise. The base has been held virtually constant going from $2671.6 to $2669.2 within a rounding error of 0.1%. Yet M2 has grown at a nominal rate of 9.36% and a real rate of 7.29%, finally above our target (by 0.49%). The reason is that the excess reserve ratio declined from 0.1954 to 0.1653. Perhaps the banks are done accumulating more excess reserves.
There is a troubling observation regarding the recent dishoarding by the banks. Almost the same behavior occurred from 4Q09 to 4Q10. The base went from $2017.3 to $2009.3, again an almost zero change. But M2 went from $8472.0 to 8766.3, a gain of 3.47%, suggesting that trapping behavior had ended. Then the trap came back.
Table 4. Money stock data and ratios.

Source: FRED, Federal Reserve Bank of St. Louis, 2012.
One quick thing that could be done is stopping the paymentof interest on excess reserves. Paying banks to hoard seems to be counterproductive.
A Complication: Inflation. Our 2009 paper called for an inflation rate of 3% approximately equal to the long run historical rate. The Fed’s apparent target is 2%. Professor Kenneth Rogoff [8] has suggested a 4% - 6% rate of inflation. Our reason is simple. The US has an overload of debt. There are three ways out: default, austerity, and inflating our way out. We are not suggesting massive inflation, just one percentage point above the apparent Fed target. Money stock growth to generate 3% inflation rather than 2% would be higher than that recommended below.
5. Conclusions
There are two problems: what should be the target growth rate for M2 and how do we get there. Unfortunately politics is involved but it does make setting a target easier. In the three years of the Reagan-Volcker recovery the real growth rates of M2 were 8.05%, 3.86%, 6.52% averaging 6.13%. Real M2 growth rates in the 1961-1964 and 1970-1973 recoveries were 6.74% and 6.81% which are almost exactly equal to our 6.80% target from the 2009 paper. In contrast the 2Q09-2Q12 real rates have been 0.74%, 3.69%, 7.49% averaging 3.94%, far short of prior recoveries. In the first year of the Reagan-Volcker 3Q82-3Q83 recovery the real M2 growth rate was 8.05%.We do not recall criticism of the Reagan-Volcker 8.05% real rate from conservatives. Accordingly, we recommend a target growth rate of 8.05% for M2/P and if inflation is say 2.5% this would be a nominal rate of 10.75% for M2. We also target 12% for nominal M2 growth.
Generating 12% M2 growth. Starting with the July 2012 M2 figure at $10021.1, 12% growth means a July 2013 target of $11223.6. Setting monthly targets arithmetically (alternative: use compounding) that is an increase of $1002.1 per month. The current money multiplier is 3.7544 implying that the base should increase by $266.9 per month to get the M2 growth of $1002.1 per month. Of course the multiplier may change especially if trap behavior returns in which case adjustments would be made. Chemical and electrical engineers face similar problems controlling production with lags and feedback and we are confident that the Fed has the capability to solve this problem.
REFERENCES
- L. C. Andersen and J. L. Jordan, “Monetary and Fiscal Actions: A Test of Their Relative Importance in Economic Stabilization,” Federal Reserve Bank of St. Louis Review, 1968.
- M, W. Keran, “Monetary and Fiscal Influences on Economic Activity: The Historical Evidence,” Federal Reserve Bank of St. Louis Review, 1969.
- A. B. Laffer and R. D. Ranson, “A Formal Model of the Economy,” Journal of Business, Vol. 44, No. 3, 1971, pp. 247-270. doi:10.1086/295375
- N. S. Balke and R. J. Gordon, “Appendix B—Historical Data in Gordon. The American Business Cycle: Continuity and Change,” National Bureau of Economic Research Book Series: Studies in Business Cycles, New York 1986.
- M. Friedman and A. J. Schwartz, “Monetary Statistics of the United States: Estimates, Sources, Methods,” National Bureau of Economic Research, New York, 1970.
- C. Reinhart and K. Rogoff, “This Time is Different: Eight Centuries of Financial Folly,” Princeton University Press, Princeton, 2011.
- W. H. Carlson and C. L. Lackman, “Interwar Hoarding, Liquidity Traps, and the 2008 Solvency Trap,” 9th Annual Missouri Economics Conference, 27 March 2009.
- K. Rogoff in Floyd Norris, “Sometimes Inflation Is Not Evil,” New York Times, 11 August 2011.

