Modern Economy
Vol. 3 No. 2 (2012) , Article ID: 18134 , 7 pages DOI:10.4236/me.2012.32023
Switch to Devalued Drachma and Cost-Push Inflation: A Simple Input-Output Approach to the Greek Case
Department of Public Administration, Panteion University, Athens, Greece
Email: mariolis@hotmail.gr
Received December 23, 2011; revised February 5, 2012; accepted February 17, 2012
Keywords: Cost-Push Inflation; Drachma Devaluation; Dynamic Input-Output Price Models; Greek Economy; International Competitiveness
ABSTRACT
This paper uses simple dynamic input-output price models to estimate the effects of a switch to devalued drachma on the cost-inflation rate in the Greek economy. The findings suggest that the inflationary “pressures” are not too high and, therefore, there is room for trade-balance improvement.
1. Introduction
At the end of 2009, the Greek economy experienced serious internal and external imbalances. Large “twin deficits” on the budget and current accounts (12% and 10% of GDP, respectively, in 2010), high public debt and net international investment position ratios (145% (103%) and –98% (–44%) of GDP, respectively, in 2010 (2000)), negative net national savings (17% of net national disposable income in 2010, and, with the exception of the year 2001, they were negative in each year of the period 2000-2010), high ratios of gross (net) profits to wages (130% (100%) in 2010, and the average value of the period 2000-2010 is 149% (118%)) and unemployment (12% in 2010 and 18% in August 2011) are the current problems of the economy. The exit of Greece from the Eurozone, and the reintroduction of drachma, is viewed by some scholars as the catastrophe of the economy and by others as its salvation. It may be argued, however, that the “number one” problem is the lack of international competitiveness, whilst all the other problems constitute epiphenomena ([1,2]). So, the “late-2000s financial crisis” was not the “cause” but rather the occasion of the “Greek crisis”.
Within the Economic Monetary Union (EMU), the division of labour tends to be governed by the “law of absolute (and not comparative) advantages”, since there is 1) deactivation of trade (tariff and non-tariff) policies; 2) a single currency; 3) free movement of money capital; 4) free movement of labour force; and 5) the so-called “Stability and Growth Pact” ([3-5] and [6-8]). Consequently, the national economies (and/or the regions of certain national economies), which are characterized by a low productivity, will eventually not be able to produce any commodity (setting aside the non-tradable commodities) or, in the best-case scenario, will produce only certain commodities (i.e. “unskilled labour-intensive” commodities; see also [9]). All the available empirical data suggest that this tends to be the case for the Greek economy (e.g. [10]). Therefore, under the present circumstances, i.e. within the EMU, the contemplation of internal devaluation policies, such as reduction in government expenditures and cuts in unit labour costs in the private sector, seems to be the only available, although too little too late “remedy” (see also [11]).
This paper uses simple dynamic input-output price models and data from the most recent (2005) Symmetric Input-Output Table (SIOT) of the Greek economy to estimate the effects of an external devaluation on the cost-push inflation rate.1 All the models have the same structure, which is imposed by the available SIOT (it provides no data on fixed capital stocks, non-competitive imports and sectoral employment), but they are based on different assumptions about the response of sectoral gross value added to currency devaluation. These models have been formed and applied in [13], and the findings were consistent with empirical evidence on the rate of imported cost-inflation in the first year after the last drachma devaluation (by 14%) in March 1998 (the estimated values were in the range of 1.16% - 1.75% and the “actual” one was almost 1.2%).2 The remainder of the paper is structured as follows. Section 2 outlines the analytic framework. Section 3 presents the data construction. Section 4 presents the empirical results. Section 5 concludes.
2. The Analytic Framework
Consider an open, linear system involving only single products and basic commodities (in the sense of Sraffa [15]; see also [16]). Furthermore, assume that 1) the production period is uniform across all industries; 2) the input-output coefficients are fixed; 3) there are no noncompetitive imports; 4) at least one commodity enters directly into its own production; and 5) the system is viable, i.e. the Perron-Frobenius (P-F hereafter) eigenvalue of the irreducible and primitive  matrix of total input-output coefficients,
  , is less than 1.3 On the basis of these assumptions we can write
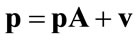 (1)
(1)
or
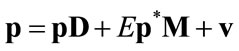 (1a)
(1a)
where 
 denotes the stationary price vector of domestically produced commodities,
  ,
,  the irreducible and primitive matrices of domestic and imported input-output coefficients, respectively,
  ,
,  the nominal exchange rate,
  the given vector of foreign currency prices of the imported commodities,
  , and
, and 
 the vector of gross values added per unit activity level, which equals the sum of 1) consumption of fixed capital,
 ; 2) net taxes on production,
 ; 3) net operating surplus,
 ; and 4) compensation of employees,
  , or
, or
 (2)
(2)
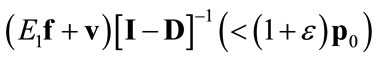
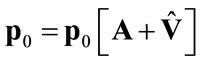
(e.g. [17]). By solving Equations (1) and (1a) for  we obtain
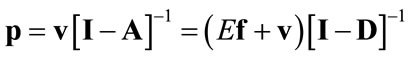 (3)
(3)
where  and
and  denotes the identity matrix.
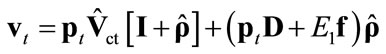
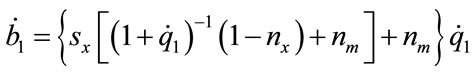
In order to analyze the effects of nominal exchange rate changes on prices we use the following well-known dynamic version of system (1a) ([18-21]):
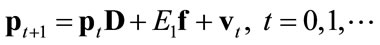 (4)
(4)
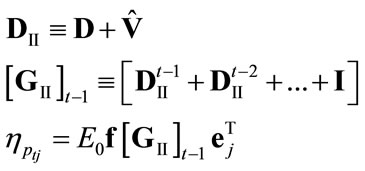
where ,
,  denotes the rate of devaluation, and
  (see Equation (3)). Now we shall distinguish between the following three cases (for a critique of this treatment, see [22]):
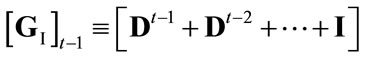
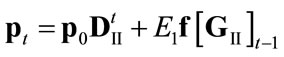
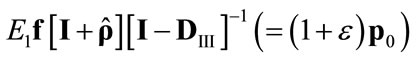
1) . Then the solution of Equation (4) is
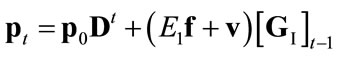 (4.I)
(4.I)
where
 ,
,
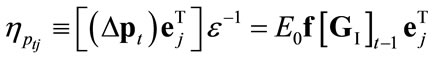 denotes the elasticity of
  with respect to the nominal exchange rate,
  , and
, and  tends to
as  tends to infinity, since
  and, therefore,
 .
.
2) , where
 . Then the solution of Equation (4) is
 (4.II)
where
and  tends to
 since
since 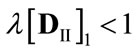 (
( implies that the P-F eigenvalue of
  equals 1 and, therefore,
  ).
).
3) , where

(see Equation (2)),  ,
,  (see Equation (2)) and
 . Then the solution of Equation (4) is
 (4.III)
where
 ,
,
 ,
,
 and
and  tends to
 since
since .
.
Thus, it can be concluded that, within these models, the price movement is governed by the “dated quantities”
([15]) of imported inputs, i.e. ,
,  ,
,  and
and , which reflect the technical and social conditions of production.
3. Data Construction
The SIOT of the Greek economy are provided via the Eurostat website (http://ec.europa. eu/eurostat), and describe 59 product/industry groups, which are classified according to CPA (Classification of Product by Activity). However, all the elements associated with the industry “Uranium and thorium ores” equal zero, whilst the only positive elements associated with the industry “Private households with employed persons” are “compensation of employees” and “final consumption expenditure by households” (which are equal to each other). Therefore, we remove these industries from the analysis and derive SIOT of dimensions 57 × 57.
The market prices of all products are taken to be equal to 1; that is to say, the physical unit of measurement of each product is that unit which is worth of a monetary unit (e.g. [23]). Thus, the matrices of input-output coefficients and the vector of gross values added per unit activity level (as well as its constituent components; see equation (2)) are obtained by dividing element-by-element the inputs and the gross value added of each industry, respectively, by its gross output.
Finally, we set , and given that the international competitiveness of the Greek economy has declined by almost 30% since 2001 (in accordance with estimates of the Bank of Greece; e.g. [10]), we suppose that
4. Empirical Results
The application of the three models (see Equations (4.I)- (4.III)) to the input-output data of the Greek economy, for the year 2005, gives the results summarized in Tables 1-3 (Mathematica 7.0 is used in the calculations, whilst the precision in internal calculations is set to 16 digits. For the analytical results, which are available on request from the authors, see [24]).
Tables 1 and 2 are associated with Model III, which gives the highest rates of cost-inflation. Table 1 reports the industries that exhibit the three largest and the three smallest price increases after the devaluation, the relevant price evolution, and some statistical measures (i.e. the arithmetic mean, AM, standard deviation, SD, and coefficient of variation, CV  SD (AM)–1) for the entire price vector. Table 2 reports the evolution of the AM of commodity prices of the four major sectors of the economy (ν indicates the number of industries and the numbers in parentheses indicate the SD), and the percentage of sectoral exports (imports) to total exports (imports). Thus, since the price movement is governed by the dated quantities of imported inputs, it can be concluded, roughly speaking, that 1) Manufacturing (“Agriculture” and Services) is (are) the most (less) import-dependent sector(s); 2) Manufacturing (“Agriculture”) is the most (less) dependent sector on direct imported inputs (as judged by
 , which equals the change in the P-F price eigenvector); and 3) the production conditions are similar across all industries in the “Mining” sector (as judged by the SD of commodity prices).
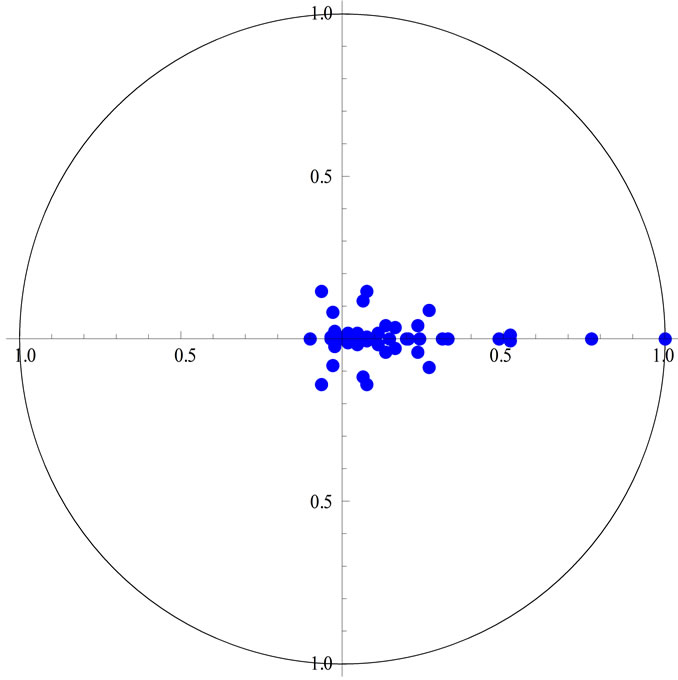
As is well known, the adjustment of Model III (for example) towards the new equilibrium depends on the magnitudes of  (which are in the range of 1.248 - 18.862) and
  (
( 0.893; see also Fig-
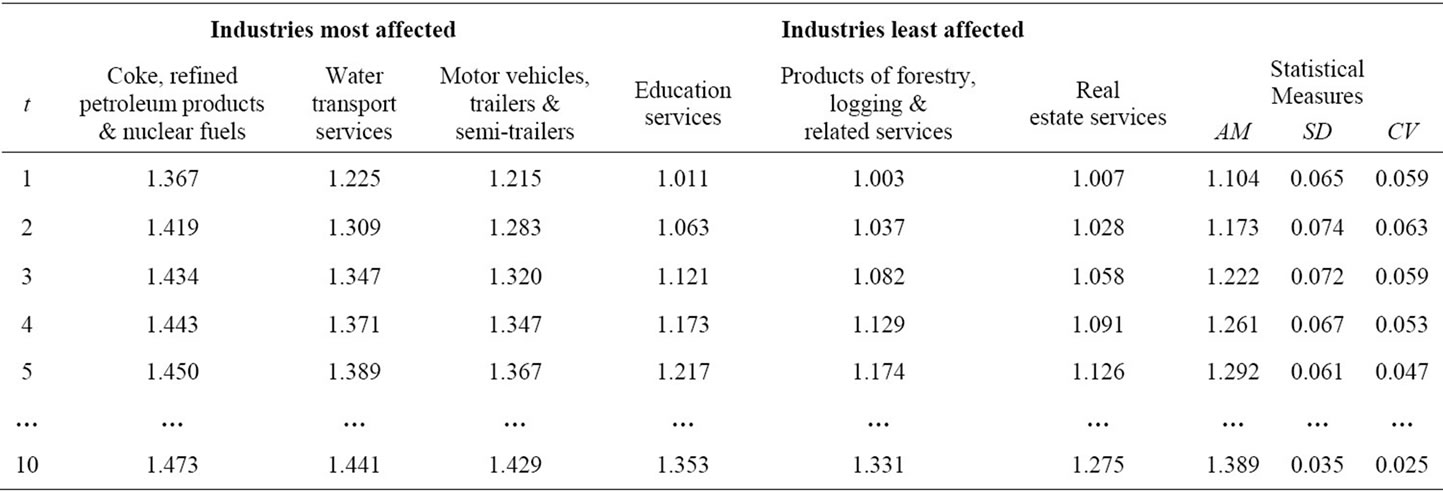
Table 1. The post-devaluation largest and smallest price increases; Model III.
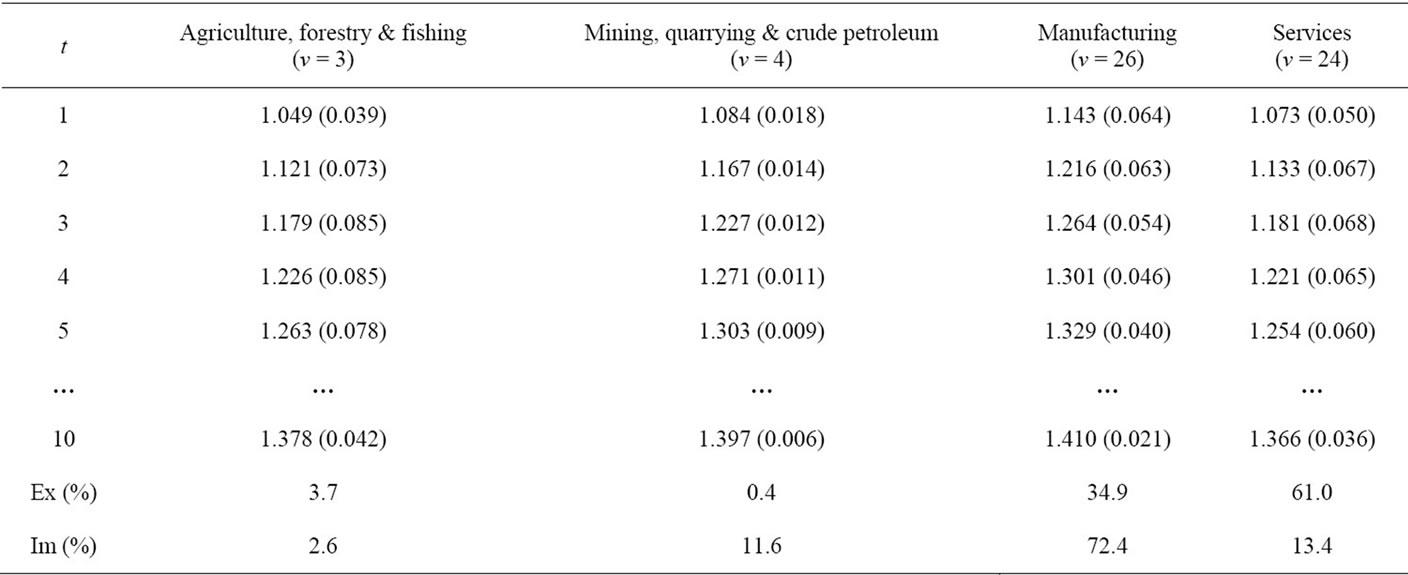
Table 2. The price evolution of the four major sectors; Model III.
ure 1, which displays the location of the “relative eigenvalues”,  and
and ,
,
 in the complex plane). Indeed, the simulations show that the speed of the inflationary “wave” is not too high: the ΑΜ of commodity prices associated with Model III (II) reaches approximately 95% of its final (asymptotic) value at
 , with
  0.023 (
 ), whilst that of the less realistic Model I remains practically unchanged, and approximately equal to 1.093, with
  0.065, for
 .4
.4
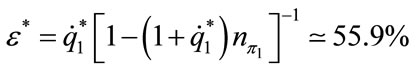
Table 3 is associated with the three models and reports the evolution of the per-period cost-inflation rate (as measured by the gross value of domestic production), . It then follows that at
  the international competitiveness of the economy (as measured by the real exchange rate,
 ) increases by
 (5)
(5)
i.e. between 37.2% and 42.4% (it may also be noted that the foreign-currency price of exports decreases by 26.9%; consider the first and the last but one rows of Table 2). Since 1) the elasticity of export volume with respect to the real exchange rate,  , is in the range of 0.60 to 0.71, whilst the relevant elasticity of import volume,
  , is in the range of
  to
to  (in accordance with estimates of the IMF and the Bank of Greece; e.g. [29]); 2) for the year 2010, the exports of goods and services,
  , are 48.2 million Euros and the imports are 67.7 million Euros; and 3) the real exchange rate increases by, say, 37.2%, it follows that the deficit of the balance of goods and services,
  , decreases by
 (6)
(6)
where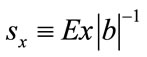 , i.e. between 89.4% and 99.4%.5 Finally, in the case that
 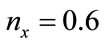 and
and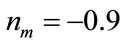 , Equation (6) implies that a deficit of zero,
  = −100%, corresponds to
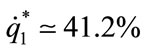 . Since, within our (linear) Model III,
 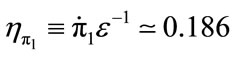 , Equation (5) implies that
 .
.
5. Concluding Remarks
Using simple input-output price models, it has been estimated that a drachma devaluation of 50% does not imply, directly or indirectly, great inflationary “pressures”, as is commonly believed, and in fact could directly increase the international competitiveness of the economy by about 37% and decrease the deficit of the balance of goods and services by about 89%. It need hardly be argued that, even if we overlook the limitations of the used framework, these findings per se cannot provide support
 (a)
(a)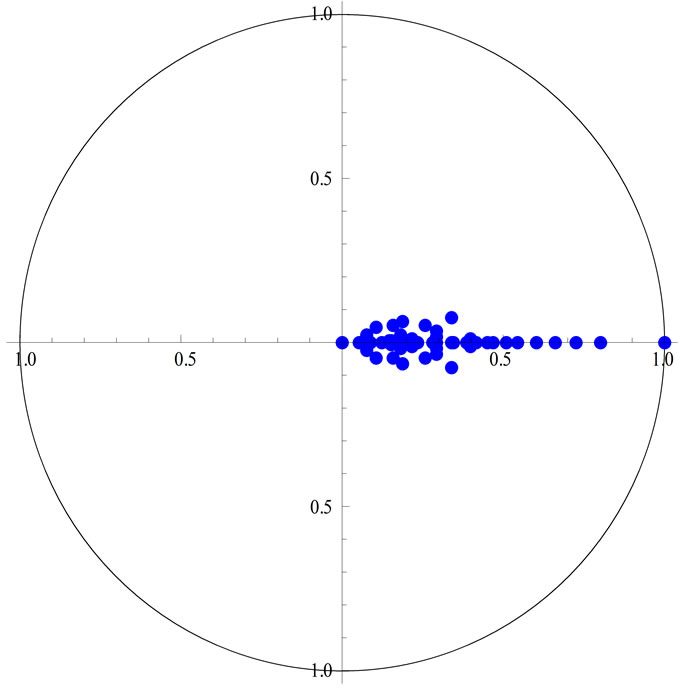 (b)
(b)
Figure 1. The location of the “relative eigenvalues” in the complex plane: (a) Model I; and (b) Model III.
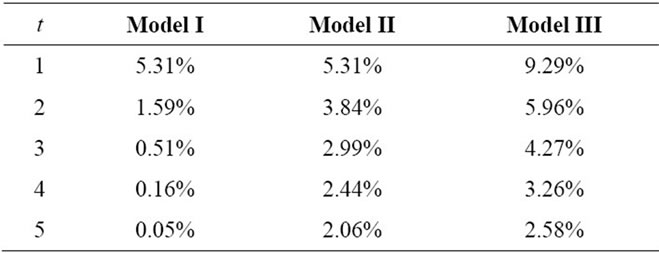
Table 3. The per-period cost-inflation rates.
neither to those who argue for the switch to the drachma, nor to those who argue against (e.g. [30,31] and, respectively, [32]). However, they would seem to be useful for 1) a comparative evaluation of the painful process of internal devaluation, which is in progress; and 2) the case where Greece leaves, in one way or another, the Eurozone.
With respect to future work, there are good theoretical generalizations of the present models ([28,33-35]) that integrate the price and quantity sides and, therefore, could offer more reliable estimates, provided that the required data are available. By applying the empirical approach developed in [36], substitution possibilities between domestic and imported inputs should also be taken into consideration.
6. Acknowledgements
We are grateful to an anonymous referee of this journal for apposite comments and hints. Earlier versions of this paper were presented at Workshops of the “Study Group on Sraffian Economics” at the Panteion University, in June and September 2011: We are indebted to Kostas Papoulis, Stelios Sfakiotakis, George Soklis, Nikolaos Rodousakis and Eugenia Zouvela for helpful comments and suggestions. Furthermore, we are grateful to Peter Flaschel, Costas Lapavitsas, Carlo Panico, Stergios Skaperdas, Spyros Stalias and Lefteris Tsoulfidis for insightful discussions. The usual disclaimer applies.
REFERENCES
- T. Mariolis and K. Papoulis, “‘Twin Deficits’ and International Competitiveness of the Greek Economy,” In: Greek Scientific Association of Political Economy, Ed., Economic Crisis and Greece (in Greek), Gutenberg, Athens, 2011, pp. 275-289.
- T. Mariolis, “Greece, European Union and Economic Crisis (in Greek),” Matura, Athens, 2011.
- A. Brewer, “Trade with Fixed Real Wages and Mobile Capital,” Journal of International Economics, Vol. 18, No. 1-2, 1985, pp. 177-186. doi:10.1016/0022-1996(85)90012-1
- P. R. Krugman and M. Obstfeld, “International Economics: Theory & Policy,” 3rd Edition, Harper Collins College Publishers, New York, 1994.
- P. R. Krugman and M. Obstfeld, “International Economics: Theory & Policy,” 8th Edition, Prentice Hall, Harlow, 2009.
- T. Mariolis, “The New International Division of Labour,” In: T. Mariolis and G. Stamatis, Eds., The EMU Epoch: Globalization, EMU, Drachma, Stock Exchange Market (in Greek), Stachy, Athens, 2000.
- T. Mariolis, “The Division of Labour in European Monetary Union: Absolute versus Comparative Advantage,” European Research Studies, Vol. 3, No. 1-2, 2001, pp. 79- 90.
- S. Parrinello, “The Notion of National Competitiveness in a Global Economy,” In: J. Vint, J. S. Metcalfe, H. D. Kurz, N. Salvadori and P. Samuelson, Eds, Economic Theory and Economic Thought. Essays in Honour of Ian Steedman, Routledge, London, 2009, pp. 49-68.
- H. Flassbeck and F. Spiecker, “The Euro—A Story of Misunderstanding,” Intereconomics: Review of European Economic Policy, Vol. 46, No. 4, 2011, pp. 180-187. doi:10.1007/s10272-011-0381-8
- G. Economou, I. Sampethai and G. Simigiannis, Eds, “The Current Account of Greece: Imbalances and Policy implications (in Greek),” Bank of Greece, Athens, 2010.
- C. Panico, “The Causes of the Debt Crisis in Europe and the Role of Regional Integration,” Working Papers Series, No. 234, Political Economy Research Institute, University of Massachusetts at Amherst, Amherst, 2010.
- R. E. Kalman, “A System-Theoretic Critique of Dynamic Economic Models,” In: B. Lazarevic, Ed., Global and Large Scale System Models, Lecture Notes in Control and Information Sciences, Springer, Berlin, Vol. 19, 1979, pp. 3-24.
- T. Mariolis, C. Economidis, G. Stamatis and N. Fousteris, “Quantitative Evaluation of the Effects of Devaluation on the Cost of Production (in Greek),” Kritiki, Athens, 1997.
- A. Burstein, M. Eichenbaum and S. Rebelo, “Why Are Rates of Inflation So Low after Large Devaluations?” Working Paper 8748, National Bureau of Economic Research Working Papers Series, February 2002. http://www.nber.org/papers/w8748.pdf
- P. Sraffa, “Production of Commodities by Means of Commodities. Prelude to a Critique of Economic Theory,” Cambridge University Press, Cambridge, 1960.
- I. Steedman, “Production of Commodities by Means of Commodities and the Open Economy,” Metroeconomica, Vol. 50, No. 3, pp. 260-276. doi:10.1111/1467-999X.00073
- United Nations, “Handbook of Input-Output Table. Compilation and Analysis. Studies in Methods,” Handbook of National Accounting, Department for Economic and Social Affairs, Statistics Division, Series F, No. 74, United Nations, New York, 1999.
- R. M. Solow, “Competitive Valuation in a Dynamic Input-Output System,” Econometrica, Vol. 27, No. 1, 1959, pp. 30-53. doi:10.2307/1907776
- M. Morciano, “Price Dynamics in an Input-Output Model. An Alternative Approach,” Economics Letters, Vol. 14, No. 4, 1984, pp. 363-368. doi:10.1016/0165-1765(84)90012-0
- M. De Clementi, M. Morciano, A. Orlandi and R. Perrella, “Cumulative Inflation and Dynamic Input-Output Modelling,” In: M. Ciaschini, Ed., Input-Output Analysis. Current Developments, Chapman and Hall, London, 1988, pp. 149-165. doi: 10.1007/978-94-009-2607-3_10
- I. Steedman, “Questions for Kaleckians,” Review of Political Economy, Vol. 4, No. 2, 1992, pp. 125-151. doi:10.1080/09538259200000011
- I. Steedman, “Income Distribution, Foreign Trade and the Value-Added Vector,” Economic Systems Research, Vol. 12, No. 2, 2000, pp. 221-230. doi:10.1080/09535310050005716
- R. Miller and P. Blair, “Input-Output Analysis: Foundations and Extensions,” Prentice Hall, Upper Saddle River, 1985.
- T. Mariolis and A. Katsinos, “Return to Devalued Drachma, Cost-Push Inflation and International Competitiveness: An Input-Output Analysis (in Greek),” Internal Report of the “Study Group on Sraffian Economics”, Department of Public Administration, Panteion University, Mimeo, 2011.
- N. Keyfitz and H. Caswell, “Applied Mathematical Demography,” 3rd Edition, Springer, New York, 2005.
- I. Stott, S. Townley and D. J. Hodgson, “A Framework for Studying Transient Dynamics of Population Projection Matrix Models,” Ecology Letters, Vol. 14, No. 9, 2011, pp. 959-970. doi:10.1111/j.1461-0248.2011.01659.x
- T. Mariolis, “Theoretical Investigation of the Price Response of a Joint Production System to Currency Devaluation,” In: B. Papathanassiou, Ed., Proceedings of the 4th Balkan Conference on Operational Research, Hellenic Operational Research Society, Thessaloniki, Vol. 1, 20-23 October 1997, pp. 244-261.
- T. Mariolis, “Pure Joint Production, Income Distribution, Employment and the Exchange Rate,” Metroeconomica, Vol. 59, No. 4, 2008, pp. 656-665. doi:10.1111/j.1467-999X.2008.00320.x
- D. Malliaropoulos and T. Anastasatos, “Competitiveness, External Deficit and External Debt of the Greek Economy,” Eurobank Research: Economy & Markets, Vol. 6, No. 7, 2011.
- S. Skaperdas, “Seven Myths about the Greek Debt Crisis,” 2011. http://www.socsci.uci.edu/~sskaperd/SkaperdasMythsWP1011.pdf
- Research on Money and Finance, “Breaking Up? A Route out of the Eurozone,” RMF Occasional Report 3, 2011. http://www.researchonmoneyandfinance.org/wp-cotent/upoads/2011/11/Eurozone-Crisis-RMF-Report-3-Breaking-Up.pdf
- P. Flaschel, S. Luchtenberg and C. Proaño, “Crisis as Opportunity: Roads towards Social Capitalism,” Bulletin of Political Economy, Vol. 5, No. 1, 2011, pp. 1-40.
- J. S. Metcalfe and I. Steedman, “Growth and Distribution in an Open Economy,” In: I. Steedman, Ed., Fundamental Issues in Trade Theory, Macmillan, London, 1979, pp. 201-227.
- J. S. Metcalfe and I. Steedman, “Some Long-Run Theory of Employment, Income Distribution and the Exchange Rate,” The Manchester School, Vol. 49, No. 1, 1981, pp. 1-20. doi:10.1111/j.1467-9957.1981.tb00169.x
- T. Mariolis, “Distribution and Growth in a Multi-Sector Open Economy with Excess Capacity,” Economia Internazionale/International Economics, Vol. 59, No. 1, 2006, pp. 51-61.
- Z. Han and B. Schefold, “An Empirical Investigation of Paradoxes: Reswitching and Reverse Capital Deepening in Capital Theory,” Cambridge Journal of Economics, Vol. 30, No. 5, 2006, pp. 737-765. doi: 10.1093/cje/bei089
NOTES
1Kalman [12] stresses: “It is well to bear in mind also (to rub in some conventional wisdom from the system field) that in the economics problem under discussion a simple and reliable answer may be expected only if it were true that the effect of exchange-rate change on domestic price level is loosely coupled to the rest of the economy. If a phenomenon is loosely coupled then we are in the classical-science situation area and there is no problem (Very probably the problem has been solved already). But, on the other hand, if the phenomenon is not loosely coupled, then we have a system-determined problem with all its attendant difficulties”.
2It may be noted that a detailed study of nine “large” post-1990 contractionary devaluations (i.e. in excess of 38% versus US dollar) shows that the rate of inflation, measured by the consumer price index, is very low relative to the exchange rate devaluation ([14]).
3Matrices (and vectors) are denoted by boldface letters. The transpose of an  vector
  is denoted by
 , the diagonal matrix formed from the elements of
  by
by , and
, and  denotes the j-th unit vector. Finally,
  denotes the P-F eigenvalue of a semi-positive
  matrix
 , whilst
 ,
,  and
and
 , the non-dominant eigenvalues.
4The number  is called the “damping ratio”, in population dynamics theory, and can be considered as a measure of the intrinsic resilience of the state vector to disturbance (e.g. [25,26]), and the number
  is called the “asymptotic rate of convergence”. It is also noted that 1)
 ; 2)
; 2) ; (3)
; (3)  are in the range of 1.045 - 4.800; and (4)
 . Finally, it should be stressed that in the case of joint production (see [15,Part 2]), which is represented in the so-called Supply and Use Tables (e.g. [17]), the distribution of the eigenvalues (now, of the matrix
 , where B denotes the output (or make) matrix) may be more complex, leading to erratic price movements ([27,28]).
5It is easily checked that  when
when
and, therefore, the Marshall-Lerner condition,  , is sufficient, but not necessary, for tradebalance improvement.