Journal of Biophysical Chemistry
Vol. 3 No. 2 (2012) , Article ID: 19422 , 7 pages DOI:10.4236/jbpc.2012.32016
Similarity/dissimilarity analysis of protein sequences using the spatial median as a descriptor
![]()
Department of Engineering Mathematics and Physics, Faculty of Engineering, Mansoura University, Mansoura, Egypt; mamh@mans.edu.eg
Received 13 December 2011; revised 25 January 2012; accepted 17 February 2012
Keywords: Right Cone; Non Equal Proteins; Spatial Median; Similarity/Dissimilarity; Linear Correlation and Significance Analysis
ABSTRACT
A novel 3-D graphical representation of protein sequence has been introduced. A right cone of a unit base and unit height has been selected to represent protein sequences on its surface. The twenty amino acids have been represented by 20 circles and all protein’s residues have been represented by n lines on the cone’s surface. All the spots which represent the protein’s residues have been shown in the cone’s top view. The spatial median of all the spots is used as a new descriptor of any protein sequence. This approach was applied on two short segments of protein of yeast Saccharomyces cerevisiae. The examination of the similarities/dissimilarities for the eight ND5 proteins and the six β-globin proteins illustrate the utility of our approach. A linear correlation and significance analysis have been provided to compare our results and the percentage sequence alignment identity.
1. INTRODUCTION
There is a huge gap between the growth of protein sequence and the structure databases. Many researchers in different areas have tried to bridge this gap. Protein structure prediction has succeeded in doing this with little charges compared with the experimental methods as NMR and X-ray crystallography. Sequence analysis plays an important role in protein structure prediction; proteins with similar sequences mostly have similar structures [1]. Usual representation of protein sequences is alphabetic representation or what is called letter sequence representtation (LSR). LSR represents any protein sequence by letters corresponding to the 20 amino acids. The 20 amino acids’ letters are A, R, N, D, C, Q, E, G, H, I, L, K, M, F, P, S, T, W, Y, and V. It is difficult to recognize and compare different sequences by using LSR. So, many mathematical approaches were proposed to translate protein sequences from letters to 2D or 3D graphical representations accompanied by mathematical objects such as vectors or matrices to use them as sequence descriptors and compare these mathematical objects. Numerical characterization is very useful whatever it is depending on a graphical representation [2-16] or not [17]. However, approaches in which the numerical characterization is preceded by a graphical representation are better than those with non-graphical representation because the graphical representation introduces a visual inspection.
Graphical representation of protein sequences may be depending on selecting a geometrical object to represent residues or assigning vectors to residues. An example of assigning vectors to residues in 2D was done by assigning a vector of two components to each amino acid [9]. These two components were pKa of NH3+ and COOH as xand y-coordinates respectively. It is modified by representing the y-coordinate as the difference between each pKa (COOH) of each amino acid and the average of all pKa (COOH) of all twenty amino acids [12]. An example of assigning vectors to residues in 3D was introduced by selecting three physicochemical properties of amino acids side chains which are hydropathy index, amino acid side chain charge, and mean accessible surface area (ASA) of side chains [15]. Another 3D graphical representation of proteins based on five-letter model of amino acids which converts the twenty letters of amino acids to only five letters [13]. Therefore, a vector of three components was assigned to each letter in the reduced sequence.
A square [3,4] and circle [6] are examples of 2D geometrical objects, while a tetrahedron [4] and sphere [16] are examples of 3D geometrical objects. Recently, a unit radius sphere was selected to represent any protein sequence on its surface [16]. The sphere’s surface was divided into 20 latitude like-circles and n longitude-like semi-circles; n is the protein sequence length. The obtained 3D graphical representation was represented by an assignment of 20 amino acids without depending on a pre-graphical representation of its RNA sequence.
In this paper, a right cone with a unit base radius and unit height has been chosen to represent any protein sequence on its surface. The idea of our approach has been illustrated by applying it on the two short segments of protein of yeast Saccharomyces cerevisiae. This approch is applied on the eight ND5 proteins and on the six β-globin proteins and the similarity/dissimilarity are measured for each type. Our approach is compared with the percentage sequence alignment (PID%) through a linear correlation and significance analysis.
2. 3-D GRAPHICAL REPRESENTATION OF PROTEIN PRIMARY SEQUENCES
A geometric cone has been selected to represent any protein sequence on its surface. A right cone of height h and base radius r is oriented along the z-axis, with vertex pointing up, and with the base located at z = 0 as shown in Figure 1. The right cone can be described by the following parametric Equations:
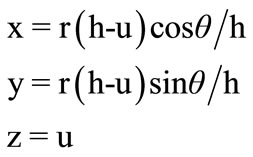 (1)
(1)
For 0 ≤ u ≤ h and 0 ≤ θ < 2p.
We have chosen the cone’s height and radius by unity (h = 1, r = 1). Twenty circles and n lines are drawn on the cone’s surface to represent any protein sequence of length n. Each circle represents one of the different 20 amino acids, and each line represents a single residue of the protein sequence’s residues. The base circle is considered as the first circle. The circumference of the base circle is divided into n equal divisions by using n-points. The coordinates of the first point with θ equal zero are (1, 0, 0). Each line is drawn by using one of these points and the vertex. So, the circumference of all the twenty circles is divided into n equal divisions as shown in Figure 2.
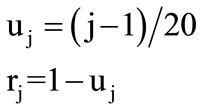
The 20 different amino acids have been ordered alphabetically due to 3-Letter code. Therefore, the 20 circles have been assigned to the 20 amino acids from base to vertex. The base circle is assigned to A-amino acid, and the 2nd circle is assigned to R-amino acid and so on. The distance in z-direction between each circle and the base circle is uj. This distance is the height of each circle. The circle's radius and its height are calculated by the following Equations:
 (2)
(2)
where j = 1, 2, 3, ···, 20 The alphabetic order of the 20 amino acids, circles’ radii, and the height of each circle are listed in Table 1. By substituting in Eq.1, our proposed approach is expressed as follows:
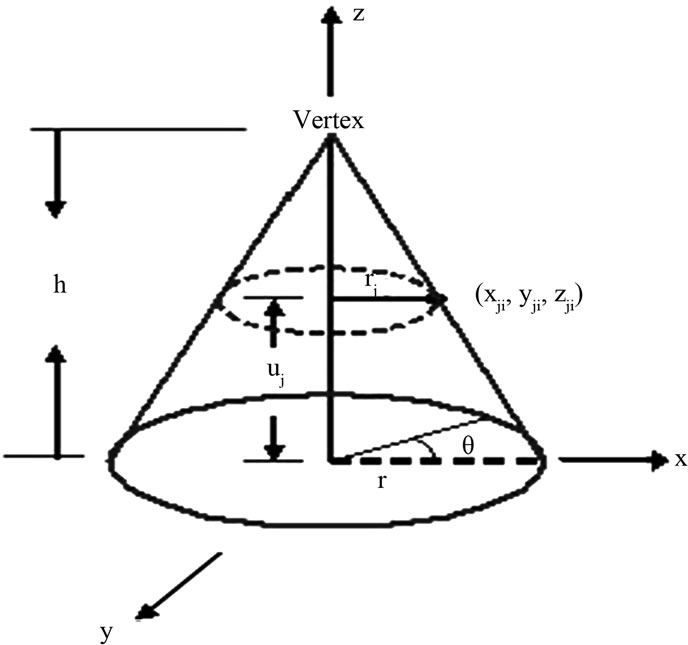
Figure 1. Display a right circular cone.
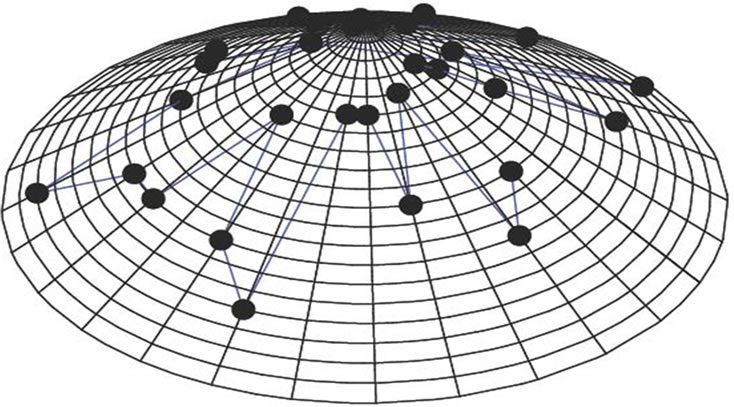
Figure 2. The 3-D graphical representation of the thirty residues of protein I.
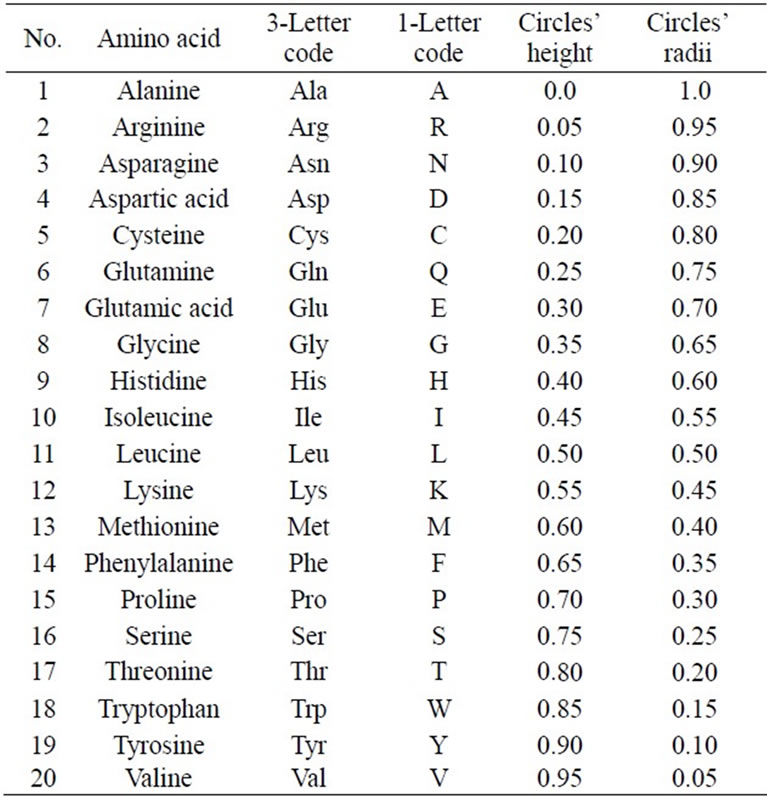
Table 1. Alphabetic order of 20 amino acids due to 3-letter code and corresponding circles’ heights and radii.
 (3)
(3)
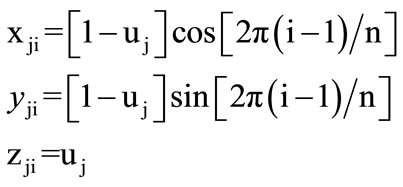
where r = 1 , h = 1, j = 1, 2, 3, ···, 20; depending on the amino acid corresponding circle’s number, and i = 1, 2, 3, ···, n; depending on the residue’s position in the protein sequence and n is the protein sequence length. The spots of our 3-D graphical representation are calculated by using Eq.3. These spots are placed at the intersections of the circles and lines. Therefore, our 3-D graphical representation is obtained as walking in 3-D space over the intersections of the 20 circles and n lines on the cone’s surface.
We have applied our approach on the two short segments of “yeast Sacchromyces cerevisiae”. Protein I sequence is “WTFESRNDPAKDPVILWLNGGPGCSSLTGL” and protein II sequence is “WFFESRNDPANDPIILWLN GGPGCSSFTGL”. Each protein I and protein II consists of 30 residues. The thirty residues of protein I are represented on the cone as shown in Figure 2. The x, y, and z-coordinates of the two protein segments are listed in Table 2, which are calculated by using Eq.3. The amino acid “W” is the 1st residue in each of the two protein sequences; its coordinates are calculated by putting i = 1 and j = 18 in Eq.3. The 3-D graphical representations of the two segments are similar except for four spots. The Euclidean distance is used to detect the similarity between the two 3-D graphical representations of the two segments of protein. The Euclidean distances have been calculated between the two protein segments coordinates. The Euclidean distances between the x, y, and z-coordinates of the two protein segments are listed in the last column of Table 2. According to Table 2, the Euclidean distances are equal zero except for the positions 2, 11, 14, and 27. This means that the two proteins have four mismatching amino acids.
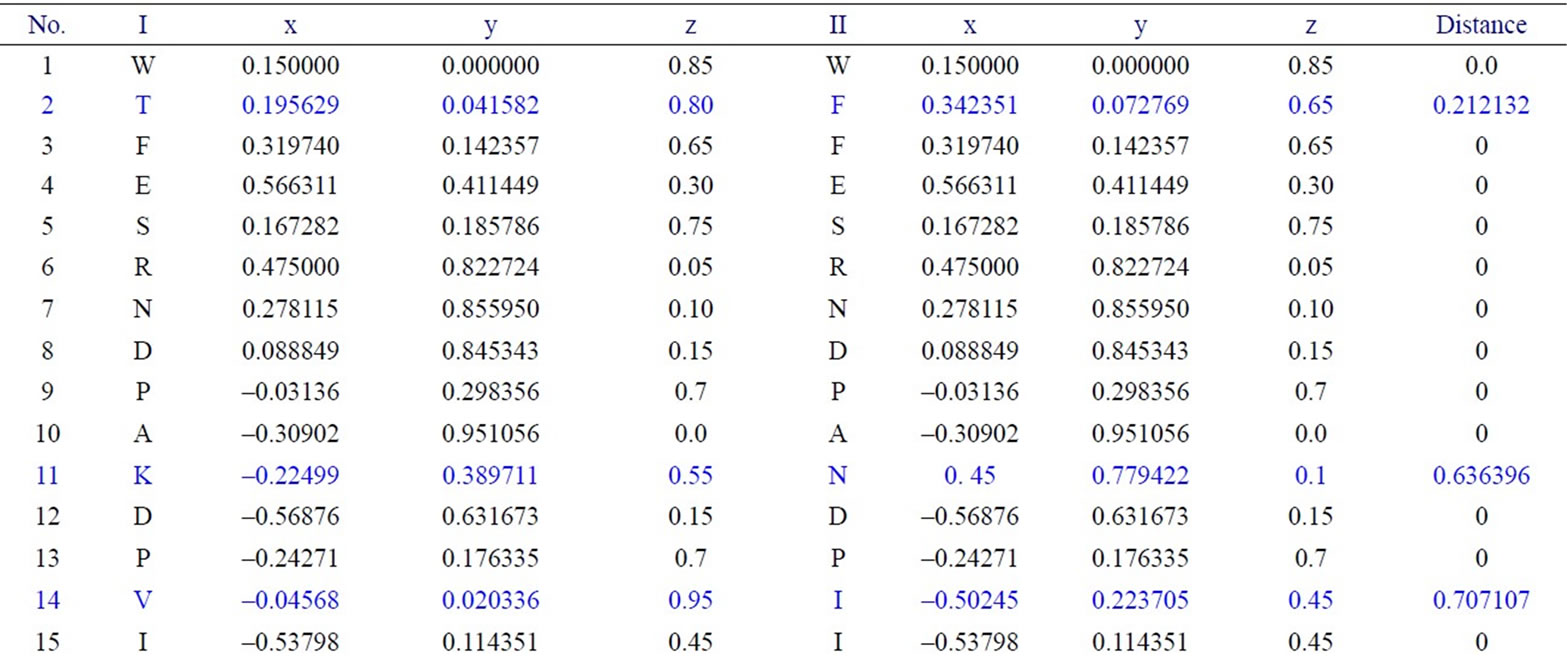
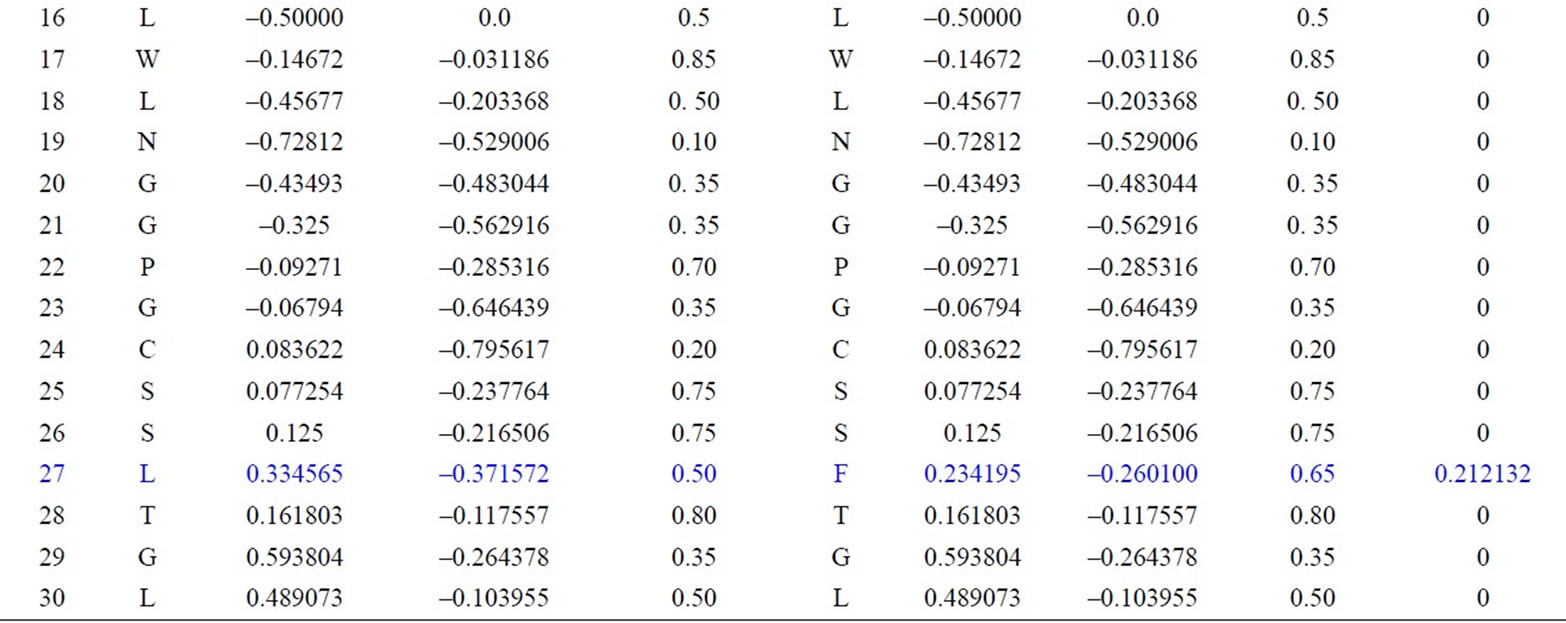
Table 2. Two proteins x, y and z-coordinates and the Euclidean distance between the corresponding points.
We have proposed cone’s top view in order to obtain a good visualization of our 3-D graphical representation. In this one view we can see all the points that represent the protein’s residues.
3. 3-D PROTEIN SEQUENCE DATA
Protein sequences that are used to prove our approach were downloaded from GenBank. The data of eight ND5 (NADH dehydrogenase subunit 5) proteins are: human (Homo sapiens, AP_000649), gorilla (Gorilla gorilla, NP _008222), common chimpanzee (Pan troglodytes, NP_ 008196), pygmy chimpanzee (Pan paniscus, NP_008209), fin whale (Balaenoptera physalus, NP_006899), blue whale (Balaenoptera musculus, NP_007066), rat (Rattus norvegicus, AP_004902), and opossum (Didelphis virginiana, NP_007105). The data of six β-globin proteins are: human (AAA16334, 147 aa), gorilla (CAA43421, 121 aa), chimpanzee (CAA26204, 125 aa), lemur (AAA 36822, 147 aa), opossum (AAA30976, 147 aa), gallus (CAA23700, 147 aa).
4. SIMILARITY/DISSIMILARITY ANALYSIS
The spatial median (mx, my, mz) of all the spots that represent the protein residues has been calculated to characterize each protein numerically. This means that each protein is represented by one point of three coordinates. The Similarity/dissimilarity analysis becomes simpler than before.
The similarity/dissimilarity analysis can be measured by calculating correlation angle or Euclidean distance between the proteins’ descriptor. We have calculated the Euclidean distance between the spatial median of each protein. The smaller Euclidean distance is the more similar two protein’ sequences. The Euclidean distance between each ND5 proteins are given in Table 3 and between each β-globin proteins are given in Table 4.
5. RESULTS AND DISCUSSION
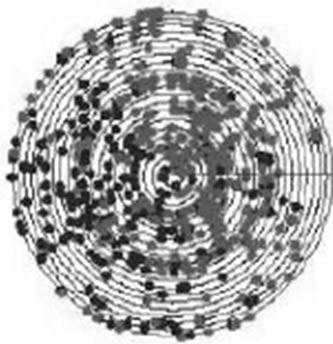
Firstly, this approach is applied on the eight ND5 proteins. The 3D graphical representations are shown for three proteins in Figure 3. Figures 3(a) and (b) indicates the mismatching amino acids for human protein with opossum protein. In the figure, black spots are the similar amino acids in the proteins. Red spots are the amino acids only in human proteins. Blue spots are the amino acids only in opossum protein. Figure 3(a) contains 603 spots corresponding to the 603 residues of human protein; all spots are shown in one view. Figure 3(b) contains 602 spots corresponding to the 602 residues of opossum protein. The zigzag line is omited from the long protein graphs to avoid overlaping due to the huge number of spots.Our 3D graphical representation has no loss of information. We can reconstruct the underlying protein primary sequence as each node in our 3D graph represents a single residue. The similarity/dissimilarity matrix of the eight ND5 proteins based on the Euclidean distance between the spatial median is illustrated in Table 3. Table 3 displays that the proteins of human, gorilla, common chimpanzee, and pigmy chimpanzee are more similar with each other; fin whale and blue whale are also similar. On the other hand, opossum protein is dissimilar to all the other seven proteins. According to the results listed in Table 3, it is easy to notice that our results agree with the results of sequence alignment and the known fact of evolution [18-20]. Then, the approach is applied on the six β-globin proteins. The similarity/dissimilarity matrix of the six β-globin proteins based on the Euclidean distance between the spatial median is illustrated in Table 4. Table 4 displays that the proteins of human, gorilla and chimpanzee are more similar with each other. On the other hand, opossum and gallus proteins are dissimilar to them. These results agree with the results in [13].
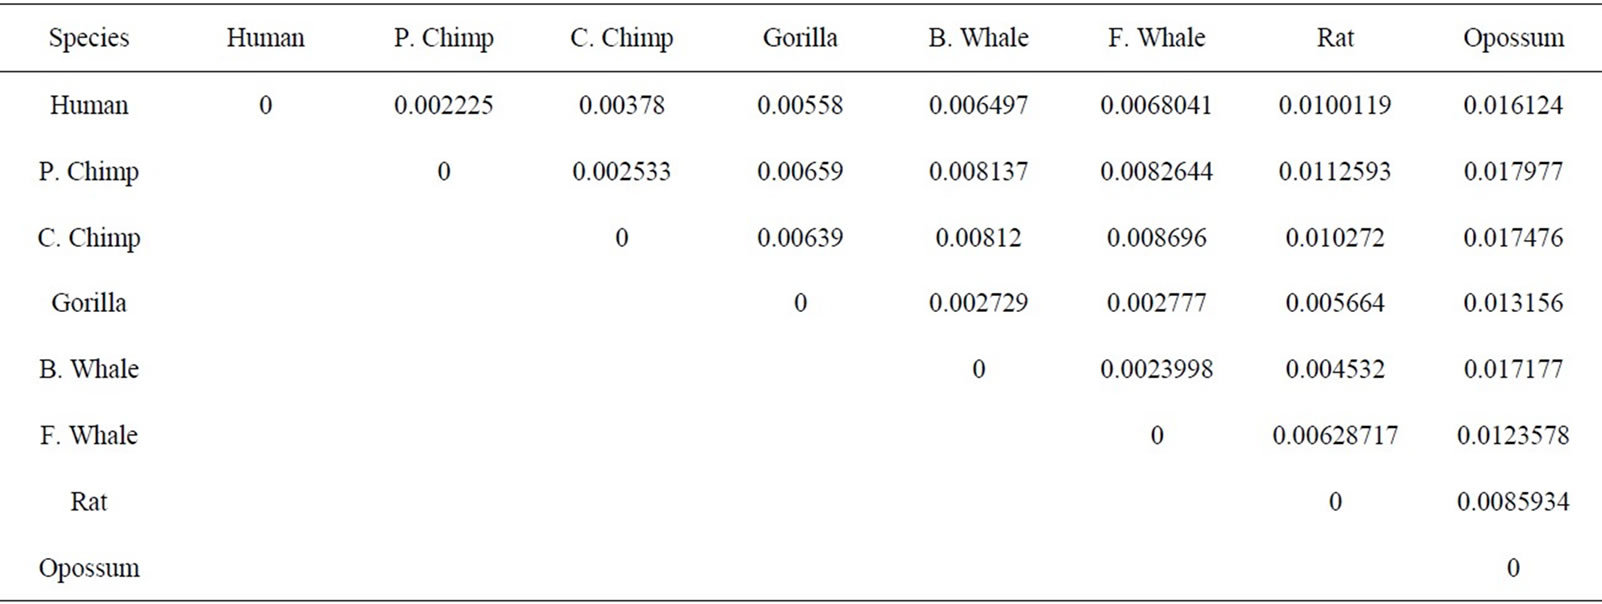
Table 3. The similarity/dissimilarity matrix of the eight ND5 proteins based on the Euclidean distance between the spatial median.
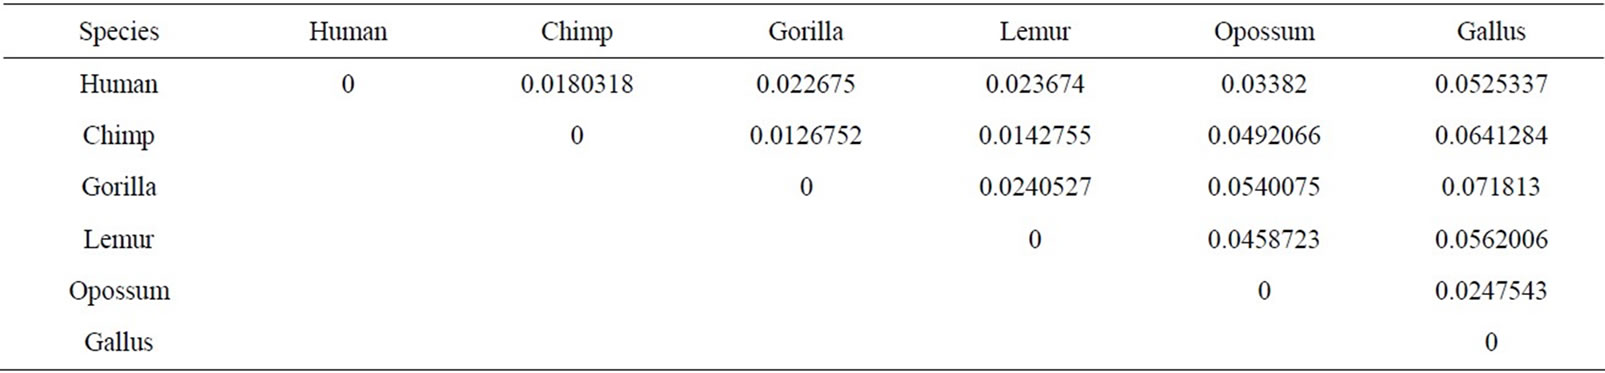
Table 4. The similarity/dissimilarity matrix of the six Beta globin proteins based on the Euclidean distance between the spatial median.
 (a)
(a)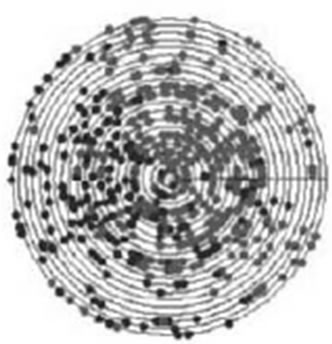 (b)
(b)
Figure 3. The cone’s top view (a) for human protein compared with opossum; (b) for opossum protein compared with human. Black spots are the similar residues, red spots are different residues in human and blue spots are different spots in the opossum.
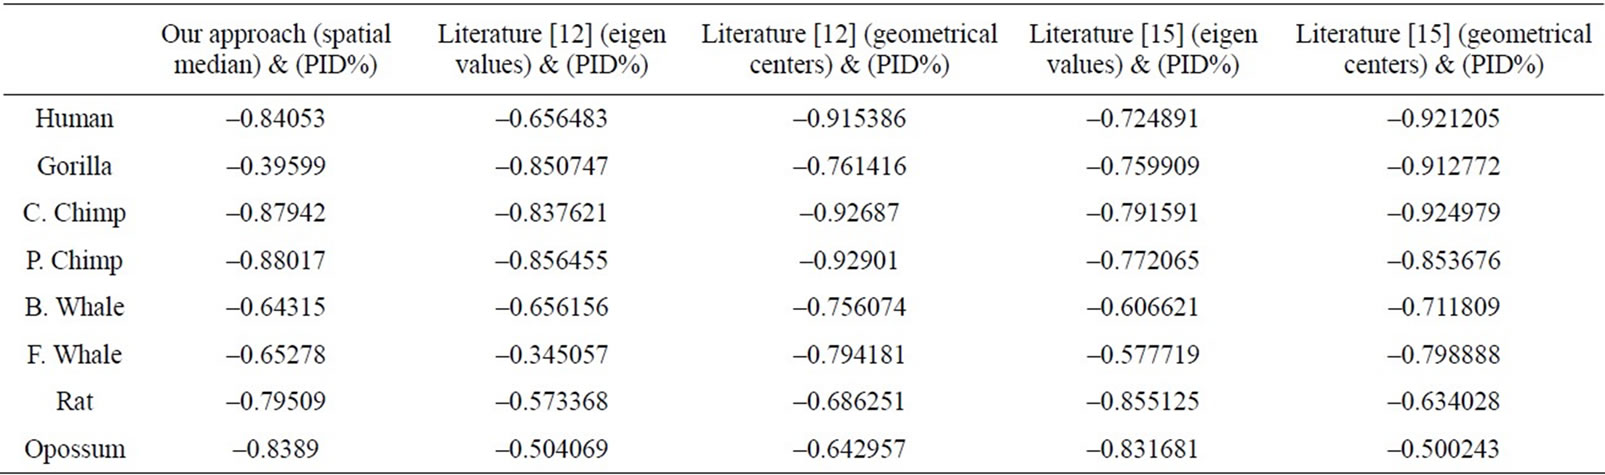
Table 5. The correlation coefficients results for the eight ND5 proteins of our approach and the approaches in Literatures [12] and [15] as compared with percentage sequence identity (PID%) matrix.
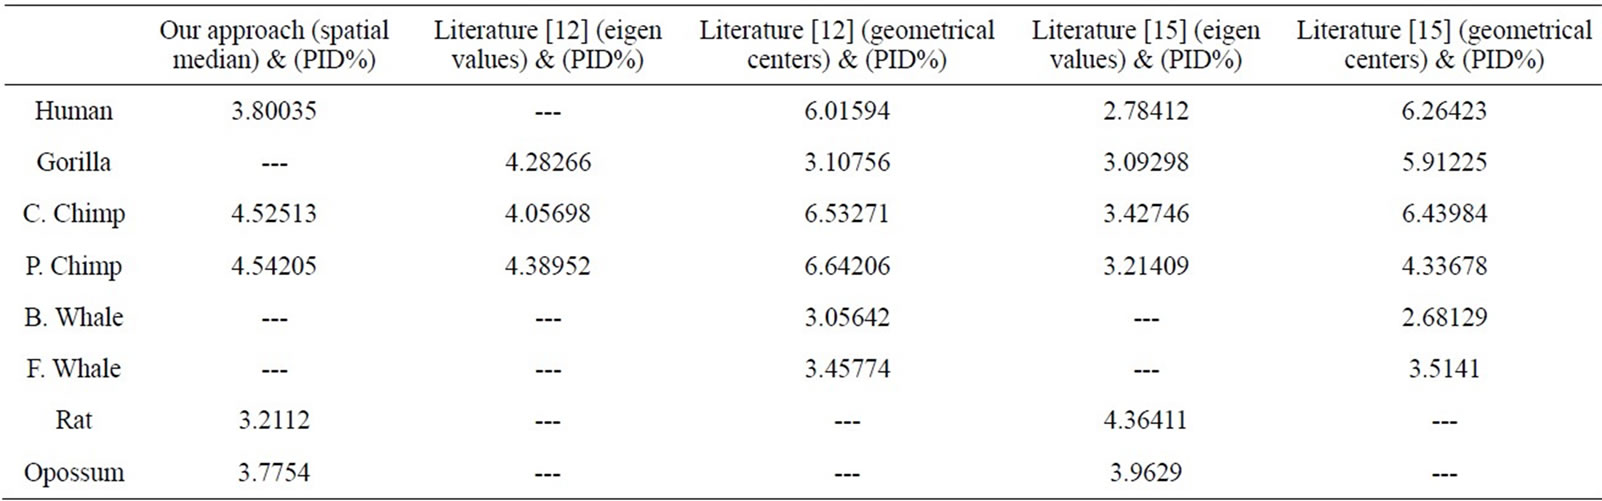
Table 6. The t-values computed for the correlation coefficients |r| ≥ 0.7, based on them the significance is determined.
We have compared our similarity/dissimilarity matrix’s results of Table 3 with the percentage sequence identity (PID%). We have used the PID% matrix [15]. Our comparison is done through a linear correlation and significance analysis [15]. The correlation coefficients results for the eight ND5 proteins of our approach as compared with PID matrix are listed in the 1st column of Table 5. We also have listed the previous comparisons of literatures [12] and [15] with (PID %) matrix in Table 5; they are applied on the same ND5 proteins. Because we have a small set of data (n = 8) which can result high correlations, we considered the significance of correlation to check whether the correlation of two sets of data is sufficiently strong or likely occurred by chance. We checked for statistical significance for correlation coefficient values that are greater than 0.7. The correlation coefficients of PID% matrix and our approach and the two approaches in Ref. [12] and [15] are listed in Table 5. Our sample data equals eight so we use (6) degrees of freedom. A t-value of 2.447 or greater indicates a significance of less than 0.05 chance of having occurred by coincidence. By calculating the r-values’ corresponding t-values in Table 6, all computed t-values are greater than 2.447. This indicates that r-values in Table 5 are not occurred by chance.
6. CONCLUSION
A good visualization is obtained by representing the protein residues on the surface of a right cone of a unit radius and unit height. This approach has no loss of information and is independent on a pre-graphical representation of the RNA triplet codons. It is graphed on a limited space and all the spots representing protein’s residues can be shown in one view (the cone’s top view). This approach is applied on two short and equal segments of protein of yeast Saccharomyces cerevisiae. Our approch is applied also on eight ND5 proteins and six β-globin proteins which are long and non-equal proteins to prove its utility. Our similarity/dissimilarity results are compared with PID% through linear correlation and significance analysis.
REFERENCES
- Echenique P. (2007) Introduction to protein folding for physicists. Contemporary Physics, 48, 81-108. doi:10.1080/00107510701520843
- Feng, Z.P. and Zhang, C.T. (2002) A graphic representation of protein sequence and predicting the subcellular locations of prokaryotic proteins. The International Journal of Biochemistry & Cell Biology, 34, 298-307. doi:10.1016/S1357-2725(01)00121-2
- Randic, M. (2004) 2-D graphical representation of proteins based on virtual genetic code. SAR and QSAR in Environmental Research, 15, 147-157. doi:10.1080/10629360410001697744
- Randic, M., Zupan, J. and Balaban, A.T. (2004) Unique graphical representation of protein sequences based on nucleotide triplet codons. Chemical Physics Letters, 397, 247-252. doi:10.1016/j.cplett.2004.08.118
- Yu, Z.G., Anh, V. and Lau, K.S. (2004) Chaos game representation of protein sequences based on the detailed HP model and their multifractal and correlation analyses. Journal of Theoritical Biology, 226, 341-348. doi:10.1016/j.jtbi.2003.09.009
- Randic, M., Butina, D. and Zupan, J. (2006) Novel 2-D graphical representation of proteins. Chemical Physics Letters, 419, 528-532. doi:10.1016/j.cplett.2005.11.091
- Randic, M., Novic, M., Topic, D.V. and Plasvic, D. (2006) Novel numerical and graphical representation of DNA sequences and proteins. SAR and QSAR in Environmental Research, 17, 583-595. doi:10.1080/10629360601033549
- Chapin, G.A., Diaz, H.G., Molina, R., Santos, J.V., Uriarte, E. and Diaz, Y.G. (2006) Novel 2D maps and coupling numbers for protein sequences. The first QSAR study of polygalacturonases; isolation and prediction of a novel sequence from Psidium guajava L. FEBS Letters, 580, 723-730. doi:10.1016/j.febslet.2005.12.072
- Randic, M. (2007) 2-D graphical representation of proteins based on physico-chemical properties of amino acids. Chemical Physics Letters, 440, 291-295. doi:10.1016/j.cplett.2007.04.037
- Randic, M. (2007) On a geometry-based approach to protein sequence alignment. Journal of Mathematical Chemistry, 43, 756-772. doi:10.1007/s10910-007-9229-7
- Randic, M., Zupan, J. and Topic D.V. (2007) On representation of proteins by star-like graphs. Journal of Molecular Graphics and Modelling, 26, 290-305. doi:10.1016/j.jmgm.2006.12.006
- Wen, J. and Zhang, Y.Y. (2009) A 2D graphical representation of protein sequence and its numerical characterization. Chemical Physics Letters, 476, 281-286. doi:10.1016/j.cplett.2009.06.017
- Li, C., Yu, X. Yang, L., Zheng, X. and Wang, Z. (2009) 3-D maps and coupling numbers for protein sequences, Physica A: Statistical Mechanics and Its Applications, 388, 1967-1972. doi:10.1016/j.physa.2009.01.017
- Randic, M., Mehulic, K., Vukicevic, D., Pisanski, T., Topic, D.V. and Plavsic, D. (2009) Graphical representation of proteins as four-color maps and their numerical characterization. Journal of Molecular Graphics and Modelling, 27, 637-641. doi:10.1016/j.jmgm.2008.10.004
- Abo el Maaty, M.I., Abo-Elkhier, M.M. and Abd Elwahaab, M.A. (2010) 3D graphical representation of protein sequences and their statistical characterization. Physica A: Statistical Mechanics and Its Applications, 389, 4668-4676.
- Abo el Maaty, M.I., Abo-Elkhier, M.M. and Abd Elwahaab, M.A. (2010) Representation of protein sequences on latitude-like circles and longitude-like semi-circles. Chemical Physics Letters, 493, 386-391. doi:10.1016/j.cplett.2010.05.039
- Novic, M. and Randic, M. (2008) Representation of proteins as walks in 20-D space. SAR and QSAR in Environmental Research, 19, 317-337. doi:10.1080/10629360802085066
- Li, M., Badger, J.H., Chen, X., Kwong, S., Kearney, P. and Zhang, H. (2001) An information-based sequence distance and its application to whole mitochondrial genome phylogeny. Bioinformatics, 17, 149-154. doi:10.1093/bioinformatics/17.2.149
- Out, H.H. and Sayood, K. (2003) A new sequence distance measure for phylogenetic tree construction. Bioinformatics, 19, 2122-2130. doi:10.1093/bioinformatics/btg295
- Makarenkov, V. and Lapointe, F. (2004) A weighted leastsquares approach for inferring phylogenies from incomplete distance matrices. Bioinformatics, 20, 2113-2121. doi:10.1093/bioinformatics/bth211