Journal of Environmental Protection
Vol. 3 No. 5 (2012) , Article ID: 19513 , 14 pages DOI:10.4236/jep.2012.35050
Cumulative Risk Assessment Framework for Waterborne Contaminants
![]()
1Cambridge Centre for Climate Change Mitigation Research, University of Cambridge, Cambridge, UK; 2Cambridge Science and Policy Consulting, Cambridge, UK.
Email: djc77@cam.ac.uk
Received January 16th, 2012; revised February 26th, 2012; accepted March 27th, 2012
Keywords: Risk; Water; Cumulative Risk
ABSTRACT
A framework is developed and applied for semi-quantitative estimation of cumulative risk from complex mixtures of compounds in water supplies. The framework places these risks onto the unifying metric of Disability Adjusted Life Years (DALYs), and harmonizes cancer and non-cancer, morbidity and mortality, effects. The framework can be used to: 1) calculate a measure of cumulative risk for a given supply, and compare this measure across supplies or across the same supply with candidate treatments applied; 2) identify those compounds contributing most significantly to cumulative risk, so risk management measures can be applied most effectively; and 3) quantify the influence of different regulatory limits, for specific compounds, on the cumulative risk from drinking water. Results of application to a hypothetical water supply in which all compounds are at their existing Maximum Contaminant Level (MCL) show the cumulative risk for even a complex mixture may be dominated by a few compounds. In this application, that risk was dominated by as few as 10% of the compounds. The analysis also shows that establishing MCLs based on compounds for which there is an oral slope factor, but where no cancer-based limit has yet been established, probably will have little influence on the relative cumulative risk (as measured by Total Weighted DALY) of different water supplies. This arises primarily because the non-cancer-based MCL is usually more restrictive than the one based on cancer for target probabilities of cancer equal to 1E–4 or 1E–5.
1. Introduction
Cumulative risk assessment has developed as a means to address several related science and policy problems associated with risk-based decisions:
· In regard to environmental justice [1-5], there is clear evidence that communities exist in which individuals are exposed to multiple risk agents. This has called into question whether an agent-by-agent approach, each with a margin of safety built in, is adequate for protecting public health.
· Risk agents may interact either additively, synergistically or antagonistically [6,7]. In risk management, however, the approach has generally been to manage each risk agent independently. However, focus on a particular agent in a mixture (e.g. a particular goitrogen such as perchlorate) may prove an ineffective means to control the overall risk from that mixture.
Cumulative risk assessment seeks to redress these problems by providing a framework for systematically assessing the relative contributions of risk agents to the overall risk in an exposed population. The intent is 1) to better characterise risks of mixtures, 2) to identify populations that may be more sensitive and susceptible to environmental exposures due to preconditions (such as exposure through other routes), and 3) to most effectively allocate resources for protection of public health [8].
While laudable goals, cumulative risk assessment faces several significant limitations:
· The underlying science is evolving and improving but is not complete [7,9-11].
· Environmental regulations still tend to focus on one risk agent at a time rather than on cumulative risk, although the Food Quality Protection Act has provided an impetus for considering both aggregate and cumulative risk [12-16].
· Regulatory standards tend to be implemented nationally, while cumulative risk assessments suggest different agent-specific limits on exposure may be appropriate in different geographic areas and/or amongst different subpopulations.
Reducing these limitations requires an improved scientific base of information, improved methods of conducting cumulative risk assessments, and a revised regulatory framework in which the goal is reducing overall health risks to equivalent levels nationally, while allowing for different agent-specific exposures in different geographic areas and/or subpopulations due to differences in the mixtures of agents to which people are exposed. While the science for doing this is not fully developed, the legal and governance framework under which it would take place is even less well established.
In addition to these three limitations, there has been some ambiguity in regard to the application of cumulative risk in regulatory decisions. The rooting of cumulative risk in concerns for environmental justice suggests the calculated risk is to include all risk agents in a community. By contrast, the most significant decisions on cumulative risk in regulatory decisions have focused on calculating that risk in the case of pesticides that share a common mechanism of toxicity. It has resulted in cumulative risk being calculated within four groups: organophosphates, N-methyl carbamates, triazines and chloroacetanilides [17-24]. These regulatory applications leave open the question of whether cumulative risk is to be calculated for all risk agents in an environmental medium, and even between all media to which an individual is exposed, regardless of mechanism of toxicity, or is to be interpreted more narrowly as cumulative risk within a category of risk agents acting by a similar mechanism.
Cumulative risks have been considered in a variety of ways within traditional risk-based environmental regulations. The simplest approach has been the use of hazard indices to characterise mixtures of non-cancer agents. The equivalent approach for carcinogens has been to sum the lifetime excess probability of cancer across the agents in a mixture. Examples may be found in Baird et al. [25], Barnes and Dourson [26] and Cogliano [27]. These approaches are now well established as a basis for regulatory risk assessments. As discussed later, hazard indices are not strictly calculations of risk, but rather regulatory or policy constructs related as much to a qualitative sense of margins of safety as they are to probabilities and severities of effect.
A variant with more scientific complexity, and related more directly to risk than is a hazard index, is the use of Toxicity Equivalence Factors [7,28-31], such as those used in the class of dioxin-like compounds, or amongst classes of pesticides. Here the assumption is that the relative effectiveness of different agents at producing a common outcome (with units of probability of effect per unit intake) can be characterised through a TEF, and weighted intakes summed to produce an equivalent metric of intake through which to calculate risk. This weighted intake is then multiplied by the risk coefficient for the reference compound to calculate cumulative risk. As with hazard indices, there is an assumption of additivity, albeit here of intake or dose.
More recent scientific advances, forming the basis for example of the NexGen program in the USEPA, focus on understanding the biochemical pathways to disease, and the potentially multiple points within those pathways at which risk agents may exert influence. These approaches rely on development of Biologically Based Dose Response Models or BBDRMs in which risk agents can share mechanisms of action such as oxidative stress, or at least pathways of action. Similar approaches have been taken to goitrogens in the case of thyroid disease from for example perchlorate [32]. The BBDRMs are used to assess the cumulative impact of a mixture of risk agents on each of the steps of the pathway to disease, and then to assess the cumulative effect on the disease outcome itself.
The most complex cumulative risk models are the BBDRM models developed for carcinogenesis, represented by those of Moolgavkar et al. [33] or CrawfordBrown et al. [34]. Both modelling traditions can be applied to mixtures of chemicals and radionuclides within a broad framework of initiation, promotion and progression of tumors. They allow for calculation of the overall probability of cancer, but are limited to carcinogens; these need not be direct carcinogens, as the models allow for promoting and progressing agents, as well as reduction in cancer due to selective cytotoxicity. Such approaches are, however, quite data intensive and not common in regulatory practice. At least at present, they are too complex for routine applications in cumulative risk assessment.
Given the importance of cumulative risk in protecting public health and allocating resources for risk management, there is merit in identifying a cumulative risk framework whose complexity is intermediate between those based on hazard indices, and those based on BBDRMs. The present paper focuses on development of such a methodology that is sufficiently flexible to allow for contingencies of data availability and understanding of mechanisms of toxicity, producing characterisations of cumulative risk in cases where there is a mixture of agents that act through the same mechanism of toxicity, agents that act through quite different mechanisms to produce the same effect, and agents that produce quite different effects. The framework additionally harmonizes risk assessment for cancer and non-cancer effects, putting them both onto a probabilistic interpretation.
2. The Metric(s) of Risk
A challenge in cumulative risk assessment is that risk is multi-faceted. Table 1 summarises the literature on factors known to influence at least the subjective response to risk [8]. From this table, it is evident that two risk agents can pose the same quantitative risk (probability and severity of effect) while being perceived as contributing unequally to cumulative risk. This subjective component means that some applications of quantitative or semiquantitative cumulative risk assessment may not fully address the issue of environmental justice mentioned previously, since some stakeholders may consider the factors in Table 1 to be components of their own views on risk.
While recognising this, the current paper focuses solely on what might be termed the “objective” properties of risk, taken here to mean properties related to the probability, severity and public health impacts of the net adverse effects from a risk agent (the term “net” being employed because it is possible that an agent or mixture causes both decrements to and improvements in health). Difficulties in developing a single measure of risk over which risk agents may be summed even when the objecttive properties alone are considered, include:
· The effects of an agent may appear at very early ages or quite late in life, and these differences influence both length and quality of life.
· There can be multiplicity of effects in an individual, with that individual showing multiple instances of a given effect or multiple categories of effects.
· There is a distinction between probability and frequency, with probability referring to the likelihood that an individual will develop the effect during a defined period (such as a lifetime) and frequency referring to how often they develop the effect during the period.

Table 1. Characteristics of a situation that cause it to be perceived as risky by stakeholders.
These issues can in part be addressed through replacement of “risk” (as probability times severity) with the concept of Quality Adjusted Life Years, QALY, or Disability Adjusted Life Years, DALY [35,36]. They can also be addressed by calculating the number of instances of an effect in a population without reference to multiplicity or age-at-effect. In this case, one individual experiencing the effect X times spread across the ages of a lifetime is counted as equivalent to X individuals experiencing the effect one time each and all at the same age. These possibilities are reflected in the framework of assessment developed here.
3. A Framework of Cumulative Risk
The current paper focuses on a methodology of cumulative risk assessment that allows semi-quantitative characterization of risk for complex mixtures of agents, which is then related to a quantitative measure of individual and population risk through characterising impact of exposures on DALY. Focus is on risks from these agents in water supplies as the medium of delivery because the methodology was developed originally for this application, but the methodology can be applied in any medium or even to aggregate risk assessment.
To guide development of the framework, this paper uses a generic structure for multi-attribute decision analysis, shown in Figure 1.
This decision structure allows for any level of quantification, from fully quantitative assessments rooted in biologically based models of common mechanisms of toxicity and formal calculations of DALYs or QALYs, to expert judgment of the probability and severity of effects based on subjective encoding. The framework discussed
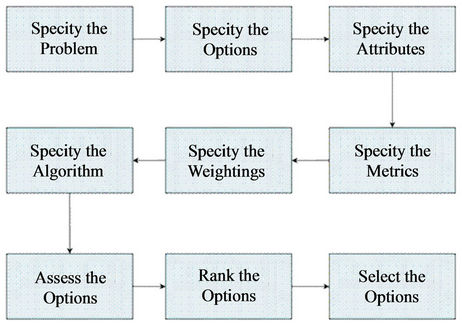
Figure 1. The process of risk assessment and risk management under multi-attribute decision criteria. As described in the text, the final two boxes are not of interest here, and the framework developed supports the seventh box but is only one factor in that assessment process (which may include factors unrelated to risk assessment, such as technological and/or economic feasibility).
is designed to move the process of cumulative risk assessment as close to the former case as possible. The specific steps considered here are:
· Step 1: Specify the problem. Here, the practical problem is reduction of the cumulative risk from a mixture of agents present in drinking water, and understanding the relative contributions of different agents to this cumulative risk in support of risk management decisions and allocation of resources for risk-reduction.
· Step 2: Specify the options. Here, the issue is identifying the ways in which risk reduction can be achieved. This might be through different policy instruments (regulatory, market-based, etc), different control technologies (activated carbon, aeration, etc), or different points of abstraction of water. This decision step is not of interest in the assessment framework as it is a risk management and/or policy issue.
· Step 3: Specify the attributes. While there are many attributes significant in risk management decisions (health risk, technological feasibility, cost, etc), the current report focuses only on attributes of human health risk. These are semi-quantitative summary measures of (i) the probability of effect and (ii) the severity of effect, whose combination—along with size of exposed population—provides a semi-quantitative measure of public health impact (individual or population risk, depending on whether size of exposed population is included) which may then be related to DALYs (this paper uses DALYs, but the methodology is not restricted to that metric).
· Step 4: Specify the metrics. Probability of effect is taken here to be number of cases per million exposed population over a defined period; here, that period is an 80 year lifetime (the current mean value in the US, Japan and EU, the target nations for the framework developed here). This probability reflects multiplicity of effect in the case of morbidity by drawing no distinction between X people each showing one case of the effect during a lifetime, and one person showing X cases of the effect during a lifetime. Severity of effect may reflect both the impact of the effect on quality of life (morbidity) and the age-at-mortality. As with probability, it will be a semi-quantitative metric proportional to DALY values.
· Step 5: Specify the weightings. Here, the problem is to assign weights to the different Attributes considered. Since the framework used in the present report produces a summary measure of risk as probability times severity, the weightings are already included in the development of the severity metric from Step 4, which as mentioned are developed from the weightings used in DALYs (described later).
· Step 6: Specify the algorithm. The algorithm in the case of the current paper is the calculation of a summary measure of risk for each agent and for all agents combined. For each agent, the algorithm is:
Individual Risk = Probability × Severity(1)
…in whatever way Probability and Severity are defined and quantified in Step 4. These values are calculated for each individual risk agent. As described later, Severity is given semi-quantitative values through DALYs.
Further, Probability is taken to be the product of two terms:
Probability = Exposure × Toxicity(2)
…in which Exposure refers to the biologically relevant summary of concentration in water (daily average, monthly average, peak concentration, etc depending on the particular effect being considered), and Toxicity is summarized by a threshold for effect, benchmark dose, slope factor, etc. (units of probability of effect per unit exposure).
The metric of cumulative public health impact is the Weighted Total DALY value across the population:
Weighted Total DALY
= Mean Individual DALY × Population(3)
…where Population is the size of the population exposed to a particular water supply under consideration and the right hand side is summed first over categories of risk agents (in the event risk management is chosen to focus on specific classes of agents) and then over all risk agents combined.
· Step 7: Assess the options. Here, the problem is using the Metrics in Step 4 and the Algorithm in Step 6 to characterize the cumulative risk from a water supply under each of the proposed options for risk management. The present paper focuses on the cumulative risk assessment component only, and not on other issues such as technological feasibility and cost that would usually be included in options assessment.
· Steps 8 and 9: Rank the options and select an optimal option. These steps are associated with risk management decisions, not risk assessment, and so are not considered further in this paper. They are, however, informed by the results of Step 7 (in addition to other considerations of risk management). The current paper considers only risk in developing this ranking across water supplies.
3.1. The Axes of a Matrix of Cumulative Risk Methods
The challenges of cumulative risk assessment lie primarily in Steps 3 through 6 above, and so resolving these challenges forms the starting point for the framework developed here. These challenges may be sorted in three dimensions: the first being how cumulative risk assessment is rooted in the rights-based or cost-benefit traditions of regulation and rational decisions (which in turn affects treatment of uncertainty and inter-subject variability); the second being how risks from different agents are combined in developing a summary measure of risk; and the third being how metrics are developed during the assessment process.
3.1.1. Philosophical Bases and Treatment of Uncertainty
Uncertainty and inter-subject variability have been dealt with in multiple and diverse ways within risk assessment and risk management [7,8,37-42]. These differences in treatment may be traced back to two traditions of riskbased decisions in protection of public health:
· A tradition rooted in individual rights, where each individual is afforded “adequate” protection against “unreasonable” risks. This tradition has led to exposure limits that produce a level of risk below some “unacceptable” level, even in the more sensitive and susceptible members of the public, without reference to a representative or average risk in the population. The interpretation of “adequate protection” in the face of uncertainty and variability has led to procedures of margins of safety, identification of sensitive subpopulations, and specification of “worst case” scenarios of exposure. The decision criterion is to produce an estimate of risk that, if incorrect, is more likely to overstate than understate that risk, even in the more sensitive and susceptible subpopulations potentially exposed under realistic worst case scenarios. In the framework presented here, this tradition is reflected in individual risk calculations.
· A tradition rooted in cost-benefit analysis and utilitarianism, where the purpose of expenditure on protection of public health is to allocate limited resources most cost-effectively across competing uses of those resources. This tradition has led to exposure limits that produce a target improvement in public health (usually stated in terms of reduction in number of cases of an effect) at a “reasonable” cost, recognising that these same resources could have been used to improve public health in other ways. It has led to procedures aimed at providing best estimates of the mean risk in an exposed population, from which the number of cases of effect averted through a risk management option can be calculated and compared against the costs of implementation. In the framework presented here, this tradition is reflected through population risk calculations.
In developing a methodology for the Contaminant Candidate List (CCL), the National Drinking Water Advisory Committee identified a problem associated with the use of regulatory constructs such as RfDs in establishing relative levels of risk from different agents for use in cumulative risk assessment. A proposal had been explored to use the ratio of actual exposure in water over the Reference Dose (RfD) as the metric of probability of effect in at least a screening process for new entrants into the CCL, mirroring the policy concepts of margin of exposure or precaution designed to address issues of uncertainty in establishing regulatory limits.
The problem with the proposal is that risk agents with the largest uncertainty built into the RfD would tend to have the highest value of the ratio mentioned, all other things being equal. If one interprets a large uncertainty factor as meaning there is greater speculative nature in claims about risks, such a procedure would raise to highest attention within cumulative risk assessment those agents whose risks are the most speculative. All other things being equal, a risk agent with a lot of data, for which it could be said with high confidence that effects appear at exposures above some identified limit, would have the higher RfD and hence the smaller ratio mentioned above. Perversely, this risk agent, for which the appearance of adverse effects is not as speculative, would be pushed down the ranking and have a reduced influence in cumulative risk calculations compared to compounds where the appearance of effects is more speculative.
This suggests the RfD should not be used as a metric of Toxicity, but rather be replaced by a benchmark exposure or dose. There is, however, another interpretation of the RfD and application of uncertainty factors. In this interpretation (which is implicit in the formal definition of uncertainty factors and their role in the RfD), the RfDs for different risk agents are defined as the levels of exposure producing roughly the same confidence that public health is being protected against unacceptably high levels of effect in the face of uncertainty. If that interpretation is applied, then use of an RfD as the metric of Toxicity for non-carcinogens is appropriate in cumulative risk assessment, since all RfDs reflect the same qualitative level of confidence in public health protection. The problem with this approach is that it conflates the concept of probability/severity of effect with confidence that an adequate margin of safety has been applied, and would lead to cumulative risk assessments in which it is not risk, but rather some rather vaguely defined measure of confidence in the face of uncertainty, that is being summed across agents. RfDs are not employed as direct measures of probability in the framework developed here for precisely this reason, for either individual risk (rightsbased) or population risk (cost-benefit based) calculations.
3.1.2. Commensurability of Risks
In the second dimension, consider whether all risk agents must be placed into a common system of assessment, or whether they might be divided into categories based on availability of data. Common assessment is possible only if the risks are in some sense commensurable. For example, imagine a case in which for all risk agents, one can assign at least a semi-quantitative measure of Exposure and Toxicity, resulting in a semi-quantitative measure of Probability (see Equation (2)), and at least a semi-quantitative measure of Severity. In that case, a semi-quantitative measure of risk (Equation (1)) can be assigned to each risk agent, these measures can be summed, and a cumulative risk calculation performed that allows for comparisons of the relative effectiveness of different risk reduction strategies.
By contrast, imagine a case in which either incommensurability of risk or data limitations makes it infeasible to develop a single, all-encompassing, metric of risk for all agents. In this case, agents are classified or categorized, and cumulative risk calculated within a category, but no attempt is made to further aggregate the risks across different categories. This might be a case where 1) carcinogens represent one category and non-carcinogens another; 2) the mechanisms of toxicity (e.g. acetyl cholinesterase inhibition) are determined for some classes of non-carcinogenic agents, and cumulative risk determined across a category with the same mechanism of toxicity but not across the separate categories with different mechanisms; and 3) “other” non-carcinogenic agents are treated through a separate process. In the case of 2), these categories are Common Mechanism Groups (CMGs) in the EPA parlance when all agents acting by that mechanism are examined, and Cumulative Assessment Groups (CAGs) when focus is directed only to those CMG members that are considered to be significant contributors to risk. The cumulative risk for 2) is calculated through dose additivity, where a single dose-response relationship is developed for the Group to produce a composite Toxicity metric in Equation (2), and the metric of Exposure is the level of Exposure corrected for interagent differences in dosimetry. The result is generally summarised as a Relative Potency Factor (RPF), expressed as the probability of effect per unit exposure, relative to a defining member of the CAG. This is analogous to the Toxicity Equivalence Factor mentioned previously.
The primary problem with separating agents into categories due to concerns over incommensurability is that it can fall short of the policy interpretation of cumulative risk [43]: “…an assessment that covers a number of chemicals or other stressors but that merely lists each chemical with a corresponding risk without consideration of the other chemicals present is not an assessment of cumulative risk…”. However, this does not completely invalidate such separation into categories, as risks may indeed be incommensurable, and the existing science may be incapable of supporting any more elaborate modelling of the interactions between risk agents. The framework developed here resolves this issue by generating commensurability through application of DALYs.
3.1.3. Degree of Expert Judgment
The third dimension considers whether the metrics of risk for agents are 1) fully quantitative and rooted in biologically based models parameterized through statistical data analysis, as well as having a mathematical expression for Severity such as QALYs or DALYs; 2) the result of subjective (albeit expert) judgments of the Exposure, Toxicity and/or Severity; or 3) intermediate between these positions. The advantage of 1) is the scientific rigor and data-driven nature of the cumulative risk estimate. It can be based on either dose additivity or effect additivity or both, as well as being applicable to both aggregate and cumulative risk assessment. Examples are the treatment of organophosphates, disinfection by-products or mixtures of carcinogens. The disadvantage of 1) is a significant requirement for data and the need to demonstrate that there is a single dominant pathway to effect, which has been feasible to date for only a few mixtures.
The advantage of 2) is the ability to proceed with the assessment under all conditions where at least minimal data are available, or where experience can be drawn on to form judgments. The disadvantages are that it requires expert judgment, raising all of the issues of expert elicitation including stakeholder membership of the elicitation group, and it cannot be used to compare risks across sources or agents that have not passed through the identical process of elicitation.
The current framework sits between these two options. It uses a semi-quantitative method of assessment that draws on quantitative metrics of probability and severity in providing for relative values of human health risk that can be summed across agents, either within categories (for targeted risk management decisions) or across categories. As will be seen, expert judgment enters to some degree in defining the weightings for effects, but before and after that point in the assessment process the approach is more aligned with option 1) above.
4. The Framework of Cumulative Risk Assessment
In developing the cumulative risk framework, it was determined that there might be three levels of detail assessors could provide as to severity of effect:
· A purely subjective and otherwise unstructured score (high, medium or low) based on expert elicitation. This has been ruled out here because its qualitative nature provides no substantive way to produce a summary estimate of cumulative risk, either in the relative or absolute sense when comparing risk mitigation options.
· A subjective but structured and semi-quantitative score (0 to 10). Here, the definitions might be (as discussed in the CCL deliberations mentioned previously):
No discernible effect on quality of life;
Mild discomfort;
Some discomfort, with reduced ability to work;
Requirement of a visit to a doctor for treatment;
Requirement of hospitalization;
Premature death.
This approach to scoring severity can provide a semiquantitative result for cumulative risk if each category is assigned a weight. However, the approach provides an ordinal ranking of risk for individual agents. Unless the weights assigned to a category of effect are in some sense proportional to public health impact, the summary measure of risk across all agents in a water source may not provide a correct ordinal ranking in regard to cumulative risk across different water sources. This problem can be alleviated by making the weights proportional to some notion of “degree of concern” by the evaluator, but concern and public health impact are not taken here to be the same basis for regulation and risk management. Since the intent of the framework is to provide both relative measures of cumulative risk across sources of water, and a correct ordinal ranking of those risks, this second approach is similarly rejected.
· A quantitative severity score based on DALYs. The severity score used here is equal to the decrease in “high quality” years of life lost as a result of a given effect. To calculate Severity, a disability weighting value is multiplied by the number of years the effect is in place for an individual. Here we adopt the disability weightings of the World Health Organisation used in their Global Burden of Disease (www.who.int /healthinfo/global_burden_disease/metrics_daly/en). While DALY weightings can be a function of age, this weighting is not applied here because the use of Average Daily Rate of Intake over a lifetime as the measure of exposure does not allow for differentiation of morbidity effect by age (mortality is accounted for in the DALY calculation through explicit consideration of years of life lost due to fatal illness).
A difficulty that arises with the use of DALYs is that the critical effects cited by regulatory bodies such as the USEPA (in their IRIS database) usually are not identical to WHO categories of effect. In fact, the IRIS critical effects often are not adverse effects at all in the clinical sense. They are indicators of, or precursors to, actual adverse effects. To resolve this issue, a “mapping” of the critical effects in IRIS against the specific diseases identified in the WHO weightings was performed. In each case, the critical effect of IRIS was assigned a role as an indicator of a particular disease outcome based on the causal disease chain that best matched the critical effect measured and cited in IRIS. For each such critical effect, the most adverse disease for which that effect best corresponded was selected from the WHO categories, and that weighting factor used in framework. Results of this process for 50 compounds that might be found in a hypothetical water supply can be seen in Table 2. These compounds will also form the basis of the demonstration of the framework in later sections.
The Toxicity measure for non-cancer effects is established from the equivalent of a Benchmark Dose or Concentration, using the RfD from Table 2 for the 50 compounds considered in this study. Units for the RfD are mg/kg-day. Under this interpretation, inclusion of Uncertainty Factors in a calculation of the RfD results in a margin of safety with two components: uncertainty and inter-subject variation. If the former are removed from the RfD, the result is related approximately to a Benchmark Dose 1% (BMD-1%), or the dose at which 1% of the population might develop the effect as a result of exposures at the RfD. This framework uses exposureresponse relationships for non-cancer effects that are represented by the class of distributed threshold models, which posit differential sensitivity to a compound throughout an exposed population, and hence yield estimates of the fraction of this exposed population developing the adverse effect as a function of exposure [8].
Dourson et al. [37] have reviewed the issue of quantitative application of safety or uncertainty factors in probabilistic risk assessment. Their analysis of an array of regulatory standards based on such applications suggests that the inter-subject variability component of uncertainty factors (the only component retained in the present framework) produces a risk estimate that is near the upper end of the tail of the distribution for an exposed population, but not many orders of magnitude away from the mean estimate. This suggests such an application provides an estimate that is somewhere between the 90th and 99th percentile. The 99th percentile assumption is used here, with therefore 1% of the population developing the effect at a level of exposure equal to the “corrected RfD” discussed below (i.e. the RfD without inclusion of uncertainty factors related more correctly to inter-subject variability than to uncertainty).
The calculation of Toxicity assumes an intake rate of 2 L/day for drinking water and a body mass of 50 kg, following common regulatory practice. This is reflected in the Assumed Water Concentrations in Table 1. As a result, the Toxicity measure for non-cancer effects in Equation (2) is:
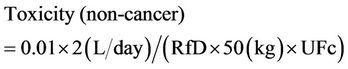 (4)
(4)
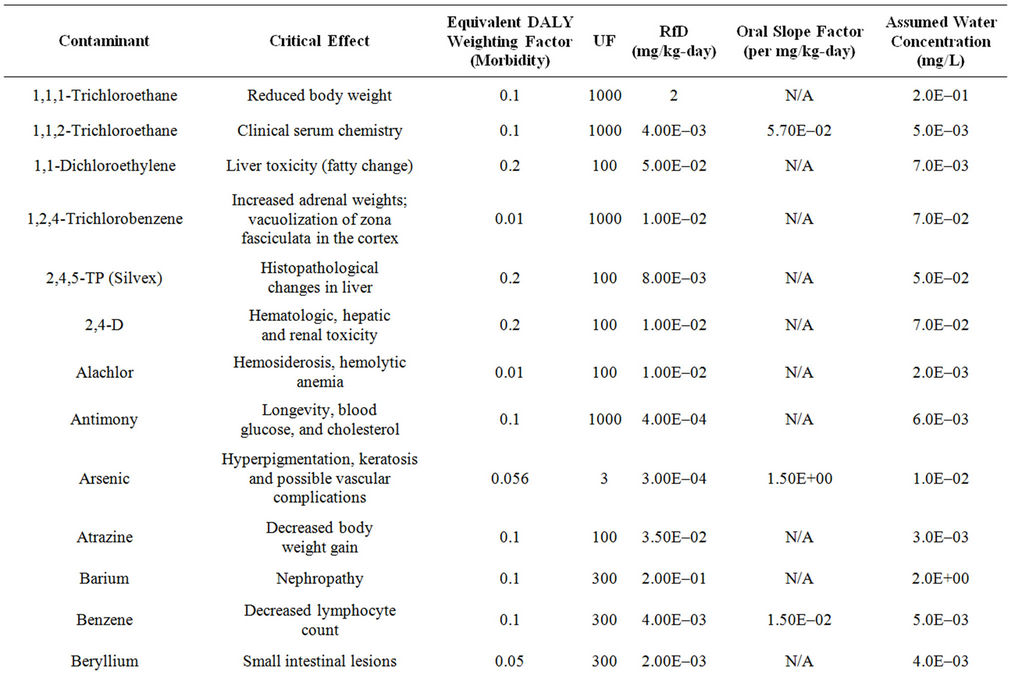
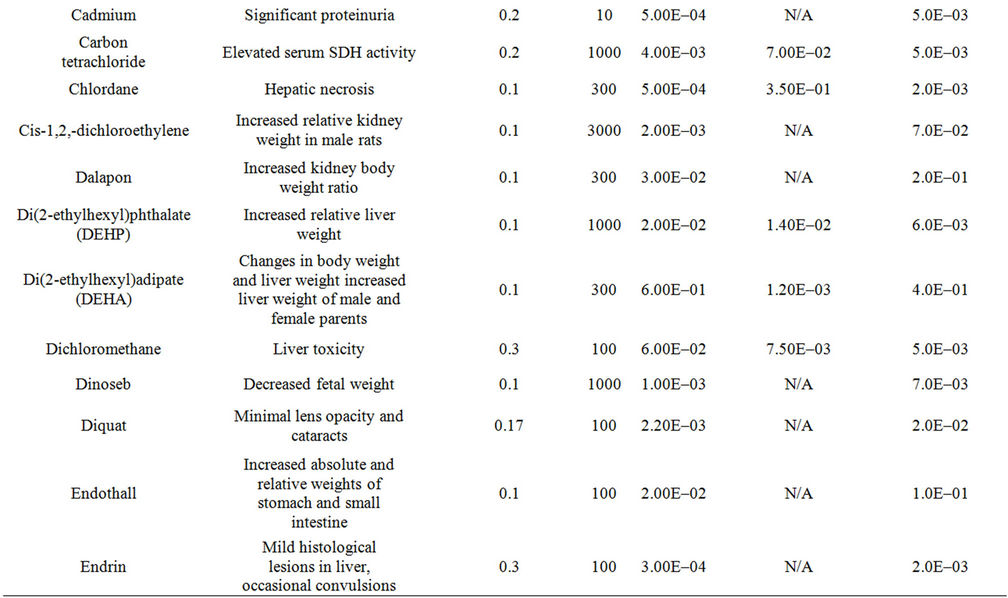
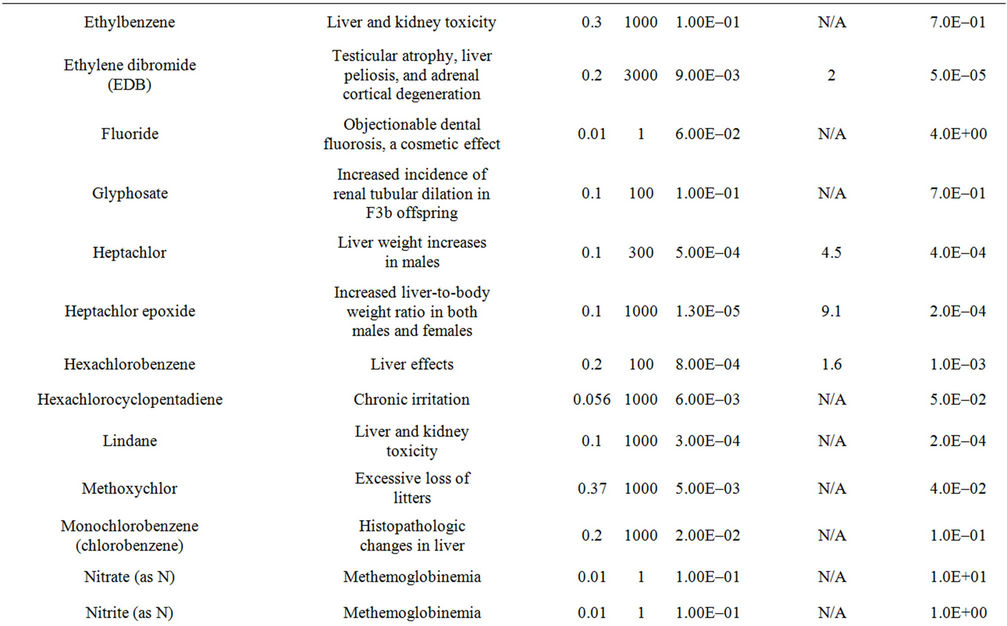
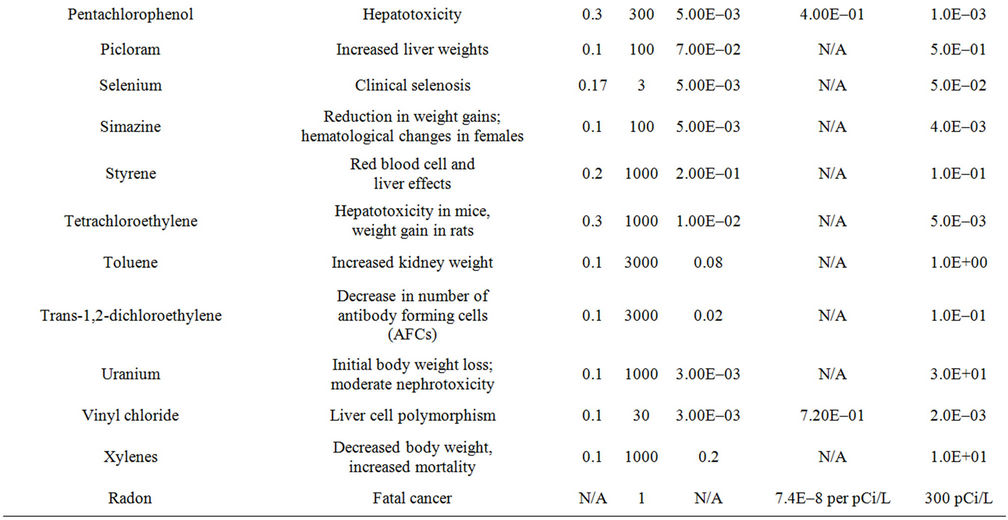
Table 2. Summary of the critical effects assumed for each of 50 example compounds, based on the IRIS database of the USEPA, the DALY weighting factor for the most severe and relevant equivalent effect in the WHO disease categories, information on toxicity (from the IRIS database), and the assumed concentration in drinking water.
...where 0.01 is the conversion for percentage (1%) to fraction (0.01) as defining the BMD-1% and UFc is the combined Uncertainty Factors used in calculating the RfD, not including any UF for intra-species variability (since that component of the UF is related to the assumption of a distributed threshold model of exposure-response). Note that the units of Toxicity are then L/mg, which is the inverse of mg/L, the concentration of the compound in water. Toxicity is therefore a measure of the proportion of the population showing the adverse effect per unit concentration.
The same interpretation of Toxicity for carcinogens is applied. In this instance, the Toxicity is calculated from the Cancer Slope Factor (Oral Slope Factor of Table 2) as follows:
Toxicity (cancer) = CSF × 2 (L/day)/50 (kg)(5)
...where the units of CSF are inverse mg/kg-day. Note that the units of Toxicity (cancer) are then inverse concentration in water, and so are identical to those for non-cancer effects in Equation (4).
In regard to Exposure (see Equation (2)), a significant challenge arises in defining the appropriate measure of concentration in water supplies that invariably have complex temporal profiles of concentration for a given compound. Health effects are functions of both the total dose of a compound delivered to critical organs and tissues, and the rate at which that dose is delivered. Two temporal profiles, each delivering the same lifetime dose, and hence each characterised by the same average daily rate of intake, can have different probabilities of effect. This is true for both non-cancer and cancer effects from Equations (4) and (5).
The advantage of the biologically-based models of effect, when linked to a life-table approach to risk estimation, is that they can account for such temporal patterns. This introduces significant complexity into a cumulative risk assessment, however, especially one that is semiquantitative as in the present paper. Some of the problem is removed by the use of a non-threshold model in the current framework for both cancer and non-cancer effects, as is implicit in Equations (4) and (5), and by the fact that the disability weights used in calculating Severity is similarly lifetime average (rather than a function of age). In this framework, therefore, the measure of exposure is taken to be time-weighted lifetime averaged concentration (mg/L).
In summary, the framework performs the following steps of analysis:
· A time-weighted lifetime average concentration of each compound in water is calculated based on monitoring data. This is the measure of Exposure used in Equation (2).
· A Toxicity measure for Equation (2) is calculated for non-cancer and cancer effects separately using Equations (4) and (5), respectively, based on RfDs and Cancer Slope Factors, corrected for inclusion of Uncertainty Factors to reduce both Toxicity Measures to a Benchmark Dose, and equivalent slope between zero exposure and the BMD.
· The Toxicity and Exposure measures for a given compound are multiplied in Equation (2) to produce a measure of Lifetime Probability of Effect (or more strictly given the current interpretation of effect in this framework, a fraction of individuals showing the effect).
· Where a Toxicity Equivalence Factor approach is available for a class of compounds, the same process is used except the Toxicity measure is that of the reference compound, and the Exposure measure for each compound is the actual Exposure measure times the TEF. Otherwise, the framework is independent of whether a compound is or is not in a class of toxicologically similar compounds.
· For the calculation of Individual Risk, Equation (1) uses the results of the previous steps to calculate Probability of effect. For non-fatal effects, this Probability is multiplied by the DALY weighting (taken from Table 1 for the example used in this paper) and by the length of life over which the effect is assumed to occur (set at a lifetime of 80 years in the present example) to calculate Risk. For fatal effects (taken here to be cancer), the assumed years of life lost is 80 years minus the mean age-at-death for the particular cancer. The years of life lost is taken from a compilation by National Cancer Institute [44], which shows values of between 15 and 25 years depending on cancer type. An average of 20 years per case is assumed in the current framework, although this can be adjusted as desired by the analyst.
· The relative values of Risk for any two compounds are given by the relative values of the results from Equation (1). The measure of Risk here is therefore years of “high quality” life lost through exposure over an 80 year baseline lifetime, which is equivalent to the Mean Individual DALY.
· This calculation of Risk for each individual compound is summed over all compounds to obtain the Weighted Total DALY or Cumulative Individual Risk from the water supply examined.
· Finally, this Mean Individual DALY is multiplied by the size of the exposed population to obtain Population Cumulative Risk, which is also equal to the Weighted Total DALY value of Equation (3). The relative population risk of two water supplies is given by the relative values of these Population Cumulative Risk or Weighted Total DALY values. In Section 5, Population is not considered since this is an example application.
5. An Example Application
We consider here a hypothetical example of the application of the framework to a water supply. The concentrations of 50 compounds are considered, each present at their respective values in Table 2, which is the value corresponding to their respective MCLs (i.e. this water supply is at the border between acceptability and not, in the regulatory sense in the US, for every compound). For radon, a proposed limit of 300 pCi/L is assumed.
Figure 2 displays results with all concentrations in the water supply set at the current MCLs.
Figure 2 uses the existing MCLs. For some compounds, there is not currently a cancer-based MCL, but the oral slope factor does exist in Table 2. If the MCL were to be calculated for such compounds, this MCL might be lower than that under non-cancer effects only. In Figure 3, Total Weighted DALY is calculated using 1) the current MCL (blue bars), 2) the MCL that would be in place if all compounds with an oral slope factor were set at an MCL value to produce a lifetime excess probability of cancer equal to 1E–5 (red bars), in cases where this new MCL would be more restrictive than the existing MCL (otherwise, the MCL is left at the existing value), and 3) the same as in 2), but with the target lifetime excess probability of cancer set at 1E–4 rather than 1E–5 (yellow bars).
Figure 4 displays the information on Total Weighted DALY as a Cumulative Distribution Function (CDF) for the case of the existing MCLs only. Note the sharp increases at only a few locations within the CDF, indicating compounds contributing most significantly to the Total Weighted DALY.
6. Conclusions
The framework developed here allows for semi-quantitative estimation of cumulative risk from water supplies in a defined population. By placing all compounds onto the unifying metric of Disability Adjusted Life Years (DALYs), and harmonizing cancer and non-cancer, morbidity and mortality, effects, a single measure for the relative risks of different supplies is developed. The framework can be used to:
· Calculate a measure of cumulative risk for a given supply, and compare this measure across supplies or across the same supply with candidate treatments applied.
· Identify those compounds contributing most significantly to cumulative risk, so risk management measures can be applied most effectively.
· Quantify the influence of different regulatory limits, for specific compounds, on the cumulative risk from drinking water.
As can be seen especially clearly in Figure 4, the cumulative risk for even a complex mixture such as the one used in this study may be dominated by a few compounds. In Figure 4, one notes perhaps 4 compounds contributing quite significantly to cumulative risk, defined by Total Weighted DALY.
There remain some significant issues with the proposed system of assessment, which are summarized here as caveats.
· The system is semi-quantitative rather than fully quantitative, even though it produces numerical results of DALYs. This arises from the application of DALY Weighting Factors for morbidity effects, factors that are inherently subjective.
· The system has an underlying assumption of linearity in exposure-response curves for both non-cancer and cancer effects, applied to a Point of Departure interpreted as BMD-1% for the morbidity effects (based on a distributed threshold model and a probabilistic interpretation of inter-subject variability within Uncertainty Factors applied in developing RfDs and MCLs). No such interpretation is required for cancer effects, as these are treated probabilistically.
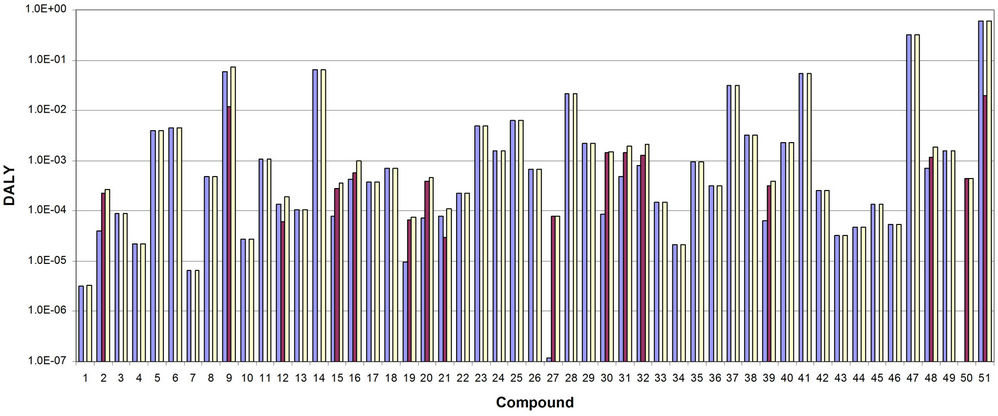
Figure 2. DALY values for 1) morbidity (blue bars), 2) cancer mortality (red bars) and 3) total (yellow bars), by compound. Compounds are given by the reference numbers in Table 2. Compound 51 is the total weighted DALY across all compounds in the assumed water supply.
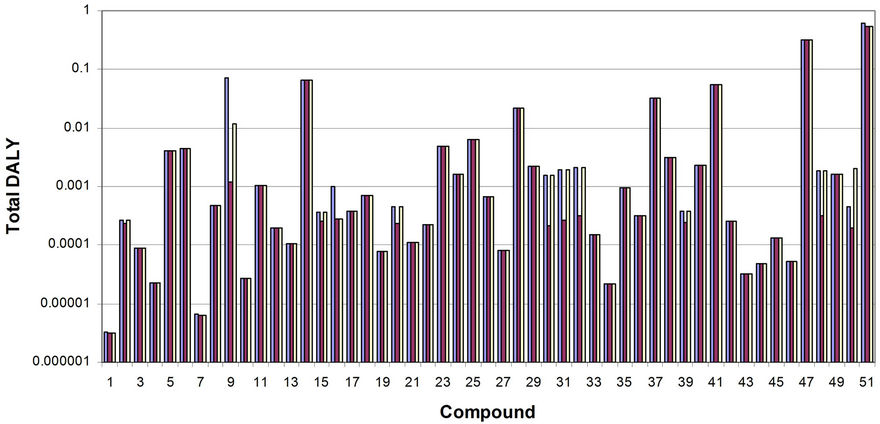
Figure 3. Total weighted DALY values for all compounds combined for the cases of 1) existing MCLs (blue bars), 2) MCLs set at the existing value or the one calculated if oral slope factors are used with a target lifetime excess probability of cancer equal to 1E–5, whichever is more restrictive (red bars) and 3) MCLs set at the existing value or the one calculated if oral slope factors are used with a target lifetime excess probability of cancer equal to 1E–4, whichever is more restrictive (yellow bars). Compounds are given by the reference numbers in Table 1. Compound 51 is the total weighted DALY across all compounds in the assumed water supply.
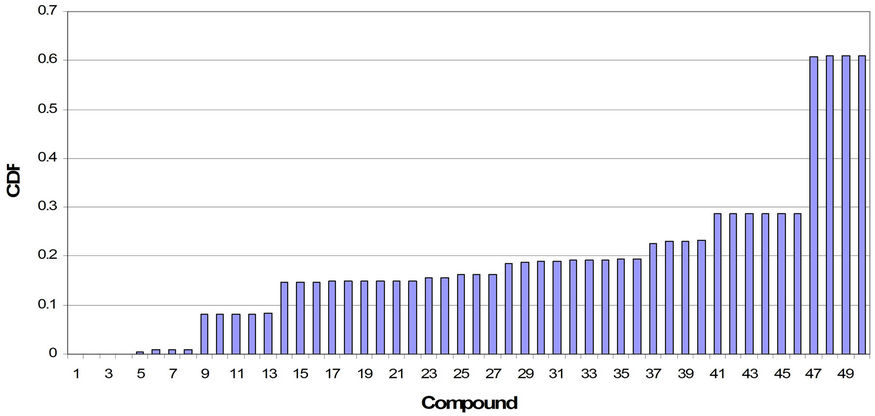
Figure 4. Cumulative Distribution Function (CDF) for total weighted DALY corresponding to the case of using current MCLs as the level of exposure. Points of discontinuity show which compounds contribute most significantly to the cumulative risk of the hypothetical water supply.
· The system does not include synergistic or antagonistic effects. Doing so would required use of biologically based dose-response models for a complex mixture, and it is not felt that these are currently sufficiently robust or reliable to be of routine use here. However, the NexGen program of the USEPA may produce methods to address this limitation.
Finally, Figure 3 shows that establishing MCLs based on compounds for which there is an oral slope factor, but where no cancer-based limit has yet been established, probably will have little influence on the relative cumulative risk of different water supplies. This at first appears counter-intuitive, since when all causes of disease are considered, cancer and non-cancer effects at a national level usually are roughly equivalent in magnitude. The current study shows that this pattern in not fully repeated in the case of water-borne risk, where Total Weighted DALY is dominated by non-cancer effects, with up to 80% of the DALY being from these effects. In addition, in the cases where an MCL could be established based on either non-cancer or cancer effects, the noncancer-based MCL is usually more restrictive than the one based on cancer for target probabilities of cancer equal to 1E–4 or 1E–5.
7. Acknowledgements
The authors acknowledge the support of the Water Research Foundation under Project Agreement 4310, and the Jacobs Engineering Group as project lead, in carrying out the research reported here.
REFERENCES
- R. Bullard, “Dumping in Dixie: Race, Class, and Environmental Quality,” Westview Press, Boulder, 1990.
- GAO (US General Accounting Office), “Siting of Hazardous Waste Landfills and Their Correlation with Racial and Economic Status of Surrounding Communities,” Washington DC, 1983, GAO/RCED 83-168.
- B. Israel, “An Environmental Justice Critique of Risk Assessment,” University Environmental Law Journal, Vol. 3, No. 1, 1995, pp. 469-522.
- K. Sexton and S. Linder, “The Role of Cumulative Risk Assessment in Decisions about Environmental Justice,” International Journal of Environmental Research and Public Health, Vol. 7, No. 11, 2010, pp. 4037-4049. doi:10.3390/ijerph7114037
- V. Zartarian and B. Schultz, “The EPA’s Human Exposure Research Program for Assessing Cumulative Risk in Communities,” Journal of Experimental Science and Environmental Epidemiology, Vol. 20, 2010, pp. 351-358.
- R. Hertzberg and M. MacDonell, “Synergy and Other Ineffective Mixture Risk Definitions,” The Science of the Total Environment, Vol. 288, No. 1-2, 2002, pp. 31-42. doi:10.1016/S0048-9697(01)01113-5
- National Research Council, “Science and Decisions: Advancing Risk Assessment,” National Academy Press, Washington DC, 2009.
- D. Crawford-Brown, “Risk-Based Environmental Decisions: Methods and Culture,” Kluwer Academic Publishers, Dordrecht, 1999.
- M. Callahan and K. Sexton, “If Cumulative Risk Assessment Is the Answer, What Is the Question?” Environmental Health Perspectives, Vol. 115, 2007, pp. 799-806. doi:10.1289/ehp.9330
- US Environmental Protection Agency, “Thiocarbamates: A Screening Level Cumulative Dietary (Food) Risk Assessment,” Office of Pesticide Programs, Office of Prevention, Pesticides, and Toxic Substances, Washington DC, 2001.
- US Environmental Protection Agency, “The Grouping of a Series of Dithiocarbamate Pesticides Based on a Common Mechanism of Toxicity,” Office of Pesticide Programs, Office of Prevention, Pesticides, and Toxic Substances, Washington DC, 17 August 2001.
- J. Graham and J. Hammitt, “Refining the CRA Framework, in Comparing Environmental Risks: Tools for Setting Government Priorities,” In: J. C. Davies, Ed., Resources for the Future, Washington DC, 1996, pp. 93-109.
- US Environmental Protection Agency, “Guidance for Identifying Pesticide Chemicals and Other Substances that Have a Common Mechanism of Toxicity;” Office of Pesticide Programs, Office of Prevention, Pesticides, and Toxic Substances, Washington DC, 29 January 1999.
- US Environmental Protection Agency, “Guidance for Performing Aggregate Exposure and Risk Assessments,” Office of Pesticide Programs, Office of Prevention, Pesticides, and Toxic Substances, Washington DC, 29 October 1999, 64 FR 61343.
- US Environmental Protection Agency, “The Office of Pesticide Programs’ Policy on Determination of the Appropriate FQPA Safety Factor(s) for Use in the Tolerance-Setting Process,” Office of Pesticide Programs, Office of Prevention, Pesticides, and Toxic Substances, Washington DC, 10 May 1999.
- US Environmental Protection Agency, “Consideration of the FQPA Safety Factor and Other Uncertainty Factors in Cumulative Risk Assessment of Chemicals Sharing a Common Mechanism of Toxicity,” Office of Pesticide Programs, Office of Prevention, Pesticides, and Toxic Substances, Washington DC, 2001.
- US Environmental Protection Agency, “The Grouping of a Series of Chloroacetanilide Pesticides Based on a Common Mechanism of Toxicity,” Office of Pesticide Programs, Office of Prevention, Pesticides, and Toxic Substances, Washington DC, 7 June 2001.
- US Environmental Protection Agency, “Thiocarbamates: A Determination of the Existence of a Common Mechanism of Toxicity and a Screening Level Cumulative Dietary (Food) Risk Assessment,” Office of Pesticide Programs, Office of Prevention, Pesticides, and Toxic Substances, Washington DC, 2001.
- US Environmental Protection Agency, “Preliminary Cumulative Hazard and Dose Response Assessment for Organophosphorus Pesticides: Determination of Relative Potency and Points of Departure for Cholinesterase Inhibition,” Office of Pesticide Programs, Office of Prevention, Pesticides and Toxic Substances, Washington DC, 31 July 2001.
- US Environmental Protection Agency, “End Point Selection and Determination of Relative Potency in Cumulative Hazard Assessment: A Pilot Study of Organophosphorus Pesticide Chemicals;” FIFRA Scientific Advisory Panel Meeting, 27 September 2000, SAP Report 2000- 0X.
- US Environmental Protection Agency, “Case Study of the Cumulative Risk of 24 Organophosphate Pesticides; Cumulative Risk Assessment Method for Dietary Food Exposure; Cumulative Risk Assessment for Residential Exposure; Cumulative Risk Assessment for Drinking Water; Integrated Cumulative Risk Assessment,” Session II of the FIFRA Scientific Advisory Panel Meeting, 7-8 December 2000, SAP Report 2001-06.
- US Environmental Protection Agency, “Organophosphate Pesticides: Preliminary OP Cumulative Risk Assessment,” Office of Pesticide Programs, Office of Prevention, Pesticides and Toxic Substances, Washington DC, 3 December 2001.
- US Environmental Protection Agency, “Preliminary Cumulative Hazard and Dose Response Assessment for Organophosphorus Pesticides: Determination of Relative Potency and Points of Departure for Cholinesterase Inhibition,” FIFRA Scientific Advisory Panel Meeting, Washington DC, 5-6 September 2001.
- US Environmental Protection Agency, “Guidance on Cumulative Risk Assessment of Pesticide Chemicals that Have a Common Mechanism of Toxicity,” Office of Pesticide Programs, Office of Prevention, Pesticides, and Toxic Substances, Washington DC, 14 January 2002, 67 FR 2210.
- S. Baird, J. Cohen, J. Graham, A. Shlyakhter and J. Evans, “Noncancer Risk Assessment: A Probabilistic Alternative to Current Practice,” Human and Ecological Risk Assessment, Vol. 2, No. 1, 1996, pp. 78-99. doi:10.1080/10807039.1996.10387463
- D. Barnes and M. Dourson, “Reference Dose (RfD): Description and Use in Health Risk Assessment,” Regulatory Toxicology and Pharmacology, Vol. 8, No. 4, 1988, pp. 471-486. doi:10.1016/0273-2300(88)90047-5
- V. Cogliano, “Plausible Upper Bounds: Are Their Sums Plausible?” Risk Analysis, Vol. 17, No. 1, 1997, pp. 77-84. doi:10.1111/j.1539-6924.1997.tb00845.x
- D. Barnes, A. Alford-Stevens, L. Birnbaum, F. Kutz, W. Wood and D. Patton, “Toxic Equivalency Factors for PCBs?” Quality Assurance, Vol. 1, 1991, pp. 70-81.
- N. Bouwes and S. Hassur, “OPPT’s Risk-Screening Environmental Indicators: Toxic Weights for Toxic Release Inventory (TRI) Chemicals and Chemical Categories,” Office of Pollution Prevention and Toxic Substances, Office of Prevention, Pesticides, and Toxic Substances, US Environmental Protection Agency, Washington DC, 28 April 1998.
- G. Eadon, L. Kaminsky, J. Silkworth, et al., “Calculation of 2,3,7,8-TCDD Equivalent Concentrations of Complex Environmental Contaminant Mixtures,” Environmental Health Perspectives, Vol. 70, 1986, pp. 221-227. doi:10.1289/ehp.8670221
- M. van den Berg, L. Birnbaum, A. Bosveld, et al., “Toxic Equivalency Factors (TEFs) for PCBs, PCDDs, PCDFs for Humans and Wildlife,” Environmental Health Perspectives, Vol. 106, 1998, pp. 775-792. doi:10.1289/ehp.98106775
- J. Flippin, J. Hedge, M. Devito, G. Leblanc and K. Crofton, “Predictive Modeling of a Mixture of Thyroid Hormone Disrupting Chemicals that Affect Production and Clearance of Thyroxin,” International Journal of Toxicology, Vol. 28, No. 5, 2009, pp. 368-381. doi:10.1177/1091581809341883
- S. Moolgavkar, F. Cross, G. Luebeck and G. Dagle, “A Two-Mutation Model for Radon-Induced Lung Tumors in Rats,” Radiation Research, Vol. 121, No. 1, 1990, pp. 28- 37. doi:10.2307/3577560
- D. Crawford-Brown, “Mathematical Methods of Environmental Risk Modeling,” Kluwer Academic Publishers, Dordrecht, 2001.
- C. Murray, “Quantifying the Burden of Disease: The Technical Basis for Disability Adjusted Life Years,” Bulletin of the World Health Organization, Vol. 72, No. 3, 1994, pp. 429-445.
- G. Richardson and A. Manca, “Calculation of Quality Adjusted Life Years in the Published Literature: A Review of Methodology and Transparency,” Health Economics, Vol. 13, No. 12, 2004, pp. 1203-1210. doi:10.1002/hec.901
- M. Dourson, S. Felter and D. Robinson, “Evolution of Science-Based Uncertainty Factors in Non-Cancer Risk Assessment,” Regulatory Toxicology and Pharmacology, Vol. 24, No. 2, 1996, pp. 108-120. doi:10.1006/rtph.1996.0116
- D. Hattis and E. Anderson, “What Should Be the Implications of Uncertainty, Variability, and Inherent ‘Biases’/ ‘Conservatism’ for Risk Management Decision Making?” Risk Analysis, Vol. 19, No. 1, 1999, pp. 95-107. doi:10.1023/A:1006910428080
- D. Hattis and D. Burmaster, “Assessment of Variability and Uncertainty Distributions for Practical Risk Analyses,” Risk Analysis, Vol. 14, No. 5, 1994, pp. 713-730. doi:10.1111/j.1539-6924.1994.tb00282.x
- S. Lewis, “Reducing Uncertainty with Adjustment Factors: Improvements in Quantitative Non-Cancer Risk Assessment,” Fundamentals of Applied Toxicology, Vol. 20, 1993, pp. 2-4.
- M. Morgan, M. Granger and M. Henrion, “Uncertainty: A Guide to Dealing with Uncertainty in Quantitative Risk and Policy Analysis,” Cambridge University Press, New York, 1990.
- W. Slob and M. Pieters, “A Probabilistic Approach for Deriving Acceptable Human Intake Limits and Human Health Risks from Toxicological Studies: General Framework,” Risk Analysis, Vol. 18, No. 6, 1998, pp. 787-798. doi:10.1111/j.1539-6924.1998.tb01121.x
- US Environmental Protection Agency, “Framework for Cumulative Risk Assessment,” Washington DC, 2003, EPA/ 630/P-02/001F.
- National Cancer Institute (NCI), “Surveillance Epidemiology and End Results,” 2006. http://seer.cancer.gov/csr/1975_2006/results_merged/topic_year_lost.pdf