Smart Grid and Renewable Energy
Vol.08 No.12(2017), Article ID:81371,13 pages
10.4236/sgre.2017.812027
Wind Tunnel Validation of Double Multiple Streamtube Model for Vertical Axis Wind Turbine
Palanisamy Mohan Kumar1,2*, Sudhakar Rao Rashmitha1, Narasimalu Srikanth1, Teik-Cheng Lim2
1Energy Research Institute, Nanyang Technological University, Singapore City, Singapore
2School of Science and Technology, Singapore University of Social Sciences, Clementi, Singapore

Copyright © 2017 by authors and Scientific Research Publishing Inc.
This work is licensed under the Creative Commons Attribution International License (CC BY 4.0).
http://creativecommons.org/licenses/by/4.0/


Received: November 25, 2017; Accepted: December 25, 2017; Published: December 28, 2017
ABSTRACT
The performance and annual energy output have to be predicted to maximize the economic benefits from a wind turbine. Mathematically predicting the performance of Darrieus type lift based turbines are challenging due to the inconsistent angle of attack, blade wake interaction and local induced velocities giving rise to complex flow physics. A reliable and validated mathematical model is therefore essential to optimize the various design parameters prior to manufacture. The objective of the current study is to evaluate widely employed aerodynamic models based on their prediction accuracy, limitations, and computational requirements. Double multiple stream tube models have been discussed in detail and the predictions are experimentally validated through the wind tunnel test of three-bladed H-Darrieus rotor in terms of torque and power coefficient. The possible sources for the deviation between the predicted and measured values have been discussed and concluded with potential solutions.
Keywords:
Aerodynamic Model, Wind Turbine, Double Multiple Stream Tube, Xfoil, Analytical

1. Introduction
The wind power continued to be the major source of renewable energy and a potential alternative for the fossil fuels from the ecological perspective. Decentralized power generation has seen significant growth from the smart grid context, and the small wind turbines become an indispensable part of it. Of several wind turbines designs, Darrieus type lift based turbines hold a prominent place for its unmatched advantages such as simple design, low noise and Omni directionality. Extensive research has been carried in the past in an effort to optimize these turbines for the urban environment and highly turbulent flows [1] . Significant success has been achieved in addressing the critical issues such as self-starting that is limiting the turbine development. Solutions such as the design of new airfoils to extend the fatigue life of blades and to reduce the manufacturing cost of the blades [2] especially for urban turbines, where the flow is characterized by highly turbulent and multidirectional. Conventional airfoils are modified by incorporating a cavity to enhance the lift at low Reynolds number (Re) [3] . The computational study on the trapped vortex airfoil shows significant improvements in starting torque, yet the performance deteriorates at higher TSR [4] . Thick and cambered airfoils [5] , blade pitch and high solidity enhance the turbine performance at low wind speeds. Any improvements on the turbine demand extensive optimization and experimental studies before implementation. Though computational fluid dynamics (CFD) methods are capable of optimizing the design parameters, they require intensive computational resources. Thus aerodynamic models are crucial in predicting the aerodynamic performance with minimal computational resources for the given operating conditions. Several models have been proposed in the past for Vertical Axis Wind Turbines (VAWT) especially for Darrieus turbine by Lisaman [6] , Templin [7] , Strickland [8] , Holme [9] , Paraschivoiu [10] . Every model has its assumptions, limitations, and inaccuracies. Hence a brief comparative analysis of the existing models with their mathematical expressions is performed in search of a suitable model for optimizing 10 kW H-rotor. The chosen model will be validated through wind tunnel test of a scaled model to ascertain the deviation from the actual results.
2. Aerodynamic Models
For any analytical model, the procedure to compute the performance is described as
1) Calculating the local angle of attack and the relative velocity corresponding to the blade orbital position
2) Calculating the induced velocity accounting the blade wake interaction
3) Choosing the suitable mathematical model along with the mathematical expressions
4) Calculation of blade tangential forces and the normal forces
5) Pre-Stall airfoil characteristics at different Reynolds numbers
6) Aspect Ratio consideration to account for the blade tip loss effects
7) Dynamic Stall Model to account for the unsteady effects
8) Flow Curvature Model to account for the circular blade motion.
2.1. Cascade Model
The cascade model was prescribed by Hirsch and Mandal [11] for VAWT analysis, which is widely used for turbomachinery with several blades. In this model, the blades are arranged in cascade on a planar surface, with the distance equal to the circumference of the rotor divided by a number of blades as illustrated in Figure 1. The local relative velocity and the angle of attack are calculated for the upwind and the downwind configuration before unwinding into cascade configuration. Two induction factors are introduced to calculate the induced velocity at upstream designated as and downstream designated as
(1)
(2)
(3)
(4)
With h, as the height of the turbine and R, as the radius of the turbine and c is the airfoil chord. The overall torque Q generated by the rotor can be deduced from Equation (4). The cascade model is able to predict the performance of the rotors with solidities and also at high tip speed ratio quite accurately compared to other mathematical models. Other geometric characteristics such as blade pitch, flow curvature effect and aspect ratio effects can be readily integrated into this model. To improve the predicting capability, the dynamic stall model was accounted along with the flow curvature effects [12] .
2.2. Vortex Model
The vortex model is based on the influence of vorticity in the wake of the blade in which a bound vortex filament replaces each blade element. From the Helmholtz theorem [13] , the strength of the bound vortex filament is equal to the trailing edge tip vortex as shown in Figure 2. The velocity induced
(5)
 (a)
(a)  (b)
(b)
Figure 1. Cascade Model (left) and Single stream tube model (right).
 (a)
(a)  (b)
(b)
Figure 2. Actuator disc model (left) Vortex model (right).
The undisturbed freestream velocity added with the induced velocity by the entire vortex filaments comprises the fluid velocity at any point in the flow field. The relationship between the lift L per unit span on a blade segment and the bound vortex strength is given by the Kutta-Joukowski law as in Equation (6).
(6)
The relation between the bound vortex strength and the lift coefficient , and , the local relative fluid velocity is given as
(7)
The vortex model was improved in recent years by incorporating dynamic stall effects [14] , flow curvature effects [15] . Though vortex model results have better correlation with experimental values, significant efforts are needed to reduce the computational time. Potential flow assumption in the wake and the viscosity effects are simplified through empirical force coefficients, which are likely to contribute to inaccuracies in the performance prediction.
2.3. Single Streamtube Model
The kinetic energy in the wind invariably creates thrust in the incoming direction. The change in kinetic energy between the upstream wind and downstream wind is the useful power P extracted from the wind. Wind rotors can be conveniently considered as a permeable disk as shown in Figure 2, where the kinetic energy from the wind is converted into thrust FD and the torque by the blades. In the single streamtube model as shown in Figure 1, the Darrieus rotor is represented as an actuator disk inside streamtube as proposed by [7] to calculate the performance characteristics .The assumptions of actual disk theory such as, irrotational and incompressible upstream flow, constant flow over the entire disk are applicable for streamtube model too. The single stream model is the forerunner to incorporate the actuator disk in the Darrieus aerodynamic model and most of the successful models are based on this assumption. The upstream velocity is reduced at the disk by an induction factor a (a < 1). Rotor characteristics such as airfoil stall, solidity and aspect ratio are accounted in this model and can effectively predict the performance for lightly loaded turbine. As the solidity and the tip speed ratio increase, this model tends to over predict the performance due to uniform flow assumption for the entire disk.
(8)
(9)
(10)
(11)
(12)
Since the upstream and downstream wind velocity varies considerably, double actuator disk model was introduced as shown in Figure 3. Additional induction factor has been introduced for the second actuator disk. Though this model is sophisticated than single disk model, it is a mere assumption that the downstream flow will be fully developed before it passes through the second disk.
(13)
(14)
(15)
(16)
The value of the axial inductions factors determines the operating state of the rotor. For a < 0, the rotor is in are in the propeller state where the streamtube is contracting, and the thrust force is directed upstream and acts as a propulsion device as energy has to be expended to the fluid if a < 0. If the value of induction factor lies between 0 and 0.4, the rotor will be in windmill state and the momentum theory can be applied as the streamtube is expanding and the thrust force is directed downstream acting as a drag force. In this case, energy can be extracted from the free stream.
2.4. Multiple Streamtube Model
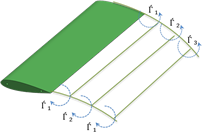
An improved version of the single streamtube model was introduced by Lissaman [6] . The swept volume of the turbine was divided into multiple parallel stream tubes as shown in Figure 4 which are aerodynamically independent. The

Figure 3. Double actuator disc model.

Figure 4. Multiple streamtube model.
blade element and the moment theory are applied for each streamtube. Rotor power, torque is obtained by averaging the values from each streamtube. The model proposed by [6] accounts only the lift force to calculate the induced velocity. Later Strickland [14] includes viscous drag for the similar calculation at the expense of slower convergence of the model. The MST was further improved by Muraca [16] by the addition of support struts, blade aspect ratio, and solidity. The effect of Reynolds number was incorporated by Read and Sharpe [17] . The MST is suitable for the power production of the lightly loaded turbine of low solidity.
2.5. Double Multiple Streamtube Model
The MST was extended by Paraschivoiu [10] by adding two actuator disks for upwind and downwind halves of the rotor and their respective induced velocities on each disk as shown in Figure 5. The induced velocities can be calculated either by constant interference factors or variable interference factors as a function of azimuthal angle. The proposed DMST uses two interference factors for upwind and downwind leading to double iteration. The torque for the upwind is given by Equation (17), whereas the torque for the downwind half is given by Equation (18).
(17)
(18)
(19)
The power coefficient of the turbine is obtained by Equation (19). The current DMST model accounts for the secondary effects including streamtube expansion, blade geometry, rotating tower and the effect of struts and spoilers. Boeing-Vertoll stall model was the recent addition. A good agreement with the experimental data has been observed for different solidity and high-tip speed ratio. By far the DMST model predicts more accurately compared to other

Figure 5. Double multiple streamtube model.
available mathematical models. Hence the DMST model is suitable to analyze the performance of current three bladed H-rotor under investigation.
3. Experimental Procedure
Subsonic open circuit wind tunnel used for this study has a square cross-section of 700 mm × 700 mm. The wind tunnel is powered by 900 mm diameter axial flow fan (Multi-Wing) with the power capacity of 6 kW. A variable frequency drive regulates the wind speed from 0 - 15 m/s. The settling chamber with flow straightener streamlines the air flow. The flow velocity in the test section is uniform within 0.1%.
The airfoils can be interchanged in the test setup without disturbing the center shaft or end plates to minimize the errors induced by shaft misalignment. The test turbine is mounted on the aluminum shaft with deep groove ball bearings on the bottom end and spherical bearings on the top end as shown in Figure 6(b) to accommodate for shaft misalignment. Figure 6(a) shows the instrumentation details of the test setup. Proximity sensor measured the rpm of the rotor. Hotwire anemometer (KANOMAX) with the accuracy of 0.1 m/s was mounted at a distance of 300 mm from the bell mouth exit downstream. The braking torque was applied by magnetic particle brake (Placid Industries). The required tip speed ratio was achieved by varying the amperage to the magnetic particle brake. Friction in the bearings and the measurement train is inevitable. Hence inertial test is conducted and the torque values are adjusted accordingly. Torque and the braking torque were measured by the torque sensor (LORENZ Transducers). The output data from the above sensors are logged by DEWE 43V data acquisition system. The details of the investigated rotor are shown in Table 1.
4. Error Source
The power coefficient is derived from the torque measured and plotted against TSR as shown in Figure 7. There is a large deviation in the measured Cp and the predicted Cp. Though the DMST predicted close to the experimental values for large turbines, the predictions are unacceptable for small VAWTs. Following are the potential sources of error for overprediction.
 (a)
(a) (b)
(b)
Figure 6. Test turbine (Left) and the measurement train (Right).

Table 1. Test rotor details.
4.1. Xfoil
The operating Reynolds (Re) number range of a straight bladed Darrieus turbine of 0.4 m diameter and 0.1 m chord length is from 20,000 to 80,000 for the wind speed of 3 - 12 m/s. From Equation (20), the Re can be calculated for the given chord length and the wind speed.
(20)
where is the density of the air , C is the chord length in (m), is the freestream wind speed . is the kinematic viscosity . The Re of this range falls in the low Re category and the airfoil characteristics are highly complex to predict, unless it is experimentally measured. Airfoil operating in this range stage a complex phenomenon on the upper surface of the

Figure 7. Comparison of experimental measurement and DMST prediction of power coefficient.
airfoil, and the flow behavior is markedly different for a static and dynamic airfoil. Due to low Re, the boundary layer lacks energy to reattach as a turbulent flow after the laminar separation bubble burst. As the Re increase beyond 2 × 10⁵, the probability of reattachment is likely to occur. From the previous studies [18] and through experimental validation, Xfoil for this range of Re always over predicts the lift and under predicts drag. As Re decreases the discrepancies increases. It is concluded from the previous studies that Xfoil can predict close to the experimental value in the range of 60,000 to 2 × 10⁵. The Re range under investigation is below this range and Xfoil it is not a surprising factor that Cp is predicted much higher than the experimental value by DMST due to high lift/drag ratio computed by Xfoil. It is widely accepted that low Re prediction of Xfoil varies significantly with the wind tunnel measured data.
Another source of error is from extrapolation the initial data obtained from Xfoil as the airfoil characteristics are required for 360˚. Two methods are widely used to extrapolate are Viterna [19] and Montgomerie [20] . Viterna method is formulated based on the potential flow theory, whereas the Montgomery method is based on the assumption as a thin plate. Extrapolated values will be a good estimate if the initial limited data is obtained from experiments. But in this the case the initial data is an over predicted by Xfoil which may further extend the high lift to drag ratio error for other angle of attack. Also, the extrapolation methods are meant for static airfoils, which did not account for any unsteady effects. The airfoil characteristics computed from the Xfoil assumes that the flow is laminar, but in reality, the airfoil in VAWTs encounters unsteady turbulent incoming flow and still worse is the downwind half, where the blade operates entirely in wake for such a high solidity turbine.
The 3D printed airfoils are polished before testing, yet the surface roughness sensitivity is more pronounced for a small blade. The surface roughness decreases the airfoil lift coefficient and increases skin friction drag which is not accounted in Xfoil prediction. Hence these are all the notable sources of error contributed by the Xfoil to the DMST to over predict the Cp to such a high value as shown in Figure 7.
4.2. Experiments
No experiments are perfect and so the current experiment, and it is inevitable to conduct an experiment free of errors, but can be kept minimal. The size of the model under investigation is comparatively smaller, and any error in the experiments can significantly influence the torque output. Deep groove ball bearings support the center shaft on the bottom and spherical bearings on top to accommodate shaft misalignment. Even a minor misalignment in the shaft will resist the shaft rotation and affect the rotor torque substantially. The bearing friction also contributes their part in reducing the shaft torque. The bearing friction can be minimized by periodic lubrication. Flexible couplings connecting the rotor shaft to the torque sensor also consumes some of the rotor torque. Collectively, these resistive torques results in recording a lower torque value, though the generated torque is higher. In this case, the Cp displayed by the experiment should be higher and a step closer to the DMST predictions.
4.3. Double Multiple Streamtube Model
Though DMST model predicts the aerodynamic performance of Darrieus rotor more accurately compared to other mathematical models, the inaccuracies do exist for certain design and operating specifications. The discrepancies between the predicted value and the experimental value are proportional to the solidity of the turbines operating at low Tip Speed Ratio (TSR). The solidity can be calculated from Equation (21) as 1.5, with r as the rotor radius.
(21)
From the past validation studies, the DMST model over predicts the performance for such high solidity turbines. Further increase in Cp by DMST model is due to dynamic stall effects, which is cumbersome to predict due to rapidly changing AOA and the turbulence generated. The airfoil characteristics are sensitive to turbulence with loss of lift. For the current study, the blade tip losses are not included due to the presence of end plates in the test model, to prevent the flow around the blades. The blade tip losses are not eliminated with end plates, but are minimized. The DMST model predicts negative Cp if the tip loss factor is included and a possible reason is low aspect ratio. The models under investigation have the aspect ratio of 1.2, whereas the aspect ratios of larger turbines are in the order of 5 to 15. Hence the increase in Cp by DMST prediction, is due to the fact the tip loss cannot be included for small aspect ratio wind tunnel models. Flow curvature effects are more pronounced for small rotor diameter turbines when it operated at higher RPM. The flow curvature effects are induced due to the orbital motion of the blades in Darrieus turbine. In reality, the blades are subjected to curvilinear flow rather than rectilinear flow as assumed. The airfoil lift is significantly reduced due to centrifugal effects on the boundary layer proportional to the TSR. The study by [17] , concludes that due to flow curvature, the actual AoA is approximately 3˚ to 5˚ compared to the airfoil in rectilinear flow. The Cp prediction can be significantly reduced if the flow curvature effect is included in the current DMST model.
5. Conclusions
The objective of the current study is to evaluate the aerodynamic models widely used to predict the performance of Darrieus turbine in order to choose a suitable model to obtain aerodynamic characteristics for 10 kW H-rotor. Albeit, these models are well proven and validated against large turbines, the small VAWTs presents different scenarios due to low Re, flow curvature and low aspect ratio, dynamic stall effects. Hence the chosen mathematical model is experimentally validated against wind tunnel test of a scaled rotor. It is imperative to identify the sources of error in prediction to propose potential solutions. Xfoil induces substantial error in computing the lift and drag characteristics of airfoil due to low Re. The error is compounded by 360˚ interpolations, which relies on the initial input. Following are the conclusions that can be drawn for validating the DMST model prediction with wind tunnel test of a three-straight bladed H-rotor.
The DMST model over predicts the Cp by 23.1% for Re 1.4 × 10⁵, 20.5% for Re 1.7 × 10⁵, 29.2% for Re 1.9 × 10⁵, 20.2% for Re 2.0 × 10⁵, 24.6% for Re 2.3 × 10⁵ and 21.8% for Re 2.6 × 10⁵. As Re increases the predicted value is closer to the experimental value. Xfoil induces substantial error in estimating the airfoil characteristics, especially for low Re. Hence 360˚ polar obtained through the experiments will allow the DMST model to predict with higher accuracy. It is advisable to eliminate the tip loss in an experimental setup with sufficient end plate diameter, rather than including the tip loss factor in the DMST model, which predicts negative Cp due to low aspect ratio.
The errors in the experiment tend to reduce the power coefficient value of the experimental results, resulting in a further deviation from DMST prediction. The DMST has its part of contribution to the error such as low Re performance of the airfoil, flow curvature effect, inaccurate dynamic stall model. Hence the final statement to conclude this study is that the DMST model prediction for small VAWT is far from acceptable accuracy compared to experimental results.
Acknowledgements
This research is supported by the National Research Foundation, Prime Minister’s Office, Singapore under its Energy Innovation Research Programme (EIRP Award No. NRF2013EWT-EIRP003-032: Efficient Low Flow Wind Turbine).
Cite this paper
Kumar, P.M., Rashmitha, S.R., Srikanth, N. and Lim, T.-C. (2017) Wind Tunnel Validation of Double Multiple Streamtube Model for Vertical Axis Wind Turbine. Smart Grid and Renewable Energy, 8, 412-424. https://doi.org/10.4236/sgre.2017.812027
References
- 1. Karthikeya, B.R., Negi, P.S. and Srikanth, N. (2016) Wind Resource Assessment for Urban Renewable Energy Application in Singapore. Renewable Energy, 87, 403-414. https://doi.org/10.1016/j.renene.2015.10.010
- 2. Kumar, M., Surya, M.M.R., Sin, N.P. and Srikanth, N. (2017) Design and Experimental Investigation of Airfoil for Extruded Blades. International Journal of Advances in Agricultural and Environmental Engineering (IJAAEE), 3, 2349-1523.
- 3. Kumar, M., Surya, M.M.R. and Srikanth, N. (2017) On the Improvement of Starting Torque of Darrieus Wind Turbine with Trapped Vortex Airfoil. 2017 IEEE International Conference on Smart Grid and Smart Cities (ICSGSC), Singapore, 23-26 July 2017, 120-125. https://doi.org/10.1109/ICSGSC.2017.8038561
- 4. Kumar, M., Surya, M.M.R. and Srikanth, N. (2017) Comparative CFD Analysis of Darrieus Wind Turbine with NTU-20-V and NACA0018 Airfoils. 2017 IEEE International Conference on Smart Grid and Smart Cities (ICSGSC), Singapore, 23-26 July 2017, 108-114. https://doi.org/10.1109/ICSGSC.2017.8038559
- 5. Beri, H. and Yao, Y.X. (2011) Effect of Camber Airfoil on Self-Starting of Vertical Axis Wind Turbine. Journal of Environmental Science and Technology, 4, 302-312. https://doi.org/10.3923/jest.2011.302.312
- 6. Wilson, R.E. and Lissaman, P. (1974) Applied Aerodynamics of Wind Power Machines. Oregon State University, Corvallis.
- 7. Templin, R.J. (1974) Aerodynamic Performance Theory for the NRC Vertical-Axis Wind Turbine. NASA STI/Recon Technical Report N76, National Aeronautical Establishment, Ottawa.
- 8. Strickland, J.H. (1977) A Performance Prediction Model for the Darrieus Turbine, International Symposium on Wind Energy Systems, Cambridge, 7-9 September 1976, C3-39.
- 9. Holme, O. (1977) A Contribution to the Aerodynamic Theory of the Vertical-Axis Wind Turbine. International Symposium on Wind Energy Systems, Cambridge, 7-9 September 1976, C4-55.
- 10. Paraschivoiu, I. (1981) Double-Multiple Streamtube Model for Darrieus in Turbines. In NASA. Lewis Research Center Wind Turbine Dyn. (N82-23684 14-44), 19-25.
- 11. Hirsch, I.H. and Mandal, A.C. (1987) A Cascade Theory for the Aerodynamic Performance of Darrieus Wind Turbines. Wind Engineering, 11, 164-175.
- 12. Mandal, A.C. and Burton, J.D. (1994) The Effects of Dynamic Stall and Flow Curvature on the Aerodynamics of Darrieus Turbines Applying the Cascade Model. Wind Engineering, 18, 267-282
- 13. Currie, I.G. (2012) Fundamental Mechanics of Fluids. CRC Press, Boca Raton.
- 14. Strickland, J.H., Webster, B.T. and Nguyen, T. (1979) A Vortex Model of the Darrieus Turbine: An Analytical and Experimental Study. Journal of Fluids Engineering 101, 500-505. https://doi.org/10.1115/1.3449018
- 15. Migliore, P.G., Wolfe, W.P. and Fanucci, J.B. (1980) Flow Curvature Effects on Darrieus Turbine Blade Aerodynamics. Journal of Energy, 4, 49-55. https://doi.org/10.2514/3.62459
- 16. Muraca, R.J., Stephens, M.V. and Dagenhart, J.R. (1975) Theoretical Performance of Cross-Wind Axis Turbines with Results for a Catenary Vertical Axis Configuration. NASA Technical Reports Server.
- 17. Sharpe, D.J. (1977) A Theoretical and Experimental Study of the Darrieus Vertical Axis Wind Turbine. Research Report, School of Mechanical, Aeronautical & Production Engineering, Kingston Polytechnic.
- 18. Drela, M. (1989) An Analysis and Design System for Low Reynolds Number Airfoil Aerodynamics. Low Reynolds Number Airfoil Aerodynamics, 1-12
- 19. Viterna, L.A. and Janetzke, D.C. (1982) Theoretical and Experimental Power from Large Horizontal-Axis Wind Turbines. Technical Report, DOE/NASA/20320-41, NASA-TM-82944, ON: DE83001099. https://doi.org/10.2172/6763041
- 20. Montgomerie, B. (2004) Methods for Root Effects, Tip Effects and Extending the Angle of Attack Range to+-180°, with Application to Aerodynamics for Blades on Wind Turbines and Propellers, Swedish Defence Research Agency.