Smart Grid and Renewable Energy
Vol.2 No.1(2011), Article ID:4037,8 pages DOI:10.4236/sgre.2011.21005
Feasibilty of Wind-Solar Hybrid System for Cleveland, Ohio, USA
![]()
Department of Mechanical Engineering, Cleveland State University, Cleveland, USA.
Email: r.gorla@yahoo.com
Received November 14th, 2010; revised January 12th, 2011; accepted January 17th, 2011.
Keywords: Smart Metering, WiMAX, Smart Grid, Demand Response, Electric Vehicles
ABSTRACT
The most promising and most feasible application of solar-wind hybrid energy is in the area of space and service water heating. Since these heating processes require only moderate temperatures, they can be easily achieved by the use of low-cost flat-plate collectors and low cut-in wind turbines. As the heating of buildings and provision of hot water account for a very significant percent of the total energy consumption in Cleveland, the diversion of these energy demands to solar-wind hybrid energy would result in a substantial relief of our dependence on fossil fuels and other forms of energy resources.
1. Introduction
There is a complementary effect of the energy resource between wind energy and solar energy. The search for a more reliable and less costly renewable energy system has brought about the hybrid use of two energy sources: solar and wind energy. For a solar-wind hybrid system, the techno-economical efficiency is mainly dependent on the solar and wind energy resources, which are highly variable in time and site specific. The problems caused by the variable nature of these resources can be partially overcome by integration of the two resources into an optimum combination. The strength of one source could overcome the weakness of the other during a certain period of time. This is apparent by realizing the fact that in Cleveland, according to data of NASA Surface meteorology and Solar Energy, more solar radiation and less wind are available during the summer months, and similarly, more wind and less solar radiation are available during the winter months. There are a number of methods used to design a hybrid solar-wind system and to calculate the probability or reliability of its power generating capacity. The most popular method, LPSP (loss of power supply probability) method has been used to design a hybrid system using linear programming, goal programming and probabilistic techniques.
Sateikis et al. [1] analyzed the feasibility of heating a single family home by using solar and wind energy. Elhadidy and Shaahid [2] looked at the feasibility of a hybrid solar and wind system for Dhahran, Saudi Arabia. Yang et al. [3] analyzed a hybrid photovoltaic/wind system for Hong Kong. Celik [4] optimized a photovoltaic/ wind system. Gorla [5] presented a finite element analysis for a solar collector system. Kimura et al. [6] presented a demonstrative study of wind/solar hybrid system. Yang and Aydin [7] analyzed the wind energy/hydrogen storage hybrid power station.
The objective of the present study is to identify the potential of satisfying about 50% of heating needs of single family houses in Cleveland (for space and water heating) in the hybrid system by using solar and wind energy.
2. Weather Data Analysis
For the Cleveland metropolitan, the climate data for ten year average are taken as the typical weather year. The summer provides good solar irradiance but poor wind conditions, whilst a relatively good wind source but poor solar irradiation occurs in the winter. For the daily distribution, on most days with high solar radiation, the wind energy is poor. Such periods usually last 3-5 days, thus such complementary characteristics make hybrid application more reliable. The combination of the two energy sources can provide a better utilization factor for the available energy. For a typical day of sunshine, the radiation peaks at around 1:00 PM. The available solar power is able to meet the load profile and peak load during the daytime. For the wind distribution in Cleveland, November to April provides the highest wind speeds, which occur early in the morning, with the lowest in the afternoons. In other months, the wind speed in good wind exposure areas changes daily and continuously. Thus, solar energy and wind energy resources can compensate for each other not only for a few days but also for the whole year.
3. Heating Process
A hybrid of 12 m × 3 m solar collector area and a 3 ft diameter wind turbine is been proposed for the space heating of a one-storied house and the heating of a 75 liters hot water tank in Cleveland, Ohio as shown in Figure 1. The equipments will be mounted on the one-storied house roof, 10m above grade.
 (a)
(a)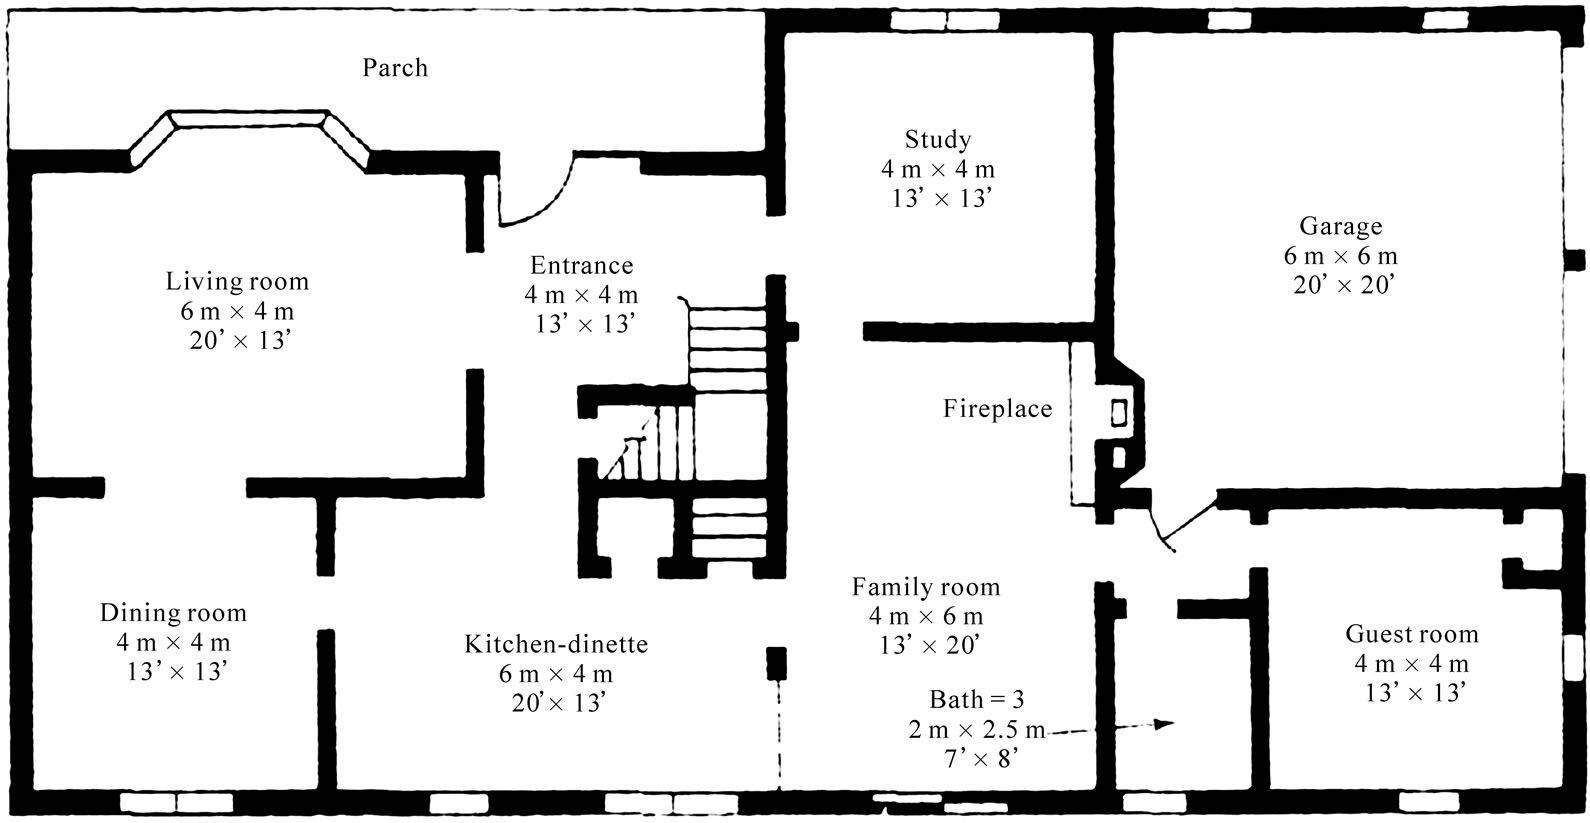 (b)
(b)
Figure 1. Floor plans of a residential building: (a) second floor. 240 cm (7'-10") ceiling, (b) first floor, 240 cm (7'-10") ceiling. [This building has a full basement with 210 cm (7'-0") ceiling].
3.1. Solar Heating System
In order to design and optimize solar heating systems, it is necessary to be able to predict system performances. With properly formulated mathematical models for various system components, computer simulations based on the dynamic performance of the system can be utilized directly as a design tool for the particular application. For large institutional buildings, computer simulations based on hourly meteorological data are essential for a successful design.
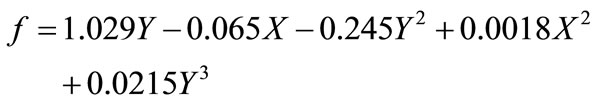
For residential houses, however, the expense of individual computer simulations can be avoided by the use of some simplified procedure that has been proved to be adequate through computer simulations or experiments on a long-term basis. One such simplified procedure is the widely used f-chart method. Klein, Beckman and Duffie (KBD) at the University of Wisconsin obtained a correlation between the f-factor and the dimensionless parameters X and Y in a graphical form as shown in Figure 2, known as the f-chart. The f-chart of Figure 2 can be utilized in the design of liquid-based solar heating systems to determine the annual load fraction corresponding to a number of different collector areas. The relationship between X, Y, and f can also be expressed in equation form:
A plot of the annual load fraction versus collector area is prepared as shown in Figure 3 for the liquid-based solar space and domestic water heating system based on the result of calculations from the following information:
1) The collectors are facing south at a tilt angle of

2) Collectors are single-glazed flat-plate design with selective absorber surfaces. Collector tests have revealed the values of  and
and  to be 4.9 W/K per square meter of collector area and 0.74, respectively.
3) Assume that 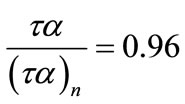 for January, February, November, and December
 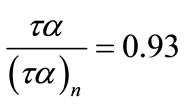 for March, April, September, and October
 for May, June, July, and August
4) The flow rates for both water and antifreeze solution through the collector heat exchanger are 0.016 kg/s per square meter of collector area. With a heat exchanger effectiveness of 0.70, the collector exchanger factor F’R/FR was found to be 0.97.
5) The storage capacity of the preheat tank is 75 liters of water per square meter of collector area.
6) The auxiliary tank is a cylinder 0.5 m in diameter and 1.2m high, with an overall loss coefficient of 0.6 W/K.m2.
7) The volume of hot water required per person is 100 liters/day. The distribution of water usage in the household is considered normal. The minimum acceptable hot water temperature is Tw = 60˚C. The temperature of cold water supply is Tm = 11˚C.
8) The solar and climatic data are the same as in Table 1.
3.2. Solar Service Water System
The f-chart for liquid-based solar space and service water heating systems can be used to estimate the performance of solar systems when the heating load is entirely due to service water heating. This is done by multiplying the dimensionless parameter X by the following service water heating correction factor:

The recommended correction is based on a storage capacity of 75 liters of water per square meter of collector area and a normal distribution of daily domestic water usage. The basic configuration of the solar water heater considered for the Cleveland residence is shown in Figure 4. Similar to the case of space heating system design,

Table 1. Monthly accumulated solar radiation and wind velocity distribution (NASA).
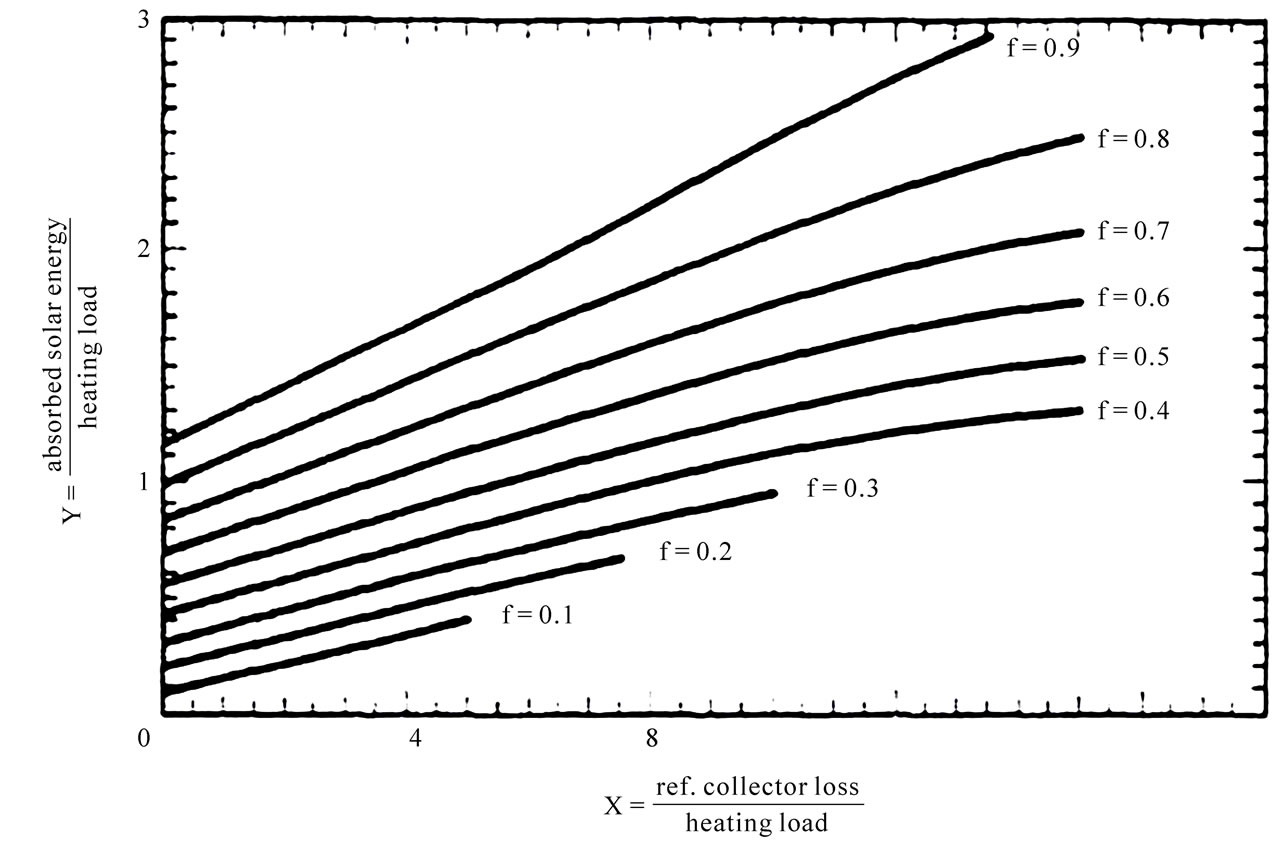
Figure 2. The f-chart for liquid-based solar heating systems. (Adapted with permission from S. A. Klein, W. A. Beckman, and J. A. Duffie, “A Design Procedure for Solar Heating Systems,” Solar Energy, Vol. 18, p. 113; copyright 1976 by Pergamon Press Ltd.).

Figure 3. Annual load fraction supplied by solar energy versus collector area.
a simple approach in the design of solar service water systems is to make use of the f-chart to obtain a plot of annual load fraction supplied by solar energy versus collector area, such as the one shown in Figure 3, which is the result of calculations based on the conditions for the Solar Heating System above.
3.3. Wind Power-Plant Energy
The theoretically available power in the wind can be expressed as the average wind flow power passing through the wind turbine blades area, A:
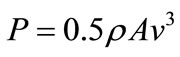 (W/m2)
Be aware that the density of air decreases with temperature and altitude and that the major factor in power generation is wind velocity.
A 20% increase in the wind velocity-increases the power generated by 73%.
Theoretical and rated wind power generation for typical wind turbines are indicated in the “wind speed-power curve” below. Cut-in wind speed, rated wind speed, shutdown wind speed and rated power for windmills with 20% and 40% efficiency are indicated in Figure 5.
Actual available power can be expressed as
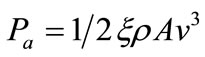
where ξ = efficiency of the wind turbine (in general less than 0.4, or 40%)
The Betz Limit tells us that the maximum percentage of power we can harvest from the wind is 59.26%.
The energy generated by a wind turbine depends on
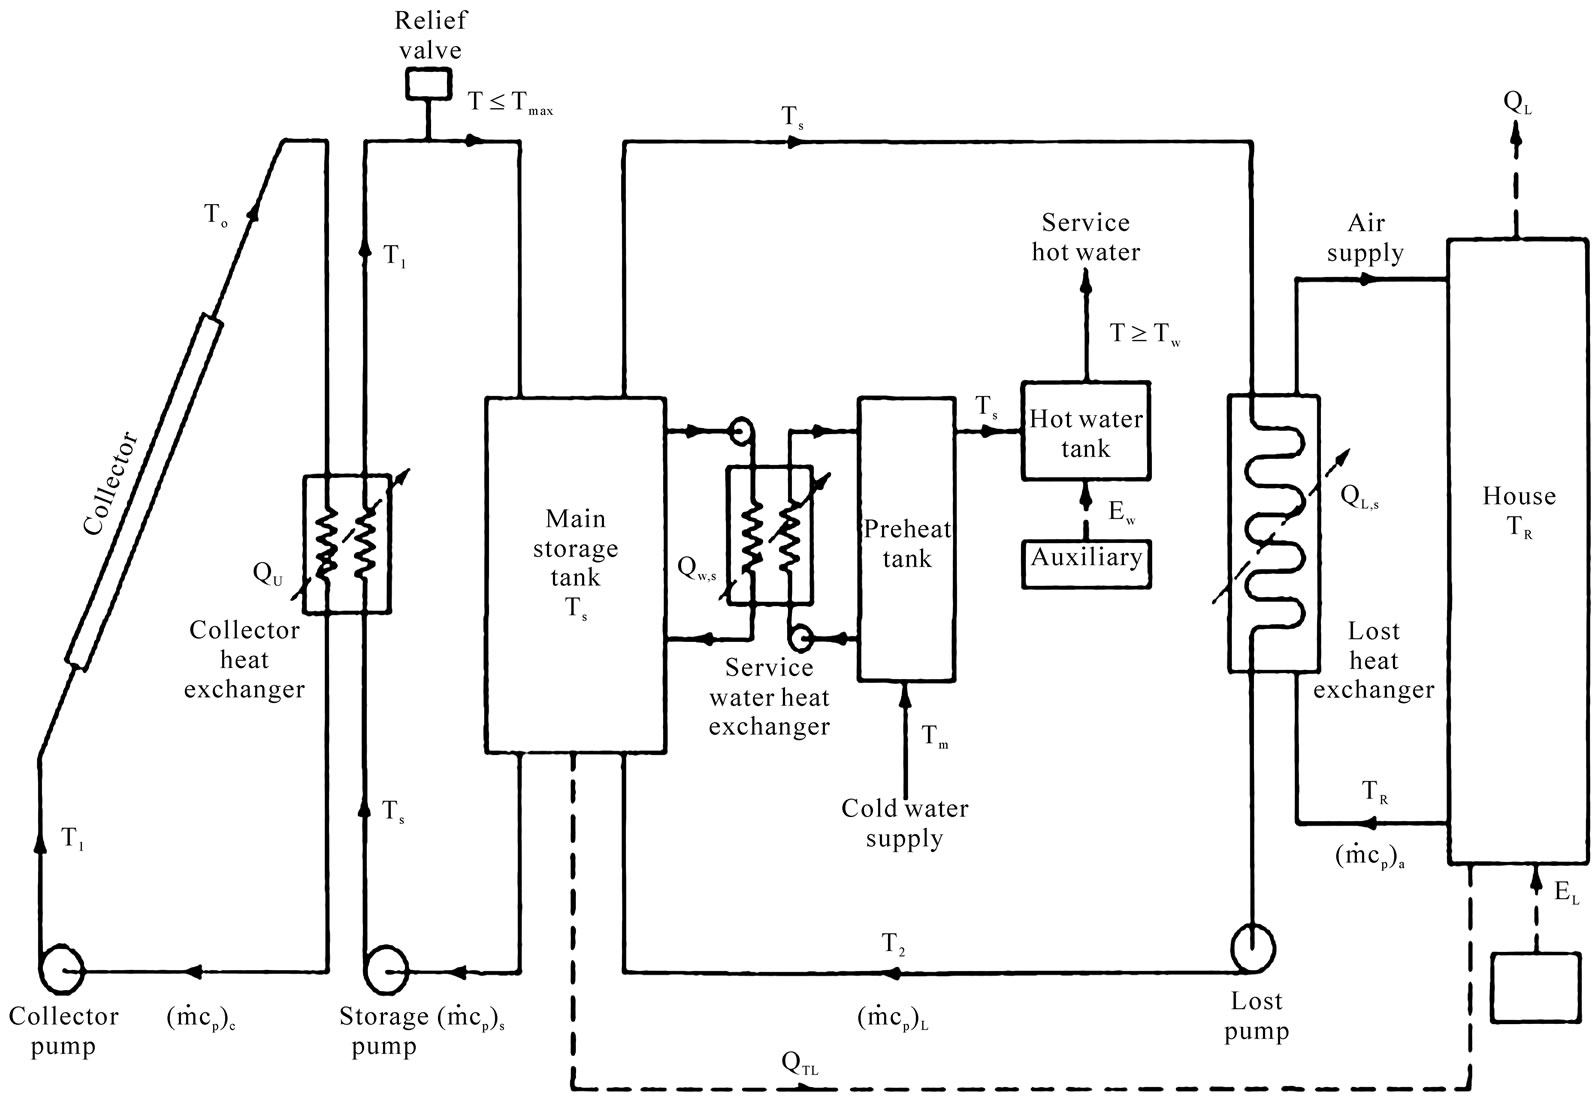
Figure 4. Liquid-based solar space and service water heating system with antifreeze solution collector loop.

Figure 5. Wind speed-power curve.
the power generation as indicated above-and how often or how many hours the wind blows-or more scientifically-the “wind speed frequency distribution” at the actual location.
The total energy generated over a year can be calculated by summarizing the power generation for all velocities (ranging from the actual wind turbine cut-in speed to the shut-down speed) multiplied with the number of hours the wind blows at the actual speeds. Figure 6 shows the wind frequency distribution diagram with energy produced at different velocities.
3.4. Solar-Wind Hybrid
In the hybrid system the wind power-plant produces electric power which is used predominately for heating the hot water tank (Auxiliary in Figure 4). The gross average coefficient of wind energy conversion into heat is accepted as 0.32. The hub height is 10m which is about the height of a roof of a one-storied house in Cleveland, Ohio. Used in the analysis the collectors average efficiency is been used in the total rate of useful energy gain, called the Hottel-Whillier-Bliss equation for solar collector:
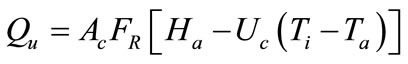 (kWh/m2/day)
The average quantity of thermal energy obtained from the wind power-plant for the period ∆t (hours):
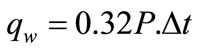 (kWh/m2/day)
4. Results and Discussion
In order to design and optimize solar heating systems, for residential houses in Cleveland, Ohio at latitude of 41.5˚, longitude -81.5˚ and elevation 582m, the f-chart was utilized in the design of the liquid-based solar heating system to determine the annual load fraction in conjunction with a 3 feet diameter wind turbine, with both equipments mounted on the two-storied house roof.
4.1. Results for Solar Power System Operating Alone
During the cold winter months in Cleveland (October through March), the solar alone contributes 10-18% of the required space and water service heating load.
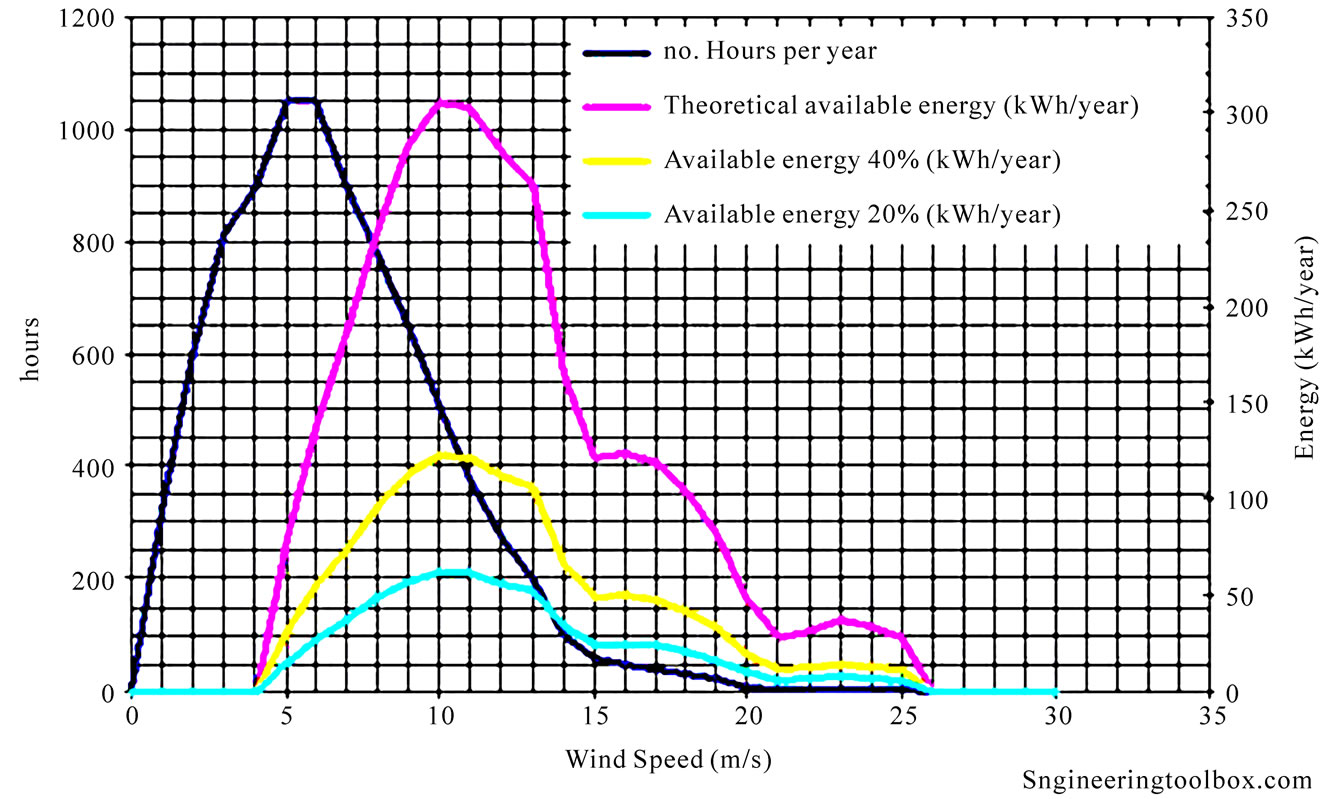
Figure 6. A typical wind speed frequency distribution diagram with energy produced at the different velocities.

Figure 7. Monthly accumulated solar radiation and wind power distribution.
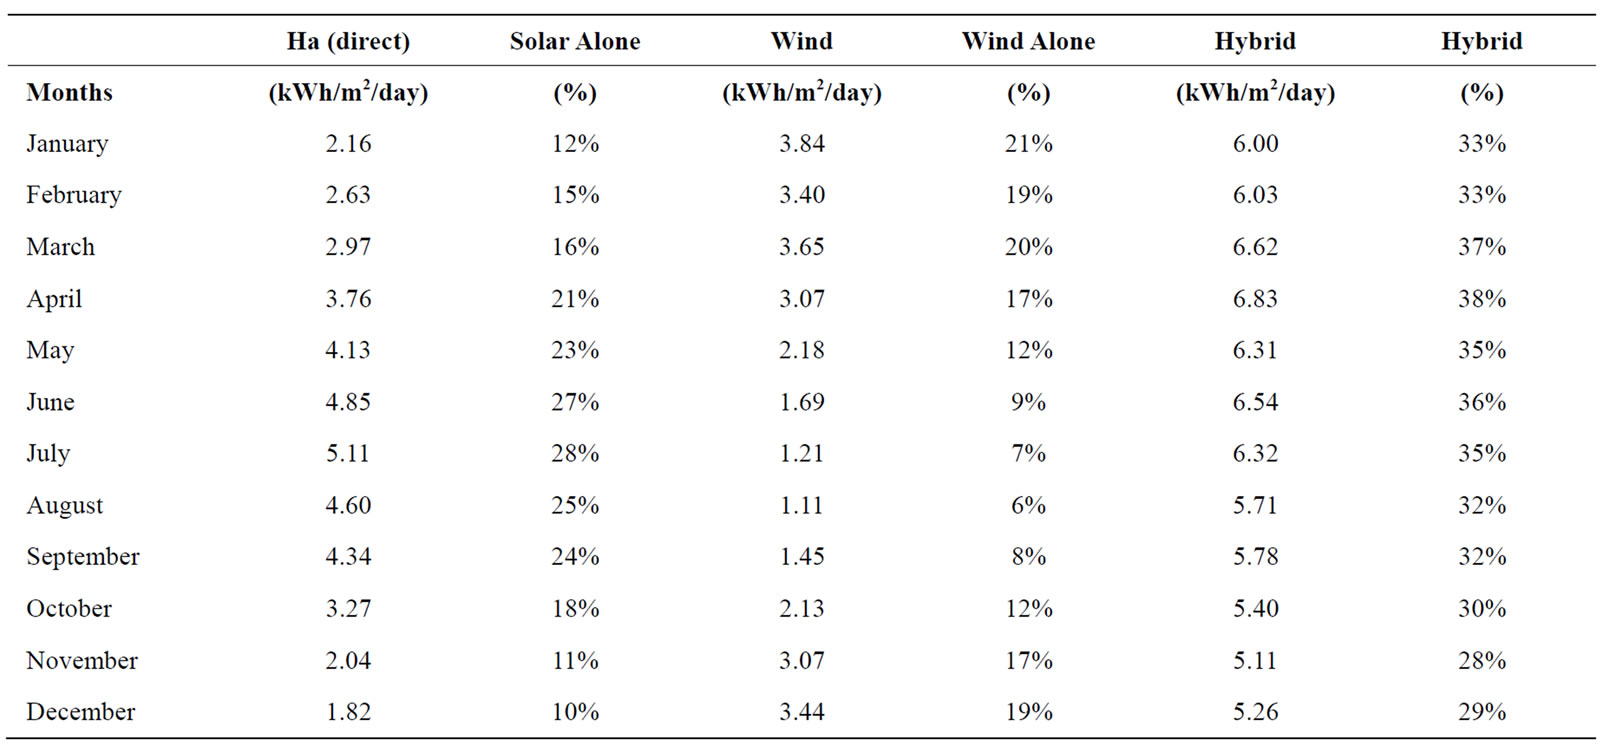
Table 2. Monthly contributions from solar, wind and hybrid power distribution.
4.2. Results for Wind Power System Operating Alone
During the cold winter months in Cleveland (October through March), the wind alone contributes 12-20% of the required space and water service heating load.
4.3. Results for Hybrid Solar-Wind Power System
During the cold winter months in Cleveland (October through March), the hybrid contributes 28-36% of the required space and water service heating load as shown in Figure 7 and Table 2.
5. Conclusions
This paper analyzes the possibilities to satisfy 50% of the energy demands to heat the individual houses in Cleveland, Ohio utilizing the wind and solar energy. The analysis used ten year average weather data of NASA Surface meteorology as the typical weather year to analyze the complementary characteristics of solar radiation and wind power in developing solar-wind hybrid energy. The analysis has shown that the generated energy of the hybrid system can satisfy 28-36% of the cold winter months and 31-37% generated during the summer months exceeds the energy requirements for the hot water and the premise heating during the summer months. It is recommended that the power generated by the wind turbine during the non-winter months (April through September) be fed into the national power grid.
REFERENCES
- I. Sateikis, S. Lynikiene and B. Kavolelis, “Analysis of Feasibility on Heating Single Family Houses in Rural Areas by Using Sun and Wind Energy,” Energy and Buildings, Vol. 38, No. 6, 2006, pp. 695-700. doi:10.1016/j.enbuild.2005.11.003
- M. A. Elhadidy and S. M. Shaahid, “Feasibility of Hybrid (Wind + Solar) Power System for Dhahran, Saudi Arabia,” Renewable Energy, Vol. 16, No. 6, 1999, pp. 970- 976. doi:10.1016/S0960-1481(98)00344-9
- H. X. Yang, L. Lu and J. Burnet, “Weather Data and Probability Analysis of Hybrid Photovoltaic-Wind Power Generation Systems in Hong Kong,” Renewable Energy, Vol. 28, No. 11, 2003, pp. 1813-1824. doi:10.1016/S0960-1481(03)00015-6
- A. N. Celik, “Optimisation and Techno-Economic Analysis of Autonomous Photovoltaic-Wind Hybrid Energy Systems in Comparison to Single Photovoltaic and Wind Systems,” Energy Conversion and Management, Vol. 43, No. 18, 2002, pp. 2453-2468. doi:10.1016/S0196-8904(01)00198-4
- R. S. R. Gorla, “Finite Element Analysis of a Flat Plate Solar Collector,” Finite Elements in Analysis and Design, Vol. 24, No. 3, 1997, pp. 283-290. doi:10.1016/S0168-874X(96)00067-4
- Y. Kimura, Y. Onal and I. Ushiyama, “A Demonstrative Study for the Wind and Solar Hybrid Power System,” World Renewable Energy Congress, Abu-Dhabi, 1996.
- W. J. Yang and O. Aydin, “Wind Energy-Hydrogen Storage Hybrid Power Generation,” International Journal of Energy Research, Vol. 25, No. 5, 2001, pp. 449-463. doi:10.1002/er.696
Nomenclature
A area wind passing through perpendicular to the wind (m2)
Ac collector area
F monthly heating load fraction supplied by solar energy, correlation between X and Y
FR collector heat-removal factor
Ha solar radiation absorbed by the collector absorber
Ht total (beam and diffuse) incident radiation on the tilted collector surface
Ka asymmetry coefficient
Ν number of days in the month
P average wind flow power
Pa actual wind flow power
S service water heating correction factor
Qu rate of energy collection by the flat-plate collector
qw average quantity of thermal energy obtained from the wind power-plant (kWh/m2/day)
Ta monthly average ambient temperature (˚C)
Τi collector fluid inlet temperature (˚C)
Tm temperature of cold water supply (˚C)
To outdoor temperature (˚C)
Tw minimum acceptable hot water temperature (˚C)
Uc collector overall heat-loss coefficient
v wind velocity (m/s)
X ratio of the reference total energy loss to the total heating load during the period ∆t
Y ratio of the total absorbed solar energy to the total heating load during the period ∆t
α plate solar absorptivity
∆t time span (second or hour)
ρ density of air (kg/m3)
τ plate solar transmissivity
θ collectors tilt angle