Smart Grid and Renewable Energy
Vol.1 No.1(2010), Article ID:1945,8 pages DOI:10.4236/sgre.2010.11005
Green Environment: Decision-Making and Power Utility Optimization towards Smart-Grid Options
![]()
Department of Civil, Environmental and Geomatics Engineering Florida Atlantic University, Boca Raton, USA.
Email: degroff@fau.edu
Received February 24th, 2010; revised May 11th, 2010; accepted May 12th, 2010.
Keywords: Green Building, Power Utility Conservation, Payoff-matrix, Game-theoretic Formulations
ABSTRACT
Decision-making toward prudent energy conservation is a primary issue in the power utility management while con-ceiving green environment. Presented in this paper are relevant considerations and prudent ways of decision-making thereof. Examples are furnished to illustrate the underlying considerations and are discussed using practical examples. Specifically green ambient is considered and the underlying payoff resulting from each combination of strategies adopted (or courses of action taken) by the technology-option participants is evaluated. Game-theoretic pursuits are followed.
1. Introduction
Green environment is an eco-friendly ambient. In modern civil and environmental engineering point of view, it translates into conceiving a building infrastructure, which is eco-friendly. Such green-centric ambient involves spaial proliferation of green constructions (sustainable buildings) and making the surroundings at large with processes that are environmentally responsible and resource-efficient throughout the life-cycle of the green entities. Making of a green environment starts from siting to design, construction, operation, maintenance, renovation, and deconstruction efforts with eco-friendly features. Relevant approach expands and complements the classical building design concerns of economy, utility, durability, and comfort.
The common denominator in forming green ambient is to impact human health preservation. This is accomplished by: Efficient usage of energy, water, and other resources; protecting occupant health against any ecorelated hazards; reducing waste, pollution and environmental degradation and developing a congenial ambient contributing larger employee productivity.
Green-building/environment concept envisages using natural materials that are available locally. Other related topics include sustainable design, green architecture, and energy efficient buildings so as to bring in harmony with the natural features and resources surrounding the site. Among several key steps in designing sustainable buildings and environment, generating on-site renewable energy and optimization of power utility are very important. Relevant efforts involve prudent decision-making in the underlying engineering. The focus of this paper is to exemplify related decision-making analyses.
2. Green Environment Optimization
The concept of “green” towards sustainable development of environment stems from energy (especially fossil oil) utilization concerns. The crisis and the environment pollution issues of 1970s posed the niche and desire for more energy-efficient and environmentally-friendly construction practices as well as looking at integrated and synergistic designs in new and existing infrastructure.
Associated conservation emphasizes taking advantage of renewable resources, for example, using sunlight through passive solar, active solar and photovoltaic techniques and using plants and trees through green roofs, rain gardens, and for reduction of rainwater run-off. Also, techniques, such as using packed gravel or permeable concrete in lieu of conventional concrete or asphalt to enhance replenishment of ground water, are directed to realize a green ambient.
The technological practices in realizing a total green environment are still infantile, but are constantly evolving. Relevant efforts may differ from region-to-region globally but, the diversity is unified on siting plus structural design efficiency, energy efficiency, water efficiency, materials efficiency, indoor environmental quality enhancement, operations and maintenance optimization, and waste and toxics reduction the essence of green building and green environment is an optimization of one or more of the above considerations. Further, related synergistic design would yield specific and individual green concept technologies that may work together to produce a greater cumulative effect.
3. Green Environment: Smart Energy Grid Concept
Largely, on-site renewable energy generation and utilization is recommended in formulating a green ambient. But making a large geography green, in essence would require smart and intelligent power generation, transmission, distribution and utilization efforts. Relevant distributed energy resources technology covers application areas of integration of distributed energy resources and their innovative aggregation mechanisms for participation in the electric system operation. Distributed energy resources for integration encompass distributed generation (including renewable generation such as those derived from solar and local wind sources, and non-renewable, energy-efficient generation resources on or near the loads), storagem (including advanced battery-based and nonbattery-based storage devices), and demand-side resources (such as smart appliances, electric vehicles (EVs) or plugin hybrid electric vehicles (PHEVs), and electricity-using equipment in industrial or commercial applications engaging in smart grid functions). Smart grid metrics for the technology application areas are:
• Load participating based on grid conditions: fraction of load served by interruptible loads, utility-directed load control, and incentive-based, consumer-directed load control;
• Load served by microgrids: fraction of entire load served by microgrids;
• Grid-connected distributed generation (renewable and non-renewable) and storage: percentage of all generation capacity that is distributed generation and storage;
• EVs and PHEVs: percentage shares of on-road, light-duty vehicles comprised of EVs and PHEVs;
• Grid-responsive, non-generating, demand-side equipment: total load served by smart, grid-responsive equipment (smart appliances, industrial/commercial equipment including motors and drivers).
Considering the underlying transmission and distribution (T&D) infrastructure, technology application areas at the transmission level include substation automation, dyn amic limits, relay coordination, and the associated sensing, communication, and coordinated action. Distributionlevel application areas include distribution automation (such as feeder-load balancing, capacitor switching, and restoration), enhanced customer participation in demand response, outage management systems, voltage regulation, VAR (volt ampere reactive) control, geographic information systems, data management, and mobile workforce management, and improved power quality to meet the range of customer needs. Further, smart grid metrics for the T&D technology application areas are: 1) T&D system reliability: duration and frequency of power outages; 2) automation: percentage of substations using automation; 3) advanced metering: percentage of total demand served by advanced metered customers; 4) advanced system measurement: percentage of substations possessing advanced measurement technology; 5) capacity factors: yearly average and peak-generation capacity factor generation and 6) T&D efficiencies: energy conversion efficiency of electricity generation, and electricity T&D efficiency.
Related to the above considerations, addressed in this paper are methods of decision-making in conserving the power/electrical energy toward green ambient creation.
4. Decision-Making in Power Conservation
A major issue in smart power grid management under green ambient is to make a prudent decision on exercising efficient power conservation. Pertinent to such issues, the decision has to be made among possible alternatives with all the certainty and uncertainty considerations duly taken into account. That is, decisions made are dictated by a prescribed set of decision criteria. Evolving such criteria and heuristically applying them to the problem is attempted in this paper with relevant examples.
Decision-making is a crucial aspect of any goaloriented problem. It refers to making the best rational judg ment with minimum risk. In engineering the power grid management, it involves prudent managerial steps of saving the energy by minimizing losses. Hence, relevant steps that are involved largely refer to engineering analyses on choosing the right efforts worthy of implem entation. Further, this decision-making involves critical aspects of making judgment on the proper choice of equipment and systems (specified by the associated technological merits and engineering advantages) that lead to a tangible green ambient toward sustained energy conservation. In reality, it goes without saying that, decisionmaking involves both an optimal choice of engineering methods and a pragmatic selection of technology that matches the environment in hand. The engineering aspects of decision-making are aimed at deciding whether it is worthy of trying a particular method of taking into account of all the oddities of implications. Typically, such efforts are based on what is known as the present worth analysis. It refers to a decision-process on outcomes of feasible alternatives (with reference to a project proposal) with selection criterion being the extent of “green efficiency”. The associated task of prudent decision among the alternatives involved is to foresee results with 1) a maximized result for a given (fixed) input; 2) a minimized input leading to a desired (fixed) output and 3) a maximized difference between the output and the input under the condition that neither the input nor the output is fixed. The corresponding present worth (PW) of a contemplated effort is decided on the basis of the life-span of the ambient (say, a green building) specified within a finite period of time. This finite time-period is known as the analysis period. Within this analysis period, the useful life could be identical in respect of all the possible alternatives indicated for a green project; or, it could be different for each alternative. Another situation may correspond to the analysis period being of infinite extent. Adjunct to PW considerations, the other criteria on decision-making involve other factors, namely, success rate of the project and eco-friendliness.
4.1 Statistical Decisions
Decision-making is often risky, difficult and complex. This is because such decisions may have to be made mostly with insufficient information. Lack of or sparse information is undesirable but often unavoidable. This condition of insufficient information depicts the “positive entropy” a measure of uncertainty. Such an uncertain state will lead to admitting that, different potential outcomes may be recognized without reasonable projections of their probability of occurrence. This admission portrays the implicit risk in the decision made thereof on the outcomes. Risk is the extent of variability among the outcomes associated with a particular strategy pursued in a business. It exists whenever, there is a range of possible outcomes that go with the decision and the statistics of such incomes are known (in terms of the probabilities of the outcomes). In general, efforts that offer higher expected results involve greater risk. Further, the risk is directly linked to the utility. That is, the utility function that measures the extent of satisfaction will respond to the extent of risk involved in a specific strategy pursued. If the utility function is plotted against the risk (for example, dollar expended on a project), there are three possible scenarios:
1) If the resulting plot is concave, the utility function is risk-averse;
2) A convex graph means that the utility function is risk-seeking;
3) A linear (straight) relation between the utility function versus the risk corresponds to a risk-neutral situation. Summarizing.
Further, whenever utility of an exercised effort is greater than the expected utility of the effort, the pursued strategy is risk-averse. When utility of effort exercised is equal to the expected utility of the effort, the pursued strategy is risk-neutral; and, when utility of effort exercised is less than the expected utility of the effort, the pursued strategy is risk-seeking.
4.2 Risk management in Green Environment Efforts
Power utilities are responsible to defend and protect a critical infrastructure against any failure, however momentary. The utilities are also responsible for making prudent investments and focus on minimizing risk. Such responsibilities of the power utility operation can be comprehended via smart grid systems. An impediment, however, does exist to the widespread adoption of smart grid technology because smart grid technologies have not been extensively proven and the existing utility business model does not provide enough economic rewards for such cutting-edge utilities [1].
Still, many corporations have adopted the smart grid structures and such companies incorporating smart grid technologies have put a unique level of investment in a variety of technologies.
5. Decision-Making under Green Environment
A smart grid is an umbrella term that covers modernization of both the transmission and distribution grids. The modernization is directed at a disparate set of goals including facilitating greater competition between providers, enabling greater use of variable energy sources, establishing the automation and monitoring capabilities needed for bulk transmission at cross continent distances, and enabling the use of market forces to drive energy conservation.
Smart meters, one of the smart grid features, serve the energy efficiency goal. The approach is to make it possible for energy suppliers to charge variable electric rates so that charges would reflect the large differences in cost of generating electricity during peak or off peak periods. Such capabilities allow load control switches to control large energy consuming devices such as hot water heaters so that they consume electricity when it is cheaper to produce. That is, to reduce demand during the high cost peak usage periods, communications and metering technologies inform smart devices in the home and business when energy demand is high and track how much electricity is used and when it is used.
Intelligence in distribution grids will enable small producers to generate and sell electricity at the local level using alternative sources such as rooftop-mounted photo voltaic panels, small-scale wind turbines, and micro hydro generators. As such there could be several utilities competing at the local level [1].
By reducing peak demand, a smart-grid can reduce the need for additional transmission lines and power plants that would otherwise be needed to meet the demand [2]. The ability to reduce peak demand via smart grid-enabled consumer demand response/load management can defer or reduce the need to build resources that would be unused most of the time. A smart-grid can also defer capital investments by prolonging the life of existing assets through enhanced asset management methodologies that exploit additional condition monitoring and diagnostic information about system components. Thus there are economic benefits to utilities to embrace the smart-grid, and it follows a competitive power utility market will develop from its adoption.
In competitive technology situations, two or more decision-makers are involved. The theory of equality applies to presuming that each decision-maker of a competing technology vendor is as good, intelligent and rational as the decision-makers of other competing units. However, each decision-player is confronted with the odds of other decision-makers’ ploys. Thus, the decision-makers are players, the conflicts they face are games and the rationale of their competition is referred to as the game theory [3]. To illustrate the buried concepts of the game theory, it is necessary first to define and explain certain terms of relevance:
Strategies: Alternative courses of action taken by game-players.
Pure strategy: A player adopting the same alternative at every play.
Game of strategy: A game with the best course of action for a player being dependent on what that player’s adversaries can do.
Optimum strategy: Using one alternative or a mix of alternatives (that is, using different alternatives) for successive plays.
Payoff matrix: In two-person games, for example, the rows of the payoff matrix contain the outcomes for one player, and the columns contents of the columns carry the outcomes for the other player.
Saddle-point: A saddle-point is identified by an outcome, depicting both the smallest number in its row and the largest number in its column in the payoff matrix. Considering a hypothetical payoff matrix indicated in Table 1, its saddle-point can be identified as shown. Note that the table is constructed with reference to three alternatives A(I), A(II), and A(III) and corresponding identified states of nature N1, N2, N3, and N4.
Value of the game: It is the return from playing one game depicting the amount that a player nets from theensuing outcome.
Mixed strategy: It is the policy pursued by the players in the absence of the saddle-point. That is, different alternatives are used for a fixed proportion of the plays, but the alternative employed for each play is a random choice from those available.
Nash equilibrium: It corresponds to a set of strategies such that none of the players can improve their payoff, given the strategies of the other players.
The success of using game theory largely stays with applying judicious logic consistent with practical impli
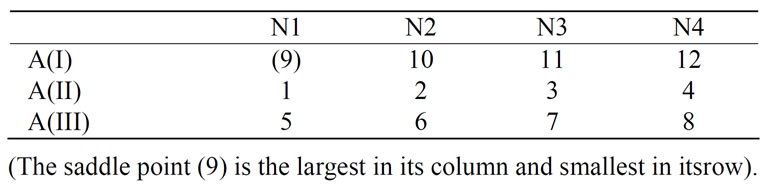
Table 1. Illustration of a saddle-point in a hypothetical payoff matrix
cations. The procedure involved includes: Assigning meaningful payoffs, solving the associated matrix, (which is usually large), handling multiple players and accounting for the possibilities of collusion, conciliation, irrationality of players, and nonconformance of traditional game theory principles.
In essence, the game theory applies to competitive decisions under uncertainty. It covers the following versions of game: 1) Zero-sum/two-person game where two opponents are presumed to have the same knowledge of outcomes; and, the winnings of one equates to the losses of the other. 2) Zero-sum/two-person optimal pure (or mixed strategy) that allows selecting a single course of action (or randomly mixed actions) constrained by a set of proportions maintained, leads to the calculation of the value of the game assuring minimum return; 3) Multiple player games and 4) Nonzero-sum games. The last two games are more involved to-formulate and solve. However, they carry promising applications in the technoeconomic world.
The following examples pertinent to power utility service are indicated to illustrate the game theory applications and solving approaches. The first example refers to a two player/zero-sum case and the second example is concerned with two player/nonzero-sum problem.
5.1 Example 1: A Game-Theoretic Approach to Smart Grid Utility Pricing Issues
Supposed a power utility service provider (PSP) has extended new service in an area where it faces competition from an incumbent local producer (ILP). The PSP finds that the ILP’s promotional strategy varies from reduced price/service charges (C1) of electricity during low demand periods, and promoting the promise of no disturbances in power quality and reliability (C2) by designing and deploying its own neighborhood electricity circuit controlled by on-off switches and protected by circuit breakers. In order to competitively attract customers, the PSP also comes out with a plan that comprises of:
1) The new service at a rate (I1) but for peak curtailment, hiked rates for electricity used above a predetermined amount;
2) deploying in-home displays of power usage (I2); or 3) offering the ability to accommodate alternative energy to attract customers who want to go green (I3).
The PSP and the ILP are equally competitive in their promotional efforts but differ in certain aspects of their technology-specified expertise. Taking these facts into account, the marketing department of the PSP has arrived at a payoff matrix depicting the percentage gain (or loss) in net revenue for the different outcomes under the service plans of PSP and ILP as shown in Table 2. Suppose it is required to determine the proportion of PSP’s efforts (pertinent to I2 and I3) that can be pursued so as to get a advantageous edge on (PSP’s) revenue by providing the
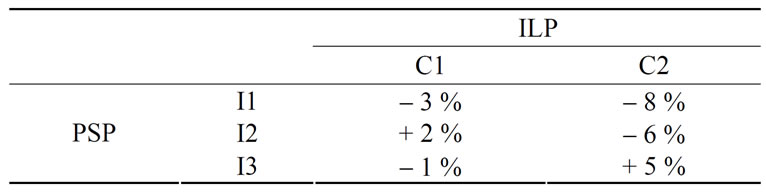
Table 2. Payoff matrix on the service plans of the PSP and ILP in Example 1
service plans under discussion.
5.1.1 Solution to Example 1
Graphical method: This method corresponds to entering the data from the payoff matrix with payoffs on the ordinates and mixed strategy on the abscissa. The vertical scale should be chosen such that, it must accommodate the entire range of payoffs involved; and, the horizontal scale extends from 0 to 1.
The subsequent steps are as follows:
1) Determination of the dominance and reduce the pay off matrix to (2 ´ N) size.
2) Graphical representation of the payoff. (The scales of the graph always represent the player with only two alternatives. The third alternative is removed as a result of dominance criterion). Illustrated in Figure 1 is the graphical solution under consideration.
3) Determination of the fractional (proportioned) use of alternatives by PSP in a mixed strategy.
4) Evaluation of value of the game to the PSP.
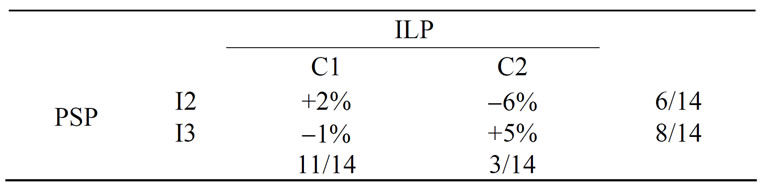
The proportioned (mixed) use of I2 and I3 by PSP can be determined by knowing the coordinates of the point of intersection of the corresponding lines drawn on the graph (Figure 1). The coordinates can be either directly read off from the graph or by solving the simultaneous equations of the lines. The equations for the lines can be determined from the geometry as: For I3, [y + 6x = 5]; and, for I2, [y – 8x = –6]. Hence solving them, the point of intersection is (11/14, 4/14). Suppose is the fractional use of I3 and 1) is the fractional use of I2. Now, consider the reduced payoff matrix shown in Table 3. In terms of q, it follows that, [(+ 2) ´ q + (1 – q) ´ (–1) º 11/14 º (–6 ´ q + (1 – q) ´ 5], solving which yields q = 6/14. Hence, (1 – q) = 8/14 as indicated on the reduced payoff matrix (Table 3). This leads to the conclusion that, the PSP should adopt 43 % effort on I2 strategy (deploying in-home displays of power usage) and 57% of effort on I3 strategy (ability to accommodate alternative energy).
If such a mixed proportion of efforts is exerted by the PSP, then what is its value of the game? This value refers to maximum advantage (gain) to the PSP, should the ILP follows optimum strategy. It is an expected value, EV (for PSP) and can be deduced (using the reduced payoff matrix indicated above) as follows:
EV(PSP) = [6/14 ´ 11/14 ´ (+ 2)]
+ [6/14 ´ 3/14 ´ (– 6)]
+ [8/14 ´ 11/14 ´ (– 1)]
+ [8/14 ´ 11/14 ´ (+ 5)] @ 1.92 %
The above calculation takes into account the mutually independent strategies of the PSP and the ILP and how their relative (proportionate) efforts weigh the percentages of payoff under possible alternatives are adopted.
Thus, by resorting to the mixed proportion of extending I2 and I3 strategies, the PSP is likely to gain a small revenue growth of about 1.92 % in the presence of the ILP adopting optimal strategy.
5.2 Nonzero-Sum/Two-Person Game Problem
The nonzero-sum game refers to situations in which all the game-players are either losers or winners in some respect or other. Typically, winning a war can be cited as an example, in which the reality is that nobody is a winner. The victor may apparently look like a winner, by taking the overall aspects of war; the victor suffers as much as the vanquished. Likewise, in a labor dispute that has been solved, both the workers and the management enjoy the fruit of victory in their own perspective of the gains resulted from bargaining. The game players in this case
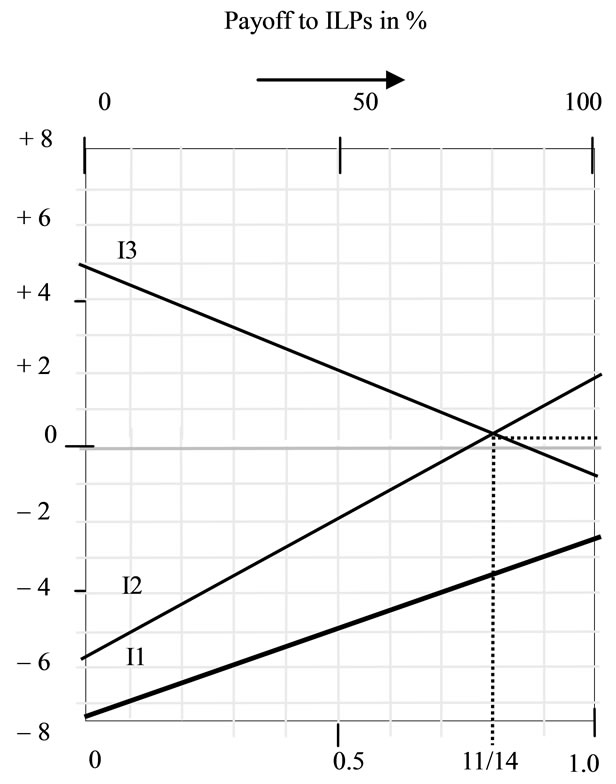
Figure 1. Graphical solution to the problem. (I1-alternative is not taken into the solution as it has less dominance than the other alternatives)
have implicitly colluded (against the consumers) so as to get something advantageous to themselves through bargaining. Such games are typically of nonzero strategies because any conciliatory measure accepted enforces one party to give up one or more of its alternative strategies in favor of the other.
The following example (Example 2) is presented to illustrate the underlying concepts. The nonzero problems in general, however, carry no unique solutions because of the unspecified chances of alternatives being given up by the game-players.
5.2.1 Example 2: A Non-Zero Sum Two-Person Game Problem
Cogeneration is the use of a heat engine or a power station to simultaneously generate both electricity and useful heat. Cogeneration captures the by-product heat for domestic or industrial heating purposes. It is most efficient when the heat can be used on site or very close to it. Overall efficiency is reduced when the heat must be transported over longer distances. Suppose an ILP employing smart-grid technology and a utility using cogeneration (CHP) are competing to extend power to industrial customers. The CHP is a competitor to the ILP and tries to attract industry by offering the following alternatives:
C1: Reduced rate based on contract length;
C2: Special discount for an industry agreeing that there will be high demand during peak time.
The ILP also attracts customers by offering the following alternatives:
I1: Special discount for industrial customers operating at night;
I2: Special discount for industries having distributed power available;
I3: ILP already has an existing smart-grid infrastructure for power access to serve some part of the service area in which the cogeneration company has no penetration yet due to technical reasons. I3 is intended to serve exclusively such areas.
Both ILP and the cogeneration utility (CHP) deploy advertisements on their services with equal competence. A market consultant presents the payoff matrix (shown in Table 4) on possible gains and losses for each possible outcome. The payoffs indicated represent the net change in revenue over a specific period resulting from competing promotional efforts of the competitors.
Suppose the utility functions uC(P) and uI(P) of the cogeneration-company(CHP) and the ILP versus the payoffs
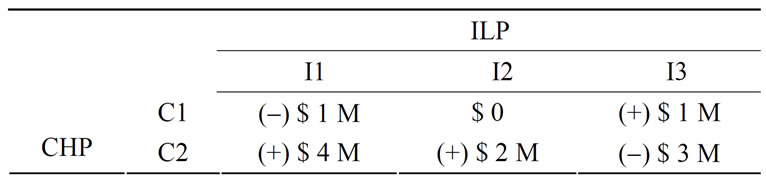
Table 4. Payoff matrix proposed by market consultant for the problem of Example 2
(in millions of dollars) are expressed respectively by the following functional relations based on empirical market considerations:
 (1)
(1)
It is interest to determine and discuss the revenue prospects and the related economy of the two competitors in reference to the services being marketed. Relevant pursuit is as follows:
5.2.2 Solution to Example 2
By converting monetary payoffs indicated above into “utility payoffs”, one can solve the associated problem. The underlying consideration is as follows: The CHP is relatively new and franchised to operate in the region under discussion. Its utility for the money can be assumed to directly proportional to the revenue earned or lost. On the contrary, the ILP extends across large regional boundaries but traditionally adopts a conservative management policy. Relevant utility function therefore, relies on the organizational policy and its attribution to one set of alternatives may not be the same for another set of alternatives.
Often, it is difficult to determine the utility index. It is a time-consuming and complex procedure that accounts for managerial perspective on a company’s aspiration level and expected standard of performance. It may involve some generous outlook to gain favor of customers as well as, may impose austerity measures to keep the losses a minimum. Small companies are flushed with ambition and carry the potentials of rapid growth, crash programs and diverse products and/or services. The major objective of management is to earn prestige and reputation so as to remain steady in the market (even at the expense of some tolerable losses). Its planning and engineering personnel will take the chance to play strategic games (or gamble!) in the competitive market. Larger companies, however, try to play the same game.
The utility function should be selected carefully lest the consequences of wrong and misconceived translation of payoff into utility index would lead to the company’s irreversible downfall. The readers may recall recent (1998-2001) IT-market scenario and compare the utility perspectives and market-attitudes of small start-up dotcom companies (with poured-in venture capitals) versus those of industries that had years of built-up infrastructure with large outlays that can be expressed in terms of their
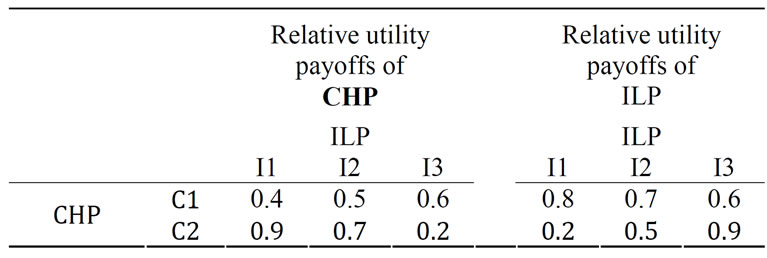
Table 5. Utility payoff matrices of Example 2
prominent presence, huge capital (or share worthiness) and mammoth work-force values. Perhaps, there was over enthusiasm (or wrong horses played the wrong horseplay!) on the part of many dotcom industries in projecting utility functions, out-of-proportion to the payoffs involved.
In short, the utility theory governs the value that can be attached to an outcome for any alternative and a given future. That value can vary among individuals or from one business to the other. Utility is very much policy-specific and is therefore, ardently unique to any given business or industry. It is a response of the business enterprise to the anticipated risk in a competitive market environment judged from the payoff involved.
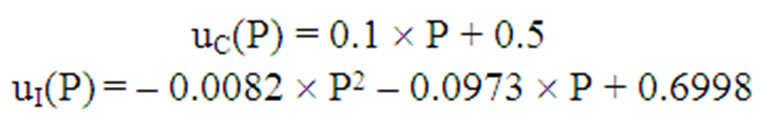
In this problem (Example 2), the utility versus payoff is specified in terms of utility functions, uC(P) and uI(P) of the cogeneration company and the ILP respectively as: [uC(P) = 0.1 ´ P + 0.5] and [uI(P) = – 0.0082 ´ P2 – 0.0973 ´ P + 0.6998]. The payoff denotes the fact that the gain of one competitor is loss to the other for any given alternative. Correspondingly, the larger utility perceived by one competitor amounts to a lesser utility perceived by the competitor (for that alternative). The utility functions indicated in the problem reflects this consideration by having opposite slopes of the functional relations, u = f(P).
Using the given utility functions, the payoff matrix can be translated into corresponding utility payoff matrices for the cogeneration-company and the ILP as shown in Table 5.
With the utility payoff data (as in Table 5), the next step is to construct the (utility) payoff graphs for the cogeneration CHP and the ILP as illustrated in Figures 2(a) and 2(b) respectively. As indicated in Example 1, the dominance criterion allows I2 alternative not to be considered in the evaluation. Further, by solving the equations of the intersecting lines of I1 and I3, the coordinates of the points of intersection in the two graphs are determined (as indicated on Figure 3). These coordinate values can be interpreted as follows: Considering the utility payoffs for the cogeneration CHP, the company can expect an average (relative) utility payoff of about 0.51 by resorting to its strategy alternative C1, to an extent of about 78 % of its time and efforts. The next part of exercise is to determine the fractions of (I1 and I3) that can be inferred from the utility graphs of Figure 2 as decided by the proportions of utility payoff percentages (C1 and C2) set along the abscissa of the graphs.
The results (obtained via the procedure indicated in Example 2) are tabulated in Table 6 (in bold faces). These results indicate that, in pursuing the strategy of adopting C1 at 78%, the cogeneration CHP compromises about 0.67 of its value (of the game) be consumed by the ILP, (if the ILP chooses to use about 33% of its time and efforts towards I1 and about 67% towards I3).
Using the results as above, if the ILP decides to make use of maximum strategy for its own utility payoffs, the
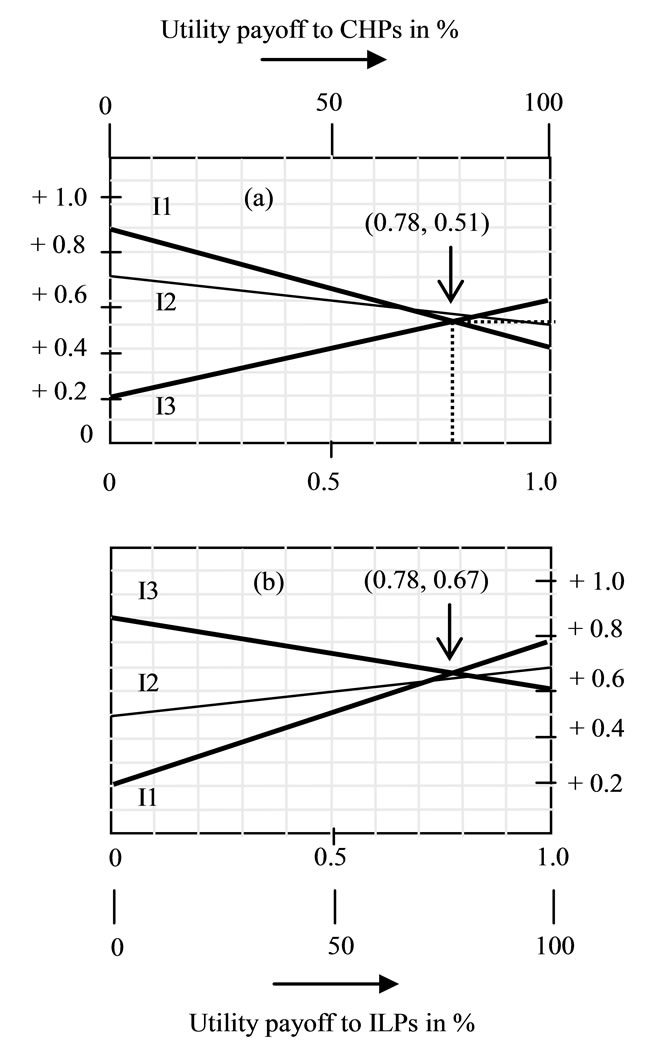
Figure 2. Utility payoff graphs of: (a) CHP and (b) ILP
value of the game, namely, EV(CHP) for the cogeneration CHP will not alter. This would keep both companies pleased and can be verified by the following calculation:
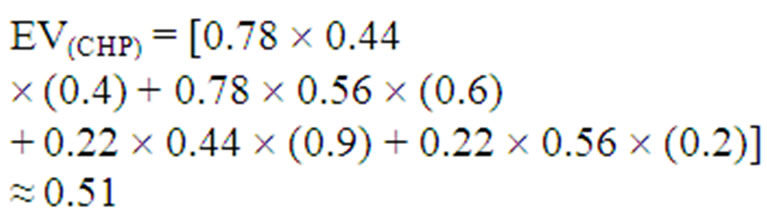 (2)
(2)
Further, the cogeneration company (CHP) will benefit slightly by getting a cash-gain of about $ 0.11 M in the game envisaged; and the ILP remains satisfied as a result of its high utility payoff (as implied by its utility function). Hence the strategies adopted by both sides would help maintain a status quo in the competitive market projected.
For mutually benefiting considerations in the competitive market, pursuance of certain other strategies that are based on compromising, collusive and conciliatory methods is possible. In maintaining the status quo as above, both companies may, however, find their approach expensive and difficult to manage. As such, the cogeneration CHP may wish to avoid competitive pursuit, if the ILP agrees to use 70% of its I2 alternative and 30 % of its I3 alternative in its implementations. Such an agreement will allow an average utility index of about, [0.70 ´ 0.70 + 0.30 ´ 0.20 =
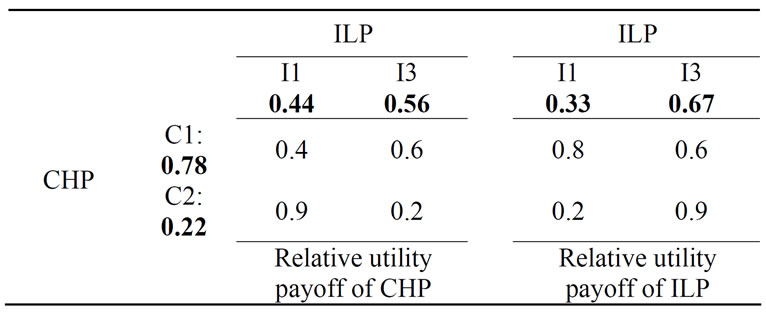
Table 6. Relative utility payoffs of the CHP and the ILP in Example 2
0.55] for the cogeneration CHP; and, the corresponding utility index for the ILP will be, [0.7 ´ 0.5 + 0.3 ´ 0.9 = 0.62]. There is also a compromise solution in which both companies may get equal utility payoff. For example, the ILP can refrain from using its (I1 and I2) alternatives and at the same time the cogeneration CHP should agree to use only its C1 strategy. This will yield a compromising solution of identical utility payoffs (of index equal to 0.6) to both of them. Thus, there are several ad hoc solutions feasible in the game-theoretic approach for bargaining dispositions when nonzero-sum situations are encountered.
6. Concluding Remarks
Thus, given a set of technology options, a payoff matrix strategy can be adopted to make right decisions as illustrated in the above examples. The problems indicated refer to a variety of constraints under which optimal payoff solutions are made via difference schemes of criteria-specifications.
REFERENCES
- “Smart Grid: Enabler of the New Energy Economy,” Electricity Advisory Committee, December 2008.
- http://www.oe.energy.gov/eac.htm
- D. Tuite, “For Power Design Opportunities, Try the Smart Grid,” Electronic Design, Vol. 58, January 2010.
- J. L. Riggs, “Engineering Economics,” McGraw-hill Book Company, New York, 1977.