Energy and Power Engineering
Vol. 4 No. 4 (2012) , Article ID: 20804 , 8 pages DOI:10.4236/epe.2012.44029
Hydrogen Production by Coal Gasification Coupled with in Situ CO2 Capture
Institute of Engineering Thermophysics, Chinese Academy of Sciences, Beijing, China
Email: xunwang@iet.cn
Received June 1, 2012; revised June 28, 2012; accepted July 10, 2012
Keywords: Kinetics Modeling; Gasification Temperature and Pressure; Products Compositions; Conversion Ratio
ABSTRACT
CO2 adsorption enhanced gasification process is a prospective technology to be used in hydrogen production with nearly zero CO2 emission. In this paper, a gasification kinetics steady state model is developed based on the chemical kinetics mechanism with the condition of fluidization. It is used to predict the parameters of gas phase and solid phase for a continuous flow reactor with steady state. The variation of components distribution with gasification temperature and pressure are determined, from which the optimal operation parameters of gasifier can be obtained.
1. Introduction
CO2 adsorption enhanced gasification processes [1,2] apply the concept of one step hydrogen production with in situ CO2 capture. Coal is gasified with steam and calcium based compounds in the absence of O2. The gasification reaction is coupled with carbonation reaction by mass and heat exchange. In these processes, hydrogen molar fraction in syngas can be higher than 80%. The remaining part is mainly methane and the content of CO2 is very low.
Above benefits enable CO2 adsorption enhanced gasification processes as one prospective technology to be used in hydrogen production with nearly zero CO2 emission. One of the key point of its research is how to predict the performance of gasification process. Experiment and unit theoretical model are two important ways to make it. Unit theoretical model is especially necessary in the systematic study of coal to energy process. In references [2-8], chemical equilibrium composition of mixture of C/coal with H2O and CaO is calculated by theoretical model based on Gibbs free energy minimization. The influence of gasification temperature, pressure, ratio of CaO/C and steam/C is investigated. The thermodynamic equilibrium model offers greater flexibility for complex reaction system with limited given conditions for which the reaction pathways are unclear. Usually some correction factors, such as temperature approach, carbon conversion ratio, are applied to improve predicttion precisions [8-11]. But in realistic condition, product distributions and conversion ratios of carbon and CaO depend on chemical kinetics and hydrokinetics, which is determined by reaction temperature, pressure and other factors. As a supplement of previous study, it is necessary to investigate gasification performance from the point of view of chemical kinetics and fluid hydrodynamic. Kinetics models have the advantage to directly illustrate the effect of pressure, temperature, reactants compositions and other parameters on product distributions and reactants conversion ratios. A dynamic simulation model of CO2 adsorption enhanced gasification processes is established in reference [12]. It is used to study the influences of reaction conditions on the proportion of the reactants. However, there are some drawbacks of kinetics model. Prediction precision is highly dependent on the kinetics parameters, which are usually measured and deduced from experiments that conducted under some specific conditions (e.g. coal rank, reactor type and operation conditions, etc.). So deviation of simulation assumptions from experiment conditions will lead to prediction errors. Furthermore, more inputs and more detailed feed streams characteristics are required when kinetics models are applied.
Comparing with previous work, some changes about gasifier modeling can be made as follows. 1) Because the variation of solid compositions and flow rate are not taken into account in the dynamic model developed in reference, it is necessary to set up mass and energy conservation equations of solid phase, which is required when analyzing the mass and heat interaction between syngas production section with regenerator and other parts; 2) The results calculated from dynamic model vary with reaction time, which make it difficult to be used in steady state systematic performance analysis. A steady state gasifier model based on the kinetics mechanism and with the condition of fluidization should be set up.
Summarily, in this paper, a steady state gasifier model is developed based on kinetics mechanism and with the condition of fluidization. It is used to predict parameters of gas phase and solid phase of a continuous flow reactor at steady state. The variations of components distributions with gasification temperature and pressure are determined, from which the optimal operation parameters of gasifier can be obtained.
2. H2 Rich Syngas Production with CO2 Sorption Enhanced Coal Gasification
As shown in Figure 1, CO2 adsorption enhanced coal gasification is divided into two reactors, namely a syngas production reactor (SPR) with CO2 sorption and a absorbent regeneration reactor (RER). The mass and heat flux are transferred by recycling solid particles. In SPR, carbon contained feedstock reacts with steam and calcium compound. Pyrolysis reaction, gasification reaction and carbonation reaction are integrated into SPR. Carbon is converted to syngas and meanwhile, CO2 released from gasification reactions is absorbed by calcium based absorbent. Syngas is composed of H2 with 60% - 95% molar fraction and methane with 5% - 40% molar fraction. CO2 and CO content can be lower than 1%. Calcium carbonate produced together with ash, unconverted carbon and CaO are discharged to the regenerator to be calcined in the atmosphere of H2O and CO2. CaO regenerated is recycled to SPR. CO2 from calcinations is released at nearly pure state, which make its possible to capture with relatively lower cost. In the above process, high temperature particles feeding to SPR are not only act as absorbent, but also as heat carrier to provide heat for endothermal reactions.
The production of syngas in SPR can be explained by the following reactions:

Figure 1. CO2 adsorption enhanced gasification process.
C(s) + H2O(g) ↔ CO(g) + H2(g) + Q
C(s) + CO2(g) ↔ 2CO(g) + Q
C(s) + 2H2(g) ↔ CH4(g) – Q
CO(g) + H2O(g) ↔ CO2(g) + H2(g) – Q
CH4(g) + H2O(g) ↔ CO(g) + 3H2(g) + Q
CaO(s) + CO2(g) ↔ CaCO3(s) – Q
CaO(s) +H2O (g) ↔ Ca(OH)2(s) – Q
3. Performance Prediction Model of CO2 Adsorption Enhanced Coal Gasifier
3.1. Coal Properties and Model Assumptions
Shen-mu coal is used as the feedstock of systems analyzed in this paper. It contains 65.2% C, 4.63% H (ultimate analysis, daf basis) and 54.8% fixed carbon, 28.15% volatile (proximate analysis, daf basis).
The following are some assumptions and limitations of the model: 1) It is assumed that the coal conversion process can be divided into a pyrolysis zone and a gasification zone. Devolatilization is completed instantaneously and then products from coal pyrolysis including volatile and char react with steam and CaO in gasification section; 2) Solid phase is treated as continuous stirred flow; 3) Solid components including char, ash, calcium compound, are distributed homogenously in the reactor; 4) Gas phase is composed of H2, CH4, CO2, CO, H2O, H2S, N2 and treated as plug flow; 5) Gas components are assumed to be functions of the height of gasification section; 6) Temperature is homogeneous in the syngas production reactor (SPR). Ca(OH)2 is not included in reaction system; 7) Surplus heat generated in reactor is removed by steam generation.
3.2. Mass Balance of Syngas Production Reactor
During pyrolysis process, coal is converted into volatile and char instantaneously after it is fed to the furnace. Volatiles are assumed to be composed of CH4, CO, CO2, H2, H2O, N2 and H2S. According to the prediction method in reference [13], mass fractions of coal pyrolysis products are calculated.
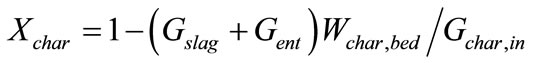
The input parameters for gasification section include: flow rates, compositions of pyrolysis products, appointed gasification temperature (or QST: appointed heat exchanged with cooling agent), appointed gasification pressure, appointed steam parameters (flow rate, inlet temperature and pressure), appointed absorbent parameters (inlet temperature, pressure, compositions and flow rate). Output parameters include: conversion ratios of char (Xchar) and CaO (XCaO), coal to H2 efficiency, cold gas efficiency, gases distributions along height of reactor, calculated compositions and flow rates of bed materials and discharged solid, calculated yield and composition of hydrogen rich syngas, calculated QST (or calculated operation temperature).
3.2.1. Mass Balance of Solid Phase in Gasification Zone
 (1)
(1)
 (2)
(2)
 (3)
(3)
 (4)
(4)
 (5)
(5)
 (6)
(6)
 (7)
(7)
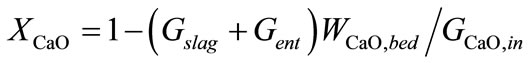
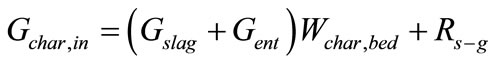
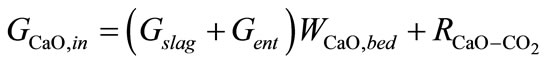
Equations about solids phase in gasification section are composed of definitions of conversion ratio of char and CaO, components (char, ash, CaCO3, CaO) mass balance, mass balance of bed materials. Where, Symbol Xchar and XCaO means conversion ratio of char and CaO respective. Symbols G means mass flow rate. Symbol Wi,j means mass fraction of component i contained in control volume j, j = bed, ent, slag. Symbols bed, ent and slag mean bed material, entrained solid in raw hydrogen rich syngas and slag respectively. Symbol R means chemical reaction rate. It is assumed that compositions of solid entrained in raw syngas stream and discharged as slag are of the same compositions with that of bed material.
3.2.2. Mass Balance of Gas Phase in Gasification Zone
Along the direction of gasification reactor height L, reaction zone is divided into numbers of cells in which mass balance for each gas components is set up. In each cell, the mass balance of component i is expressed as:
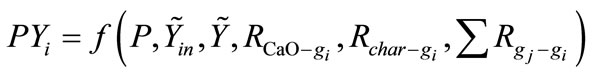
One specific gas flow rate is determined by its flow rate and chemical reaction rates with other gases and solids, where symbols P, T are the total pressure and temperature of SPR section.  is the molar fraction vector of gases. Ri-j means reaction rate of reaction between component j and i. Symbols g and s mean gas phase and solid phase respectively.
3.2.3. Chemical Kinetics Rates in Gasification Zone
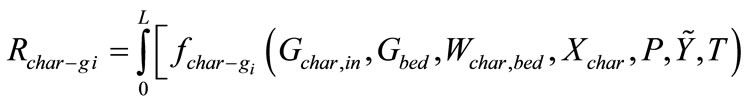
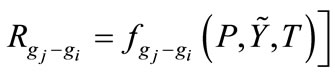

Chemical kinetics rates of gas-solid reactions, gas-gas reactions are determined by reaction temperature, total pressure, molar fractions of gases, solid contents, and hydrodynamic parameters, where f is a function of several variables. It stands for reaction rate and the definition can be found in references [14-16].
3.3. Energy Balance of Syngas Production Process (Pyrolysis Zone + Gasification Zone)
Pyrolysis sub-reactor and gasification sub-reactor are put together to model energy balance. At given input parameters (steam and absorbent flow rates, gasification pressure, reactor heat loss, and appointed gasification temperature/or appointed heat QST transferred with heating/cooling medium), the result of heat QST or gasification temperature can be calculated. Enthalpies of components are defined according to reference [17].
3.4. Model Solution Methodology
Figure 2 shows the simulation procedure of SPR. Its main inputs are coal properties, ratio of CaO to coal, ratio of steam to coal, reaction pressure, reaction temperature (or heat exchanged with medium), reactor parameters (height, superficial velocity, bed materials loading). Outputs include gas compositions and yields, solid phase compositions, discharged solid, solid entrained by gas, heat exchanged with medium (or temperature). Carbon conversion ratio, CaO conversion ratio and gas compositions distributions along height of reactor are estimated and determined by iteration procedure.
3.5. Comparison with Experimental Results
In Tables 2(a)-(b), calculation results based on model described above and data of experiment and demonstration plant are compared. In Table 1(a), running results of commercial Winkler gasifier and U-gas demonstration fluidized bed are collected from reference [10]. In Table 2(b), experimental data are got from a continuous experiment high pressure reactor [18] fed by Taiheiyo coal. Reaction temperature is set at 650˚C. The description of test rigs and more detailed experiment results can be found in references.
Table 2(a) shows the percentage deviations of H2 and CO compositions between computed and experimental gas compositions are less than 20%. In Table 2(b), it can be seen that the variation tendencies of gas molar fraction with temperature are coincident with that of experiment. The maximal prediction error of H2 molar fraction is 6.6%. But prediction errors of CO2, CO and CH4 molar fractions are quite high. In Table 2(b), it is found that the
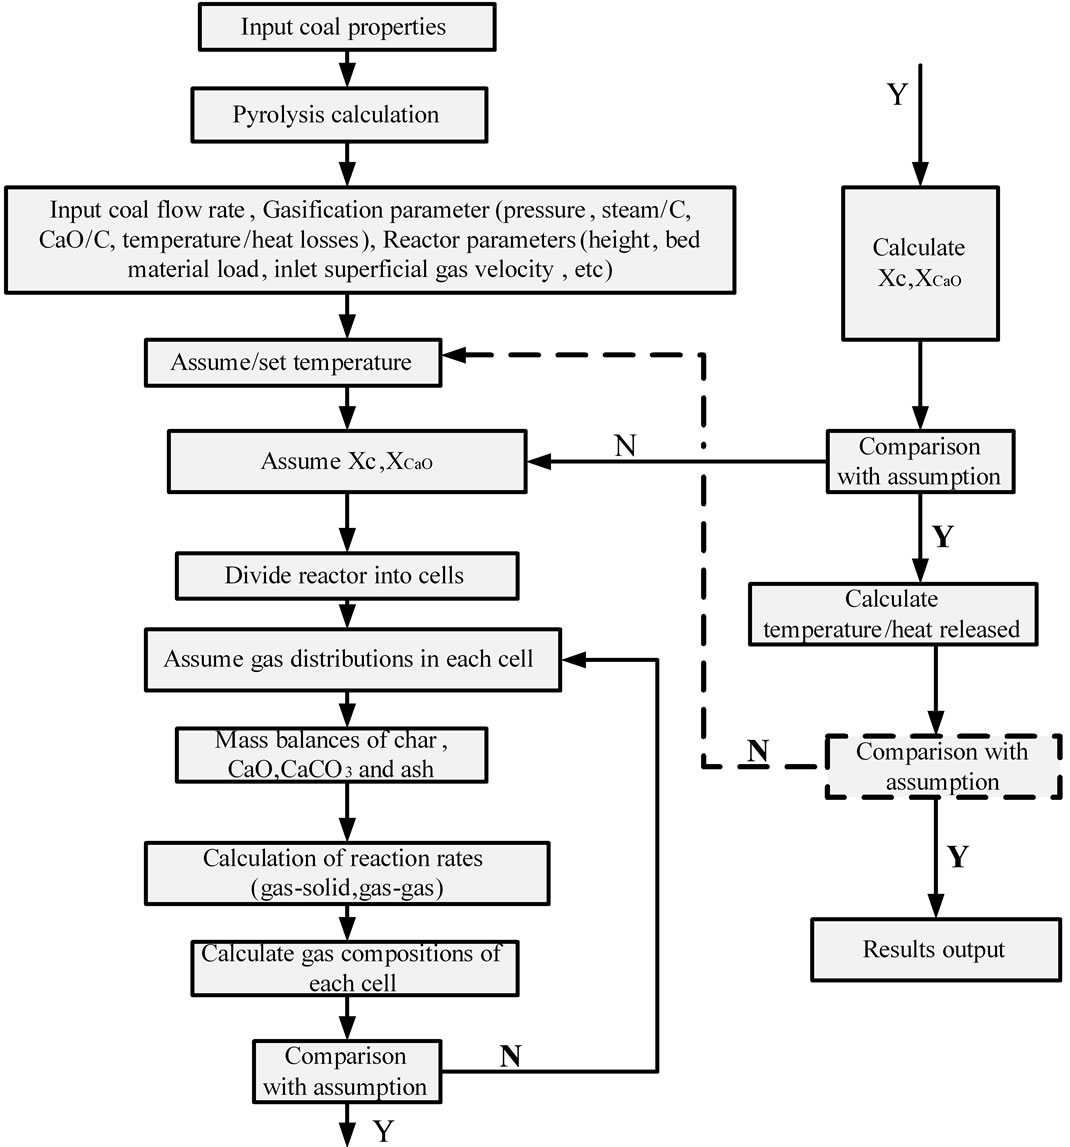
Figure 2. Model solution methodology.

Table 1. Properties of Shen-mu coal.
prediction results of H2 compositions are near to that of experiment. But the methane molar fraction shows different variation trend with pressure. This maybe result by that, in flow type reactor, the product gases leave the bed quickly. The generation rate of methane by reaction C+ 2H2− à CH4 is not evident. But in theoretical model, this reaction rate is considered to be direct proportion to pressure. And methane shortcut is not considered in theoretical model.
The comparison results show that the H2 molar fraction predicted by theoretical model is near to that of experiment and pilot plant. Theoretical model can be applied in system study. But it should be improved to increase prediction precision of CO2, CO and methane. More factors should be considered to improve the model prediction precision, including the use of improved semiexperiential parameters of devolatilization model, to adopt comprehensive hydrodynamic model, more detailed consideration about residue time and shortcut gas, and to improve semi-experiment parameters of chemical kinetics model, etc.
4. Influence of Temperature and Pressure on Syngas Production Process
4.1. Performance Indicators and Definitions
Coal to hydrogen efficiency (Xcoal-eg), Char conversion ratio (Xchar) and Caladium conversion ratio (XCaO) are used to evaluate gasification performance. Coal to hydrogen efficiency (Xcoal-eg) is defined as that given in reference [2]. Char conversion ratio (Xchar) means the char converted to syngas to carbon contained in feedstock. Caladium conversion ratio (XCaO) is the ratio of the
 (a)
(a)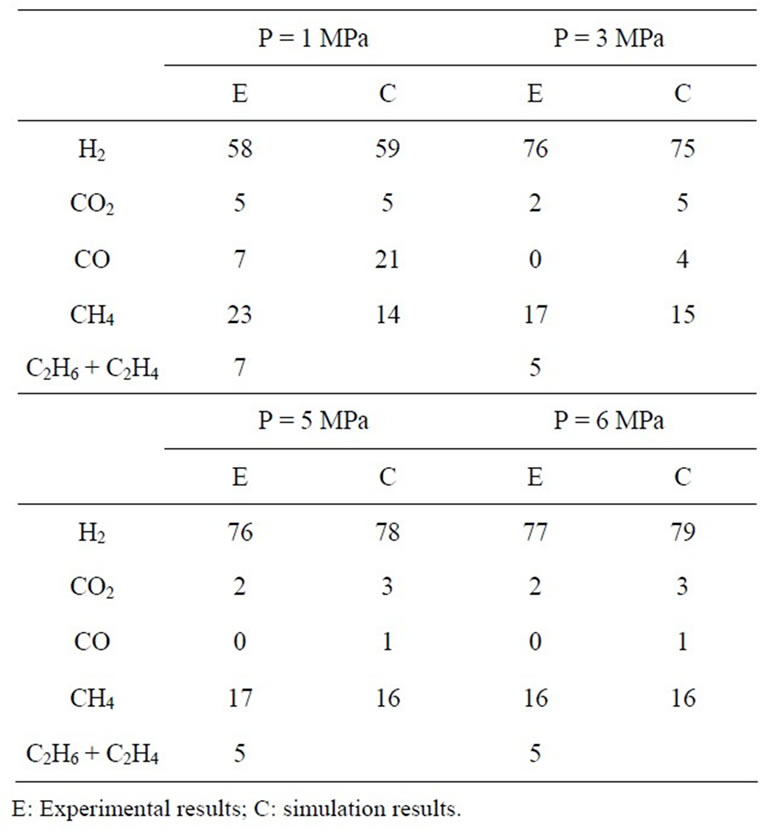 (b)
(b)
Table 2. (a) Comparison between fluidized gasification [11]; (b) Comparison with experiment results of reference [18].
amount of caladium in the form of generated calcium carbonate to total amount of CaO input.
With chemical kinetics model proposed in Section 3.2.3, the effect of temperature and pressure on gasifier performance can be plotted. Results are shown in Figures 3-5, where temperature and pressure are appointed and independent. Variable QST is calculated from reactor heat balance. It means the ratio of the extra heat needed for heating or cooling to the coal input thermal energy.
4.2. The Variation of Gas Composition with Temperature, Pressure
Variation of H2 molar fraction shown in Figure 3(a) illustrates that the maximal hydrogen molar fraction around 82% - 84% can be obtained in the temperature range of 675˚C - 840˚C and pressure range of 1 - 4.5 MPa. The variation of H2 molar fraction is relatively small in the above ranges. In the region of temperature greater than 850˚C and pressure lower than 0.5 MPa, the H2 molar fraction is lowest and only around 54% - 56%. Under this operation condition, CO2 partial pressure is smaller than CO2 equilibrium pressure and CO2 can not be captured by absorbent which result in large amounts of CO2 in that region. Simulation results show that pressure and temperature are important for hydrogen molar fraction. It can be increased greatly with CO2 captured by CaO with suitable pressure and temperature.
Figures 3(b) and (c) are two sectional figures from X and Y directions of Figure 3(a) respectively, in which pressure are set to 2.5 MPa and temperature set to 750˚C respectively. Sensitive studies show that evaluated by H2 molar fractions, the optimal operation range of temperature is 700˚C to 750˚C with pressure varies from 2 to 3 MPa. Based on this result, pressure is set to 2.5 MPa in Figure 3(b) with temperature varies from 600˚C - 1050˚C.
At a given pressure and evaluated by kinetics, the reaction rates are speed up with the increase of reaction temperature. However, from the point of view of thermodynamic equilibrium, increase temperature is disadvantage to exdothermal reactions, e.g. CO conversion by shift reaction and CO2 capture by carbonation reaction. Thus there should be a trade-off between these factors. At temperature of 750˚C, the maximum H2 molar fraction can be achieved. At lower temperature, CO2 partial pressure is higher than its equilibrium pressure and CO2 can be captured by CaO continuously. CO2 content decreases with temperature increase and at temperature 700˚C, the CO2 content is the lowest. If temperature increases further, the differences between CO2 partial pressure and equilibrium pressure decline and the ability for CaO to absorb CO2 declines. With temperature higher than 950˚C, carbonation reaction stops because of higher CO2 equilibrium pressure. As shown in Figure 3(c), similar to the influence of temperature, there is an optimal pressure at which H2 content is highest. Methane
 (a)
(a)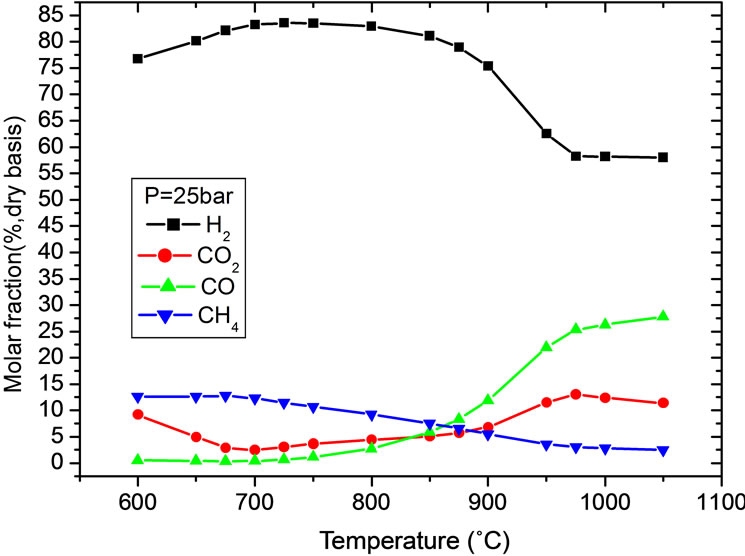 (b)
(b)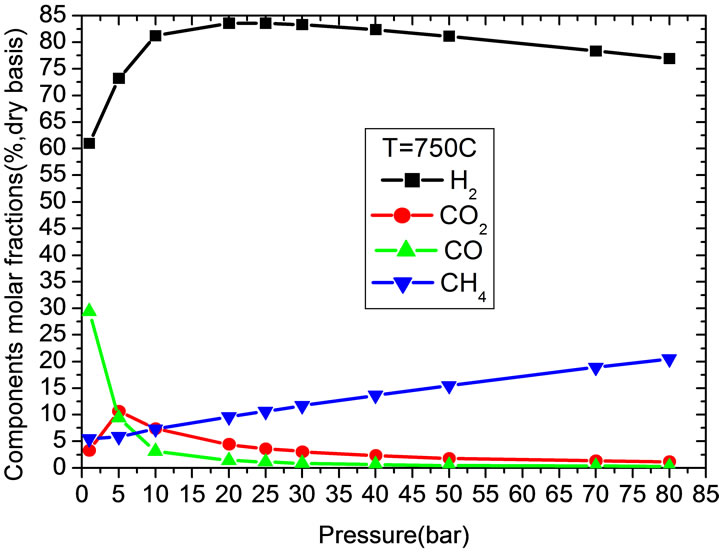 (c)
(c)
Figure 3. Gas compositions variations with temperature and pressure. (a) Effect of temperature and pressure on H2 molar fraction; (b) With temperature; (c) With pressure.
molar fraction will increase with pressure. At pressure lower than 0.5 MPa, carbonation reaction can not proceed because of low CO2 partial pressure. CO2 content increases with pressure in this range. At pressure higher than 0.5 MPa, carbonation reaction plays an important role on syngas compositions. CO2 and CO contents decline quickly with pressure. At pressure higher than 5 MPa, the contents of CO2 and CO are very low and their variations are small.
The influences of CaO activity on syngas compositions are also investigated. Results show that with CaO activity decline from 100% to zero, H2 molar fraction decreases from 80% to 57% and the CO2 molar fraction increases from around 1% to 22%. Thus to maintain high CaO activity is important to suppress CO2 concentration in syngas.
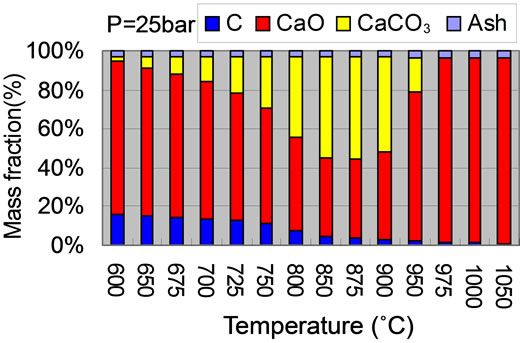
4.3. Influence of Temperature and Pressure on Solid Compositions
Figure 4 gives the solid compositions variation with pressure and temperature. With the given pressure of 2.5 MPa and temperature in the range of 850˚C - 875˚C, the CaCO3 weight fraction in solid is the highest as shown in Figure 4(a). Corresponding, the CaO mass fraction is the lowest. With temperature lower than 600˚C or higher than 950˚C, the rate of carbonation reaction is very slow and nearly closes to zero, there is almost no CaCO3 in solid. Carbon conversion is speed up with the increase of temperature. At temperature higher than 950˚C, almost all carbon is converted to syngas. With the given temperature of 750˚C, CaO conversion ratio increases with pressure as shown in Figure 4(b). But at pressure higher
 (a)
(a)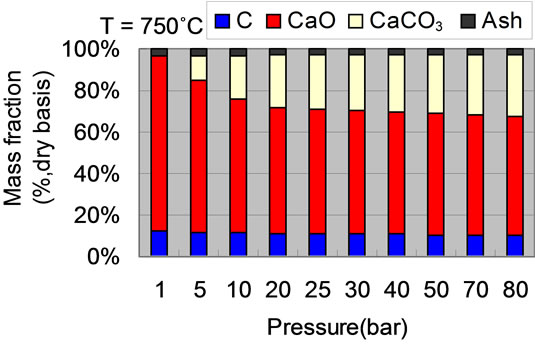 (b)
(b)
Figure 4. Solid compositions variations with temperature and pressure. (a) With temperature; (b) With pressure.
than 4 MPa, mass fractions of CaO and CaCO3 vary slightly. Comparing to temperature, the effect of pressure on carbon conversion ratio is less important than that of temperature. At ambient pressure, there is no CaCO3 due to no CaO reacts with CO2.
4.4. Coal to H2 Efficiency and CaO Conversion Ratio Variation with Temperature and Pressure
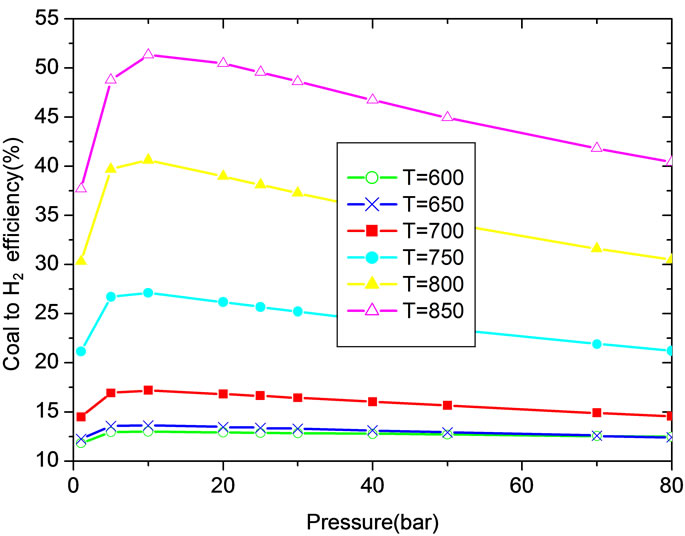
Figure 5(a) shows the effect of temperature and pressure on coal to H2 efficiency. It can be seen when the temperature is lower than 850˚C, coal to H2 efficiency can be increased evidently with temperature increase. The optimum operation range for pressure is 1 - 4.5 MPa when temperature is varied from 750˚C to 840˚C. For a given temperature, there exists a pressure at which coal to H2 efficiency is the highest.
As plotted in Figure 5(b), the carbonation reaction procedure is benefit with the increase of pressure, especially at higher temperature. With pressure higher than 2 MPa and temperature lower than 800˚C, the influence of pressure on CaO conversion ratio is not obvious. For a given pressure, there is an optimal temperature at which the CaO conversion ratio is the highest and the optimal temperature increases with pressure. The simulated results agree well with reference [2].
5. Conclusions
This paper presents a new approach for hydrogen and power co-production. It is based on coal gasification with
 (a)
(a) (b)
(b)
Figure 5. Effect of temperature and pressure on conversion ratio. (a) Coal to H2 efficiency; (b) CaO conversion ratio.
in situ CO2 capture. The influences of plant configuration and gasification operation parameters (temperature and pressure) on the performance of SPR process are investtigated. From analysis, it shows that:
• With the operation temperature in the range of 675˚C to 840˚C and pressure in the range of 1 MPa to 4.5 MPa, the highest hydrogen molar fraction, i.e. 82% - 84%, can be obtained and the variation of H2 molar fraction is relatively mild in the process. With the given pressure of 2.5 MPa and temperature in the range of 850˚C - 875˚C, the CaCO3 weight fraction in solid is the highest.
• For a given temperature, there exists a pressure at which coal to H2 efficiency is the highest. The optimum operation range for pressure is 1 MPa to 4.5 MPa when temperature is varied from 750˚C to 840˚C. For a given pressure, there is an optimal temperature at which the CaO conversion ratio is the highest and the optimal temperature increases with pressure.
• More related factors should be included to improve the model precision and to improve the feasibility of the proposed technique, including more detailed hydrodynamic modeling, consideration of the influence of absorbent cyclic characteristics and eutectic problem of calcium based compounds, etc.
6. Acknowledgements
The authors would like to thank National Natural Science Foundation of China (51176186) for sponsoring the research.
REFERENCES
- K. V. Lobachyov and H. J. Richter, “High Efficiency Coal Fired Power Plant of the Future,” The Proceeding of Efficiency, Costs, Optimization, Simulation and Environmental Aspects of Energy System, Stockholm, 25-27 June 1996, pp. 591-597.
- S. Y. Lin, M. Harada, Y. Suzukiv and H. Hatanob, “Hydrogen Production from Coal by Separating Carbon Dioxide during Gasification,” Fuel, Vol. 81, No. 16, 2002, pp. 2079-2085. doi:10.1016/S0016-2361(02)00187-4
- S. Y. Lin, “Process Analysis for Hydrogen Production by Reaction Integrated Novel Gasification (HyPr-RING),” Energy Conversion and Management, Vol. 46, No. 6, 2005, pp. 869-880. doi:10.1016/j.enconman.2004.06.008
- J. Guan, Q. H. Wang, Z. Y. Luoand and K. F. Cen, “Optimization and Performance Prediction of a New Near Zero Emissions Coal Utilization System Will Combined Gasification and Combustion,” Proceedings of the CSEE, Vol. 26, No. 9, 2006, pp. 7-13.
- Z. H. Wang, J. H. Zhou, Q. H. Wang, J. R. Fan and K. F. Cen, “Thermodynamic Equilibrium Analysis of Hydrogen Production by Coal Based on Coal/CaO/H2O gasification System,” International Journal of Hydrogen Energy, Vol. 31, No. 7, 2006, pp. 945-952. doi:10.1016/j.ijhydene.2005.07.010
- H. F. Nicholas and T. H. Andrew, “Hydrogen Production from Biomass Coupled with Carbon Dioxide Capture: The Implications of Thermodynamic Equilibrium,” International Journal of Hydrogen Energy, Vol. 32, No. 17, 2007, pp. 4119-4134. doi:10.1016/j.ijhydene.2007.06.016
- S. Y. Lin, Y. Suzuki, H. H. Atano and M. Harada, “Hydrogen Production from Hydrocarbon by Integration of Water-Carbon Reaction and Carbon Dioxide Removal (HyPr-RING Method),” Energy & Fuels, Vol. 15, No. 2, 2001, pp. 339-343. doi:10.1021/ef000089u
- T. Pröll and H. Hofbauer, “H2 Rich Syngas by Selective CO2 Removal from Biomass Gasification in a Dual Fluidized Bed System-Process Modelling Approach,” Fuel Processing Technology, Vol. 89, No. 11, 2008, pp. 1207- 1217. doi:10.1016/j.fuproc.2008.05.020
- N. Jand, V. Brandani and P. U. Foscolo, “Thermodynamic Limits and Actual Product Yields and Compositions in Biomass Gasification Processes,” Industrial Engineering Chemistry Research, No. 45, No. 2, 2006, pp. 834-843. doi.:10.1021/ie050824v
- X. Li, J. R. Grace, A. P. Watkinson, C. J. Lim and A. Èdenler, “Equilibrium Modeling of Gasification: A Free Energy Minimization Approach and Its Application to a Circulating Fluidized Bed Coal Gasifier,” Fuel, Vol. 80, No. 2, 2001, pp. 195-207. doi:10.1016/S0016-2361(00)00074-0
- A. P. Watkinson, J. P. Lucas and C. J. Lim, “A Prediction of Performance of Commercial Coal Gasifiers,” Fuel, Vol. 70, 1991, pp. 519-527. doi:10.1016/0016-2361(91) 90030- E
- J. Guan, “The Mechanism Study of a New Near Zero Emissions Coal Utilization System with Combined Gasification and Combustion,” Ph.D. Thesis, Zhejiang University, Hangzhou, 2007.
- M. David, “Mathematical Models of the Thermal Decomposition of Coal 1—The Evolution of Volatile Matter,” Fuel, Vol. 62, 1983, pp. 534-539. doi:10.1016/0016-2361 (83)90222-3
- G. S. Liu and S. Niksa, “Coal Conversion Sub-Model for Design Applications at Elevated Pressures. Part II. Char gasification,” Progress in Energy and Combustion Science, Vol. 30, 2004, pp. 679-717. doi:10.1016/j.pecs.2004.08.001
- V. Biba, J. Macak, E. Klose and J. Malecha, “Mathematical Model for the Gasification of Coal under Pressure,” Industrial and Engineering Chemistry Process Design and Development, Vol. 17, No. 1, 1978, pp. 92-98. doi:10.1021/i260065a017
- L. Han, Q. H. Wang, Q. Ma, C. J. Yu, Z. Y. Luo and K. F. Cen, “Kinetics Study on CaO Carbonation Reaction at Pressurized Conditions,” Proceedings of the CSEE, Vol. 29, No. 14, 2009, pp. 41-46.
- S. Sundaresan and N. R. Amundson, “Studies in Char Gasification—A Lumped Model,” Chemical Engineering Science, Vol. 34, 1979, pp. 345-354. doi:10.1016/0009-2509(79)85066-6
- S. Y. Lin, M. Harada, Y. O. Suzuki and H. Hatano, “Continuous Experiment Regarding Hydrogen Production by Coal/Cao Reaction with Steam (I) Gas Products,” Fuel, Vol. 83, No. 7-8, 2004, pp. 869-874. doi:10.1016/j.fuel.2003.10.030.