World Journal of Mechanics
Vol.2 No.3(2012), Article ID:20008,9 pages DOI:10.4236/wjm.2012.23019
Evaluation of the Reliability Performance of Failure Criteria for Composite Structures
Offshore, Process and Energy Engineering Department, Cranfield University, Cranfield, UK
Email: a.kolios@cranfield.ac.uk
Received February 10, 2012; revised March 10, 2012; accepted April 21, 2012
Keywords: Composite Members; Stochastic Response Surface Method; Tsai-Hill and Tsai-Wu Failure Criteria
ABSTRACT
Evolution of materials, following the design requirements of special structures, has shifted interest towards development of composite members able to meet strength requirements “tailored” to specific applications. These members can provide appropriate, more cost effective structures, however absence of generic design guidelines raise constraints towards derivation of optimized structures. Reliability-based assessment can overcome this limitation by ensuring that acceptable levels of target reliability are achieved throughout their service life. This paper presents a methodology for reliability assessment of composite members based on appropriate limit state functions derived according to fundamental failure criteria, Tsai-Hill and Tsai-Wu, applicable to composite materials. The methodology that is proposed employs a Stochastic Response Surface Method (SRSM) which combines in discrete steps FEA modelling, numerical simulations and analytical probabilistic assessment techniques, allowing use of commercial and custom developed specialized numerical tools. Application of the proposed methodology on a complex composite structural geometry will illustrate its efficiency and evaluate the reliability performance of the limit states derived and examined.
1. Introduction
The increasing trend of the use of composite materials has shifted great interest lately towards optimization of corresponding design processes. The design of composite components is typically performed using deterministic methods in order to predict the local behaviour of the material under the specified conditions of loading and constraints. Limitation of this deterministic approach is related to the uncertainties inherent in the mechanical behaviour of materials and related to the load which the component is subjected during its service life. In practice these two aspects can be treated deterministically by introducing the use of safety factors, resulting to non-optimal employment of the materials and its characteristics, neglecting concepts of structural reliability.
In order to overcome the above fact, probabilistic concepts can be employed accumulating in a single indicator, that of reliability, the level of structural integrity of a structure subject to stochastic loads. This practice has been successfully implemented over the last decades in applications with highly random inputs or minimum failure tolerance such as nuclear [1], aviation [2], offshore [3,4], and critical infrastructure [5,6]
This paper presents a methodology for probabilistic assessment of composite materials, which allows estimation of the reliability of composite structures based on relevant failure criteria, Tsai-Hill and Tsai-Wu, with a combination of a Stochastic Response Surface Method (SRSM), Finite Element Analysis (FEA) simulations and employment of analytical methods for calculation of reliability, such as First Order Reliability Method (FORM). Application of the methodology on a typical F1 racing car front wing composite structure will illustrate its efficiency and evaluate the reliability performance of the different failure criteria that have been examined.
2. Failure Criteria for Composite Members
2.1. General
A universal definition for failure, can describe the situation “when the component can no longer fulfil the function for which it was designed” [7]. In this general definition, besides the state of complete fracture, secondary conditions, such as that of excessive deflection or a simple matrix cracked should be considered. Among the numerous ways to describe failure, the most evident one seems to happen when complete separation occurs. It is quite evident that in such case the part will no more carry the loads it was designed to. To assess failure, an appropriate criterion should be employed as for isotropic materials.
For homogeneous isotropic materials, many reliable criteria exist, intending to evaluate different aspects. For example Rankine developed a criterion based on the maximum normal stress, Tresca on the maximum shear stress and von Mises on maximum distortional (deviatoric) energy [8]. Criteria for composites have been derived based on those fundamental ones, introducing the anisotropic properties under the assumptions of stressstrain linearity and homogeneity of the material.
Before considering laminates, it is necessary to start from the observation of one single ply, for which five basic failure modes have already been defined: Longitudinal tensile, Longitudinal compressive, Transverse tensile, Transverse compressive, Shear. The strengths in the principal material axes can be used as reference values to assess the failure.
To define the strength of a loaded lamina, it is possible to apply failure criteria, generally classified into three categories [7]:
• Limit criteria (simple with individual stresses);
• Interactive criteria (interaction of multi-axial stresses allowed);
• Hybrid criteria (combined selected aspects of the above two).
This paper will examine interactive criteria in order to perform a structural reliability assessment; in particular the Tsai-Hill and Tsai-Wu failure criteria. These criteria are formulated in order to consider the interactions among actual and allowable stresses.
2.2. Deviatoric Strain Energy Theory (Tsai-Hill)
The Tsai-Hill criterion is an extension to Hill’s anisotropic failure study that was derived from the Von Mises yield criterion for metals [9]. In it, deviatoric energy is used in an extensive way to assess isotropic ductile metals.
The von Mises criterion was the starting point for Hill to characterise failure in anisotropic ductile metals, considering specific parameters to define the anisotropic properties of the material. Azzi and Tsai [10] found the relation between those parameters and the strength parameters of a lamina, adapting the criterion to orthotropic composites.
The general expression of the Tsai-Hill criterion is [11]:
 (1)
(1)
In this, as in all other interactive criteria, only one equation must be satisfied, while the limit criteria need five different equations to be considered. Drawback of the Tsai-Hill criterion is that it does not differentiate tensile from compressive stresses.
2.3. Interactive Tensor Polynomial Theory (Tsai-Wu)
Tsai and Wu modified the tensor polynomial theory proposed by Gol’denblat and Kopnov [12], by considering the existence of a failure surface in the stress space [13]. Their purpose was to overcome the disadvantages of the Tsai Hill criterion. The general notation expresses:

where  and
and  are respectively the second and fourth order strength tensors.
For a plane state of stress, after the expansion of all terms, the calculation and reduction of some of them, the Tsai-Wu criterion can be written as [11]:
 (2)
(2)
This equation can be used to assess failure in a composite lamina and the coefficients’ expressions can be found below [11].
Coefficients for longitudinal strengths:
Coefficients for transverse strengths:
Coefficient for shear strength:
Interaction coefficient:

This failure criterion can distinguish between tensile and compressive stresses due to appropriate coefficients and can be easily incorporated in automated computational procedures.
2.4. Comparison of Failure Criteria
The left-hand side of the limit state inequalities of the failure criteria is referred to as Failure Index (FI) and can be used to define the reserve strength of the lamina. Starting from this, the strength of a component can be obtained by the Strength Ratio (SR), which is defined as “the ratio by which the load must be factored to just fail” [14]. It is important to point out that SR is not always the reciprocal of the FI. In fact, for Tsai-Hill criterion it can be defined as [14]:
 (3)
(3)
while for Tsai-Wu criterion it is [14]:
 (4)
(4)
which is solution for equation:
where, using the previous Tsai-Wu formulations for coefficients , the following parameters can be calculated as:

Alternatively, the Margin of Safety (MoS) can be employed for both the criteria as:
 (5)
(5)
The margin of safety provides a more intuitive understanding, than FI and SR, of what is actually happening in the material. In fact, in a component subjected to a certain stress field, when  (negative or null value) there is a failure. Whereas, if
  (positive value) the material will be safe and the larger it is the safer.
3. Structural Reliability Assessment
3.1. Introduction to Structural Reliability Analysis
Traditionally, the methods used for the assessment or the design of a structure are based on safety factors, partial or global, usually derived from the experience gained on the field, and take into account the total uncertainty on the model. This practice, does not consider the effect of the scheme of calculation employed, or the uncertainties of the several design variables. A probabilistic approach, on the contrary, can deal in a systematic way with the different types of uncertainties included in the design, through a methodological procedure, characterizing with a degree of confidence the level that the design specifications are met.
Reliability Analysis (RA) is the technique that allows the estimation of the joint probability of non-fulfilment for each of the functional requirements mathematically expressed through corresponding limit states. The RA does not estimate Risk (which is defined [15] as the product of the Probability of failure to the Loss given failure) but focuses on quantification of frequency of occurrence, leaving consequences of a failure in a separate technoeconomical study.
3.2. Fundamental Reliability Problem
It is assumed that design variables are expressed by an n-dimensional vector , which has a known continuous joint distribution
 . Each functional requirement must necessarily be expressed by
 , called limitstate function, which associates a negative value if the state identified by the variables results in failure, a positive for safe and a null value for the critical limit condition [16]. There should be as many limit-state functions as the number of functional requirements and a global function
 , usually expressed as combination of all the
 , which is satisfied if all requirements are. The probability of failure
  is the likelihood that the variables satisfy or not each of the limit-states, and is given by [17]:
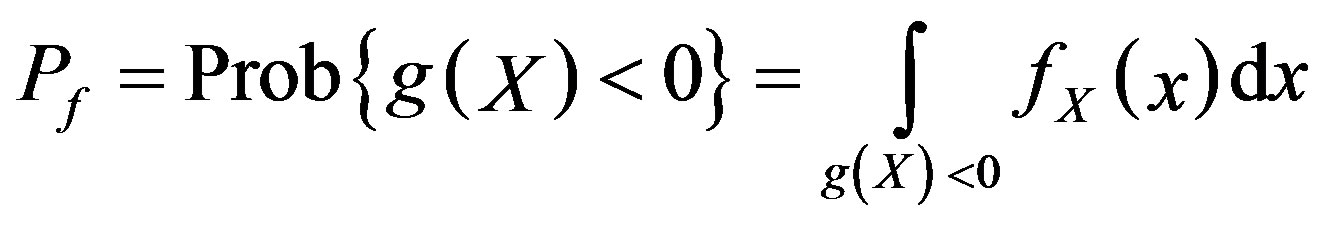 (6)
(6)
Reliability is defined as the complementary of the probability of failure, which is . Based on the definition of resistance (supply) and stress limit (demand), the failure area could be defined as their difference.
3.3. Stochastic Response Surface Method (SRSM)
Complicated failure mechanisms can impose significant difficulties on the derivation of the corresponding limit state expression as a function of the variables considered stochastically. Towards this and depending on the nature of the limit state, the Stochastic Response Surface Method (SRSM) can be employed in order to provide an effective and precise estimate of the reliability of a structure [16]. According to this method, the real limit-state function is estimated by a simpler mathematical function, such as polynomial quadratic, obtaining an approximated limit-state function, constructed by using some designated sample points, where the response surface is suited to the limit-state.
Once the approximation has taken place,  and all the other quantities can be evaluated with both stochastic and analytical methods, such as FORM, SORM or MCS. These, in fact, act in much more efficient way when working with the response surface than with the actual limit-state [18]. Therefore, SRSM is considered to be the link between input and output of a process, since it plays a role in the construction of functions and variables that are simulated.
One of the drawbacks of this method is the lack of accuracy in cases of limit-state functions to be approximated being strongly non-linear. It has been investigated in [18] how the use of higher order polynomials or the relocation of the sample points in second-order polynomials provides significant benefits. The present work does not discuss alterations of the method, but refers to the quadratic SRSM, which is suitable for the limit states under consideration. In fact, quadratic functions can match the tail curvature of response surface with good approximation and also restrict the number of required simulations [19].
The real limit-state function  is approximated by
  that usually is a k-th order polynomial function having unknown coefficients. By evaluating the value of
  at a certain number of samples of
 , it is possible to calculate the coefficients that minimize the difference between real and approximated function. A generic quadratic polynomial form can be denoted as [18]:
 (7)
(7)
where the coefficients ,
,  and
and  are the
  unknowns that can be found solving a set of equations obtained by some sample points from
 .
.
3.4. Analytical Reliability Methods
Among available methods for the approximation of the reliability values, First and Second Order Reliability Methods (FORM/SORM) are proven to be efficient by transforming the stochastic variables in a multidimensional U-space and using Taylor series expansions of the corresponding order, modifying the problem to that of finding the shortest distance from the origin to the intersection of the transformed set of axes. The transformation of the basic variables {X} in standard and normal uncorrelated Gaussians {Z} is follows [16]:
 (8)
(8)
Several methods such as discussed in [17] have been proposed to transform the variables {X} into {Z} and then perform the approximation. Without describing into detail these methods, it is possible to state that the best approximation should be obtained near the design point, in order to reduce errors or number of iterations required. Since this point is not known a priori, it is often necessary to use iterative procedures. An efficient FORM method is the one proposed by Hasofer and Lind [20], and can be summarized in the following six steps:
1) Definition of the stochastic variables Xj (i.e., type and characteristics of the distribution) to represent the limit-state functions;
2) Transformation of the variables into standard normal Gaussian Zj;
3) Calculation of ;
;
4) Calculation of  with equation:
 (9)
(9)
5) Calculation of  by solving:
 (10)
(10)
6) Calculation of .
.
After performing steps I and II and defining limit state function  in terms of
  and
and , the iterative process starts with a guess of
  and
and . The initial values are used in the limit state function to obtain new values of
  and
and  that are compared firstly with the initial ones and then with those cyclically obtained using procedure described in steps 4 and 5, until the values converge (at the chosen level of accuracy).
In the Hasofer-Lind reliability index method, the random variables X are assumed to be normally distributed. In cases of non Gaussian variables, one of various available methods [21,22] for conducting transformations to the normalized space should be employed. An extension of FORM attempts to approach the limit-state area at the second order. Second Order Reliability Method describes the limit-state function through a second order Taylor expansion [23,34]. The probability integral is solved using an approximate solution (asymptotically true for β tending to infinity), which depends on the curvatures of the limit-state function at the design point.
To solve the integral in exact way it is possible to proceed to Level III methods: analytically in simpler cases; numerically or through simulation methods in more complicated ones. The numerical integration methods have limitations in the number of variables that can be considered, due to computational difficulties. The Monte Carlo Simulation (MCS) [25], involves the random generation of many variables  according to the actual distribution of X [3]. Then
  is estimated simply by the frequency with which
 . Its direct implementation is computationally very costly, since in order to estimate sufficiently accurate results (1% to 10%), the number of events to be generated is of the order of 104 ÷ 102 times the inverse of the probability of failure [16]. Furthermore, in MCS, the design point is not calculated. This is the reason why the method is not always suitable for such optimization problems in its general case.
4. Reliability Analysis of a Racing Car Wing
4.1. Simulation Procedure
The discrete steps that have been presented so far will be combined in a unified methodology for the reliability assessment of a reference composite structure. Figure 1 presents in a block diagram form the steps followed.
The procedure starts with building the complicated CAD model; for the case that will be examined, which is categorized as a complicated geometry, Dassault Systems CATIA software was employed and the corresponding model was imported in ABAQUS [26]. Finite Element Analysis Software where composite material properties were assigned in order to proceed to simulations. After determining the variables that will be considered stochastically, load properties should be assigned and a design variables’ matrix should be constructed. For each set of the design variables an FEA simulation should be executed and results for each element should be extracted. The results of stresses for each case are then imported in a separate routine in order to calculate the values of the two different limit states. Once those values have been obtained for each element, quadratic polynomial regression takes place in order to evaluate the performance of each limit state as a function of the basic stochastic variables. Once this is completed, a separate Matlab routine will provide the values of reliability index for each element based on FORM method and a set of specified statistical distributions for each of the stochastic variables. In the absence of software able to post-process results providing reliability contours, extraction of the geometry from the FEA software and using a dedicated Matlab
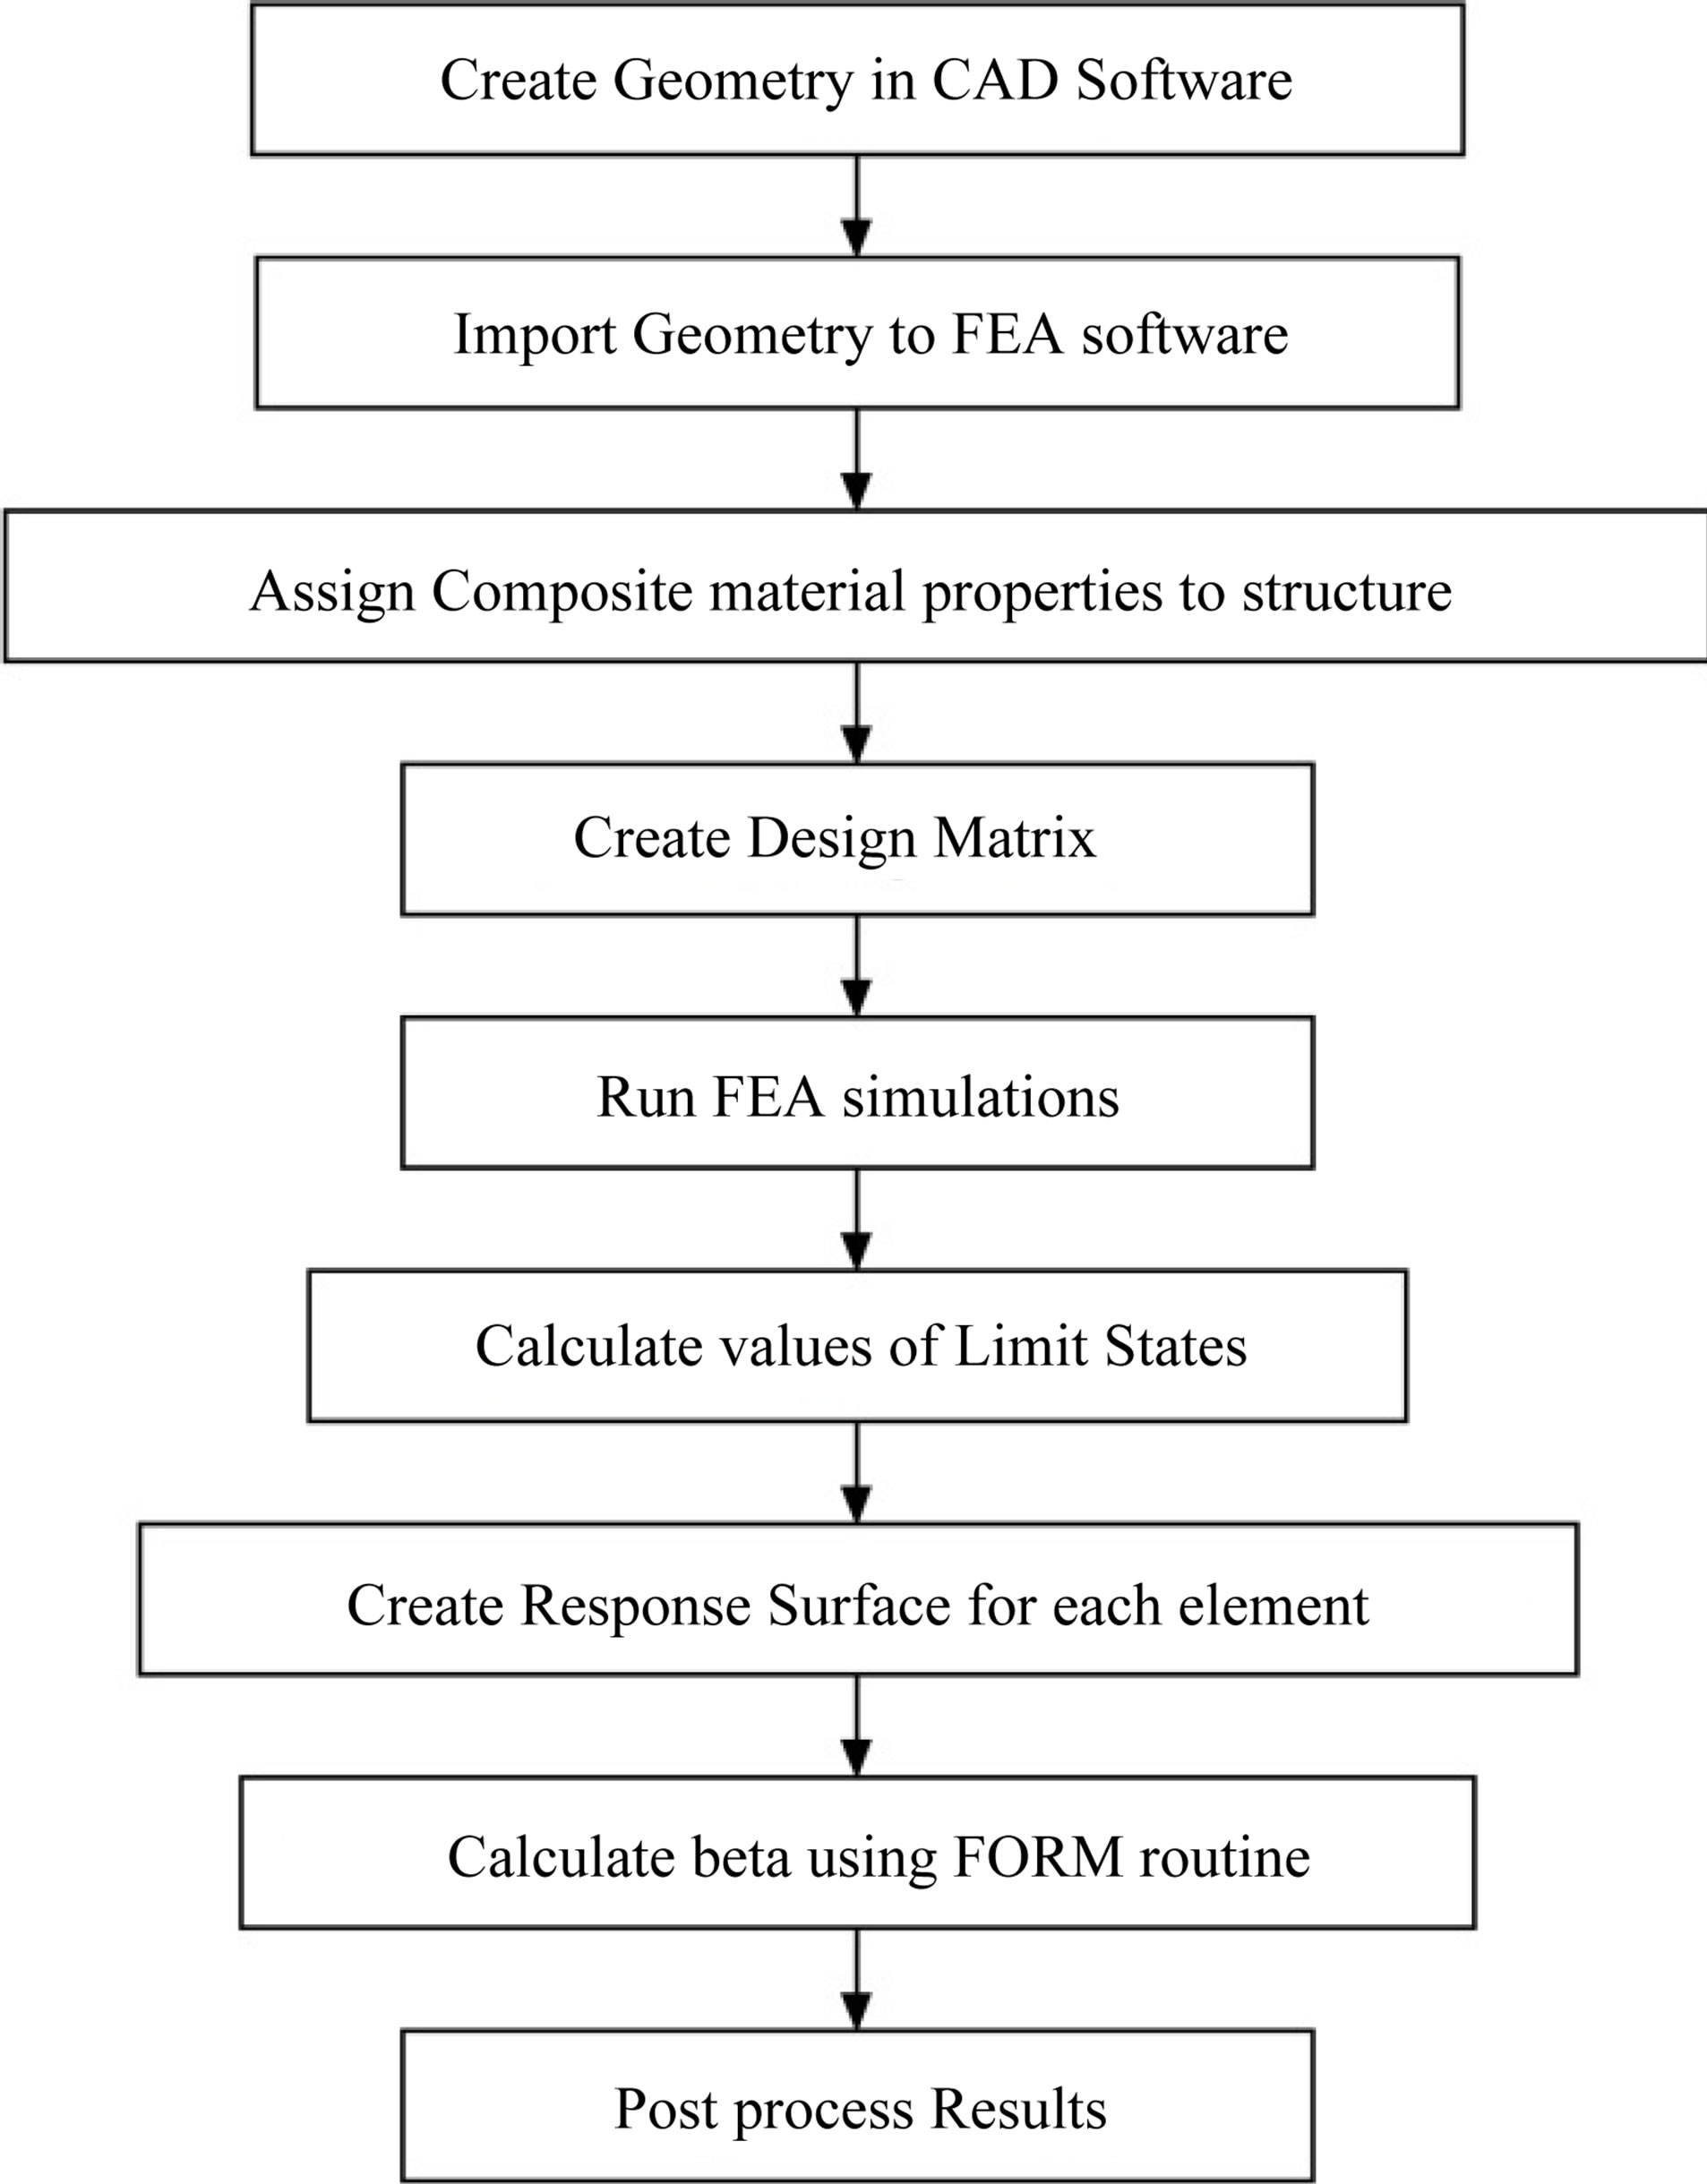
Figure 1. Simulation procedure block diagram.
routine will produce appropriate plots as will be presented in the later sections.
4.2. Reference Structure
The structure that has been selected for application of the methodology is a typical F1 racing car front wing due to its complicated geometry and the fact that this is a common application of composite materials where reliability based design has specific interest. The geometry that has been created in CATIA software is presented in Figure 2, while in Table 1 the properties of the considered stochastic variables are listed.
The variables that have been selected are four, one for the loads applied and three for the material properties. It can be seen how for mean and standard deviation of each pair, the load has been changed proportionally for horizontal and vertical direction of  and the same between tensile and compressive with regard to strengths
  and
and . The shear strength, is defined by a single statistical distribution. The methodology that has been followed can accommodate numerous variables in a more analytical reliability assessment.
4.3. Material Selection and Composite Lay-Up
Carbon fibres are generally classified in groups depending on their modulus, which can be: standard, intermediate, high, and ultra-high. Composites that are based on intermediate modulus (IM) are quite new, starting to find

Figure 2. Reference structure geometry.

Table 1. Statistical properties of design variables.
wider employment in the aerospace industry. In F1 structures, on the contrary, their use is well established [27]. IM fibres are usually combined with a specific polymer matrix. A laminate that uses the mixture of these two materials has been selected and it is denoted with IM7/ 8552 Carbon/Epoxy composite. Its three dimensional elastic properties [28] have been entered in Abaqus as engineering constants and are listed in Table 2.
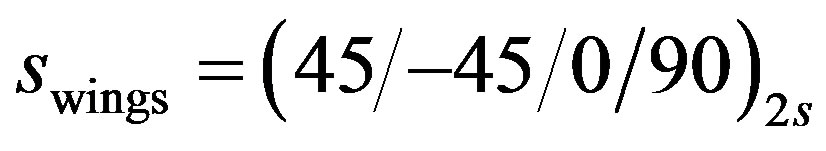
In F1 cars, the nose of the front wing is mainly manufactured using a honeycomb structure coated with composite laminates [27]. In Abaqus its section has been defined and assigned homogenous. The wings and the endplates have been modeled using the composite lay-up tool. A standard thickness of the layers [29] was set to be identical for all plies equal to 0.125 mm. The stacking sequence used for the wings and for the endplates are respectively:

4.4. Mesh
The procedure for mesh optimization is very important, since it represents the compromise between the accuracy of results and the computational time. The latter is not just referred to Finite Element Analysis, but also to the demanding execution of iterations of the algorithm proposed by Hasofer and Lind.
Mesh optimisation was performed through a convergence study on the different meshes created. The maximum displacement of the structure in some reference points has been measured as variable, considering localised mesh refinements. For all of them, different element types have been chosen for the subparts: tetrahedrals for the nose, and hexahedrals for the wings and endplates. The connection of the different meshes is automatically done by Abaqus.
According to the convergence study, and [30], the final mesh has been defined. It has a global seeding size of 6.6 mm and a number of elements for edges along the thickness equal 2 for the wings, 4 for the endplates. Furthermore, taking into consideration the symmetry of the problem, only half of the structure has been considered, resulting in a mesh comprising of 22,127 elements as shown in Figure 3.
4.5. FEA Set Up
Two time steps have been set: the initial for the application of boundary conditions (BC) and the latter to apply loads, both horizontal and vertical pressures. With regard to BCs, the use of half the front wing requires to set a fixed constraint on the free surface generated by the removed half. In addition, to reproduce the cantilever behavior

Table 2. Carbon/Epoxy (IM7/8552): engineering constants.
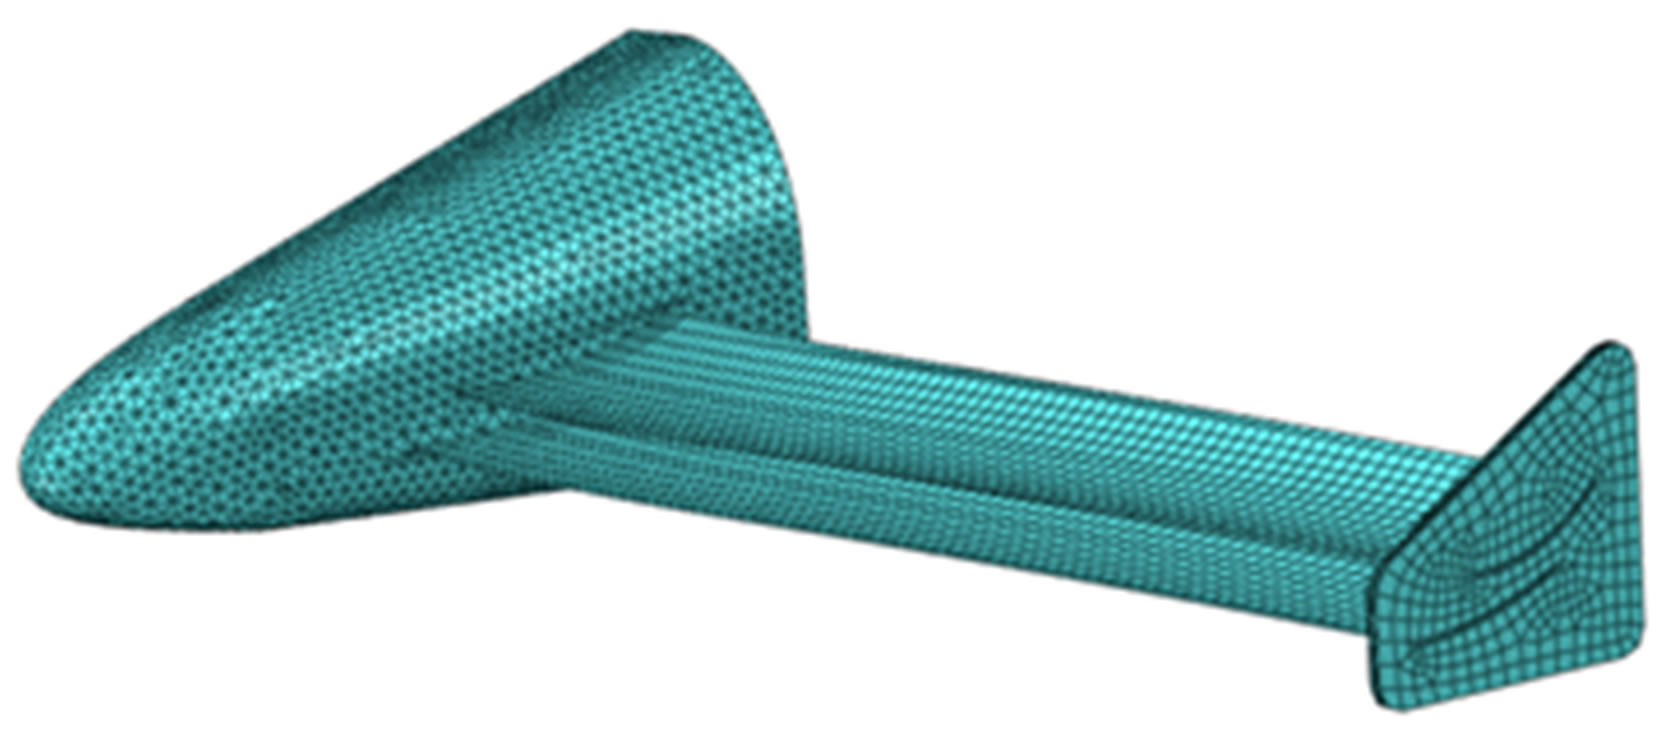
Figure 3. Optimized mesh.
of the whole front wing (as a free end), a fixed support condition has been applied on the rear surface of the nose, ideally joined to the monocoque.
4.6. Results and Discussion
Following the methodology that has been developed and presented in the previous sections, values for reliability indices have been obtained according to each of the two limit states corresponding to the different failure criteria. Figures 4 and 5 present contours of reliability for the centroid of each element.
Table 3 summarizes the statistical properties of the values derived by each criterion. From those results it can be concluded that the Tsai Wu criterion presents a smaller mean value of β underestimating reliability and producing more conservative results, however the standard deviation of those results is greater implying tails that fade out in a greater distance from the mean value. It can be noticed that for both criteria, the reliability critical areas are in the same locations and can be considered to be more concentrated than the corresponding stress concentration ones, however for the regions near the mid span of the wing, smooth reliability variation can be clearly observed. Figure 6, presents the distributions of the two sets of results by fitting a normal and a Weibull distribution, countersigning the latter fact.
A sensitivity analysis of the results was executed by increasing each of the statistical parameters of the stochastic variables by 25% in order to measure the relative change in values of beta and the results are presented in Table 4. It is worth mentioning at this point that each iteration, in order to obtain the values of reliability in the total of the 22,127 elements, required a time of approximately 5500 seconds in a personal desktop computer. The sensitivity analysis concludes that larger mean values of the strengths leads to an increase in reliability, while higher standard deviations that represent uncertainties entail a reliability decrease. The variable that more
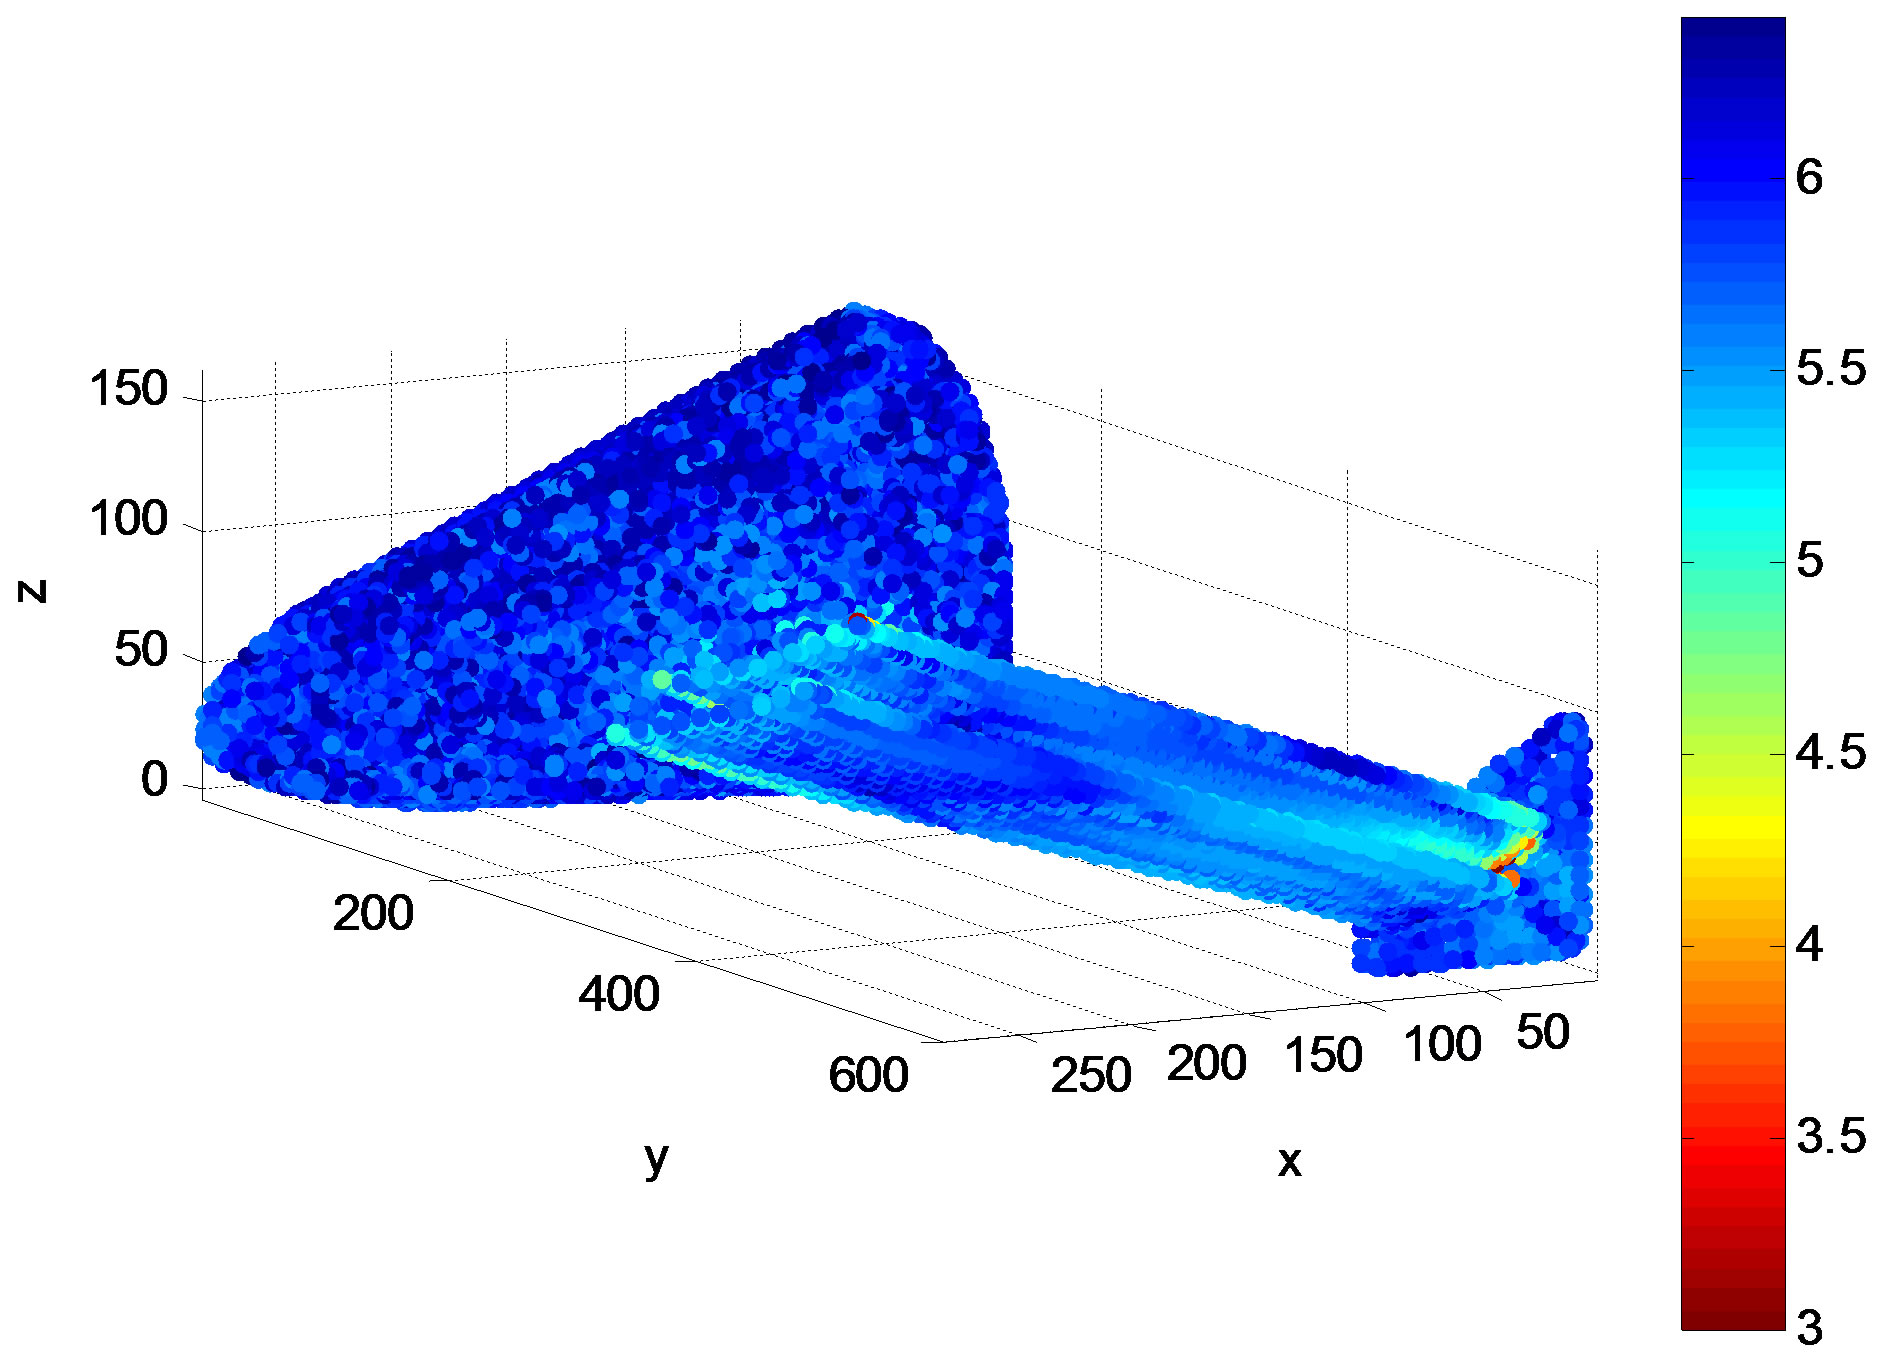
Figure 4. Reliability contours of Tsai-Hill criterion.
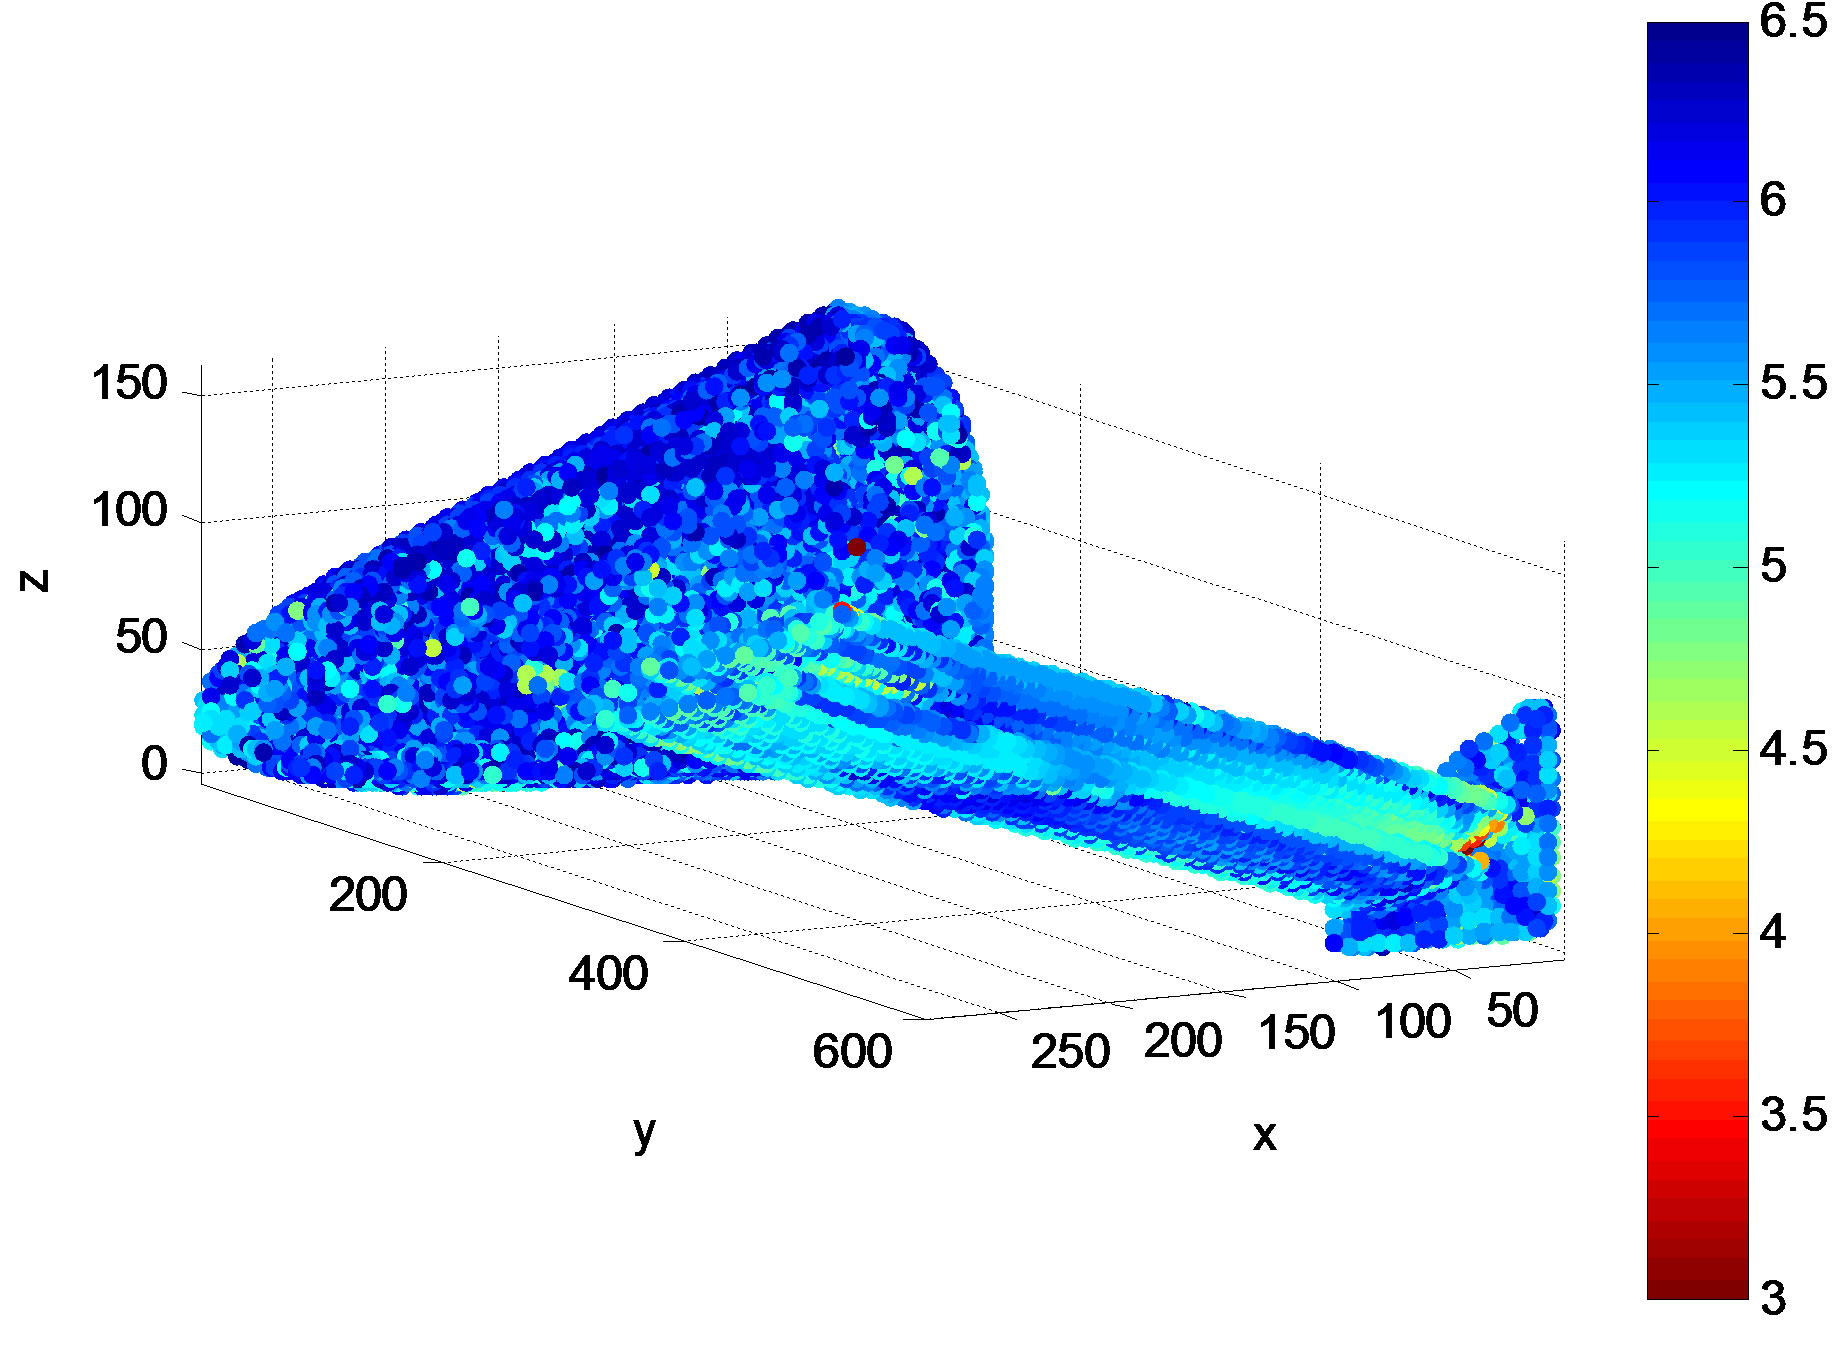
Figure 5. Reliability contours of Tsai-Wu criterion.
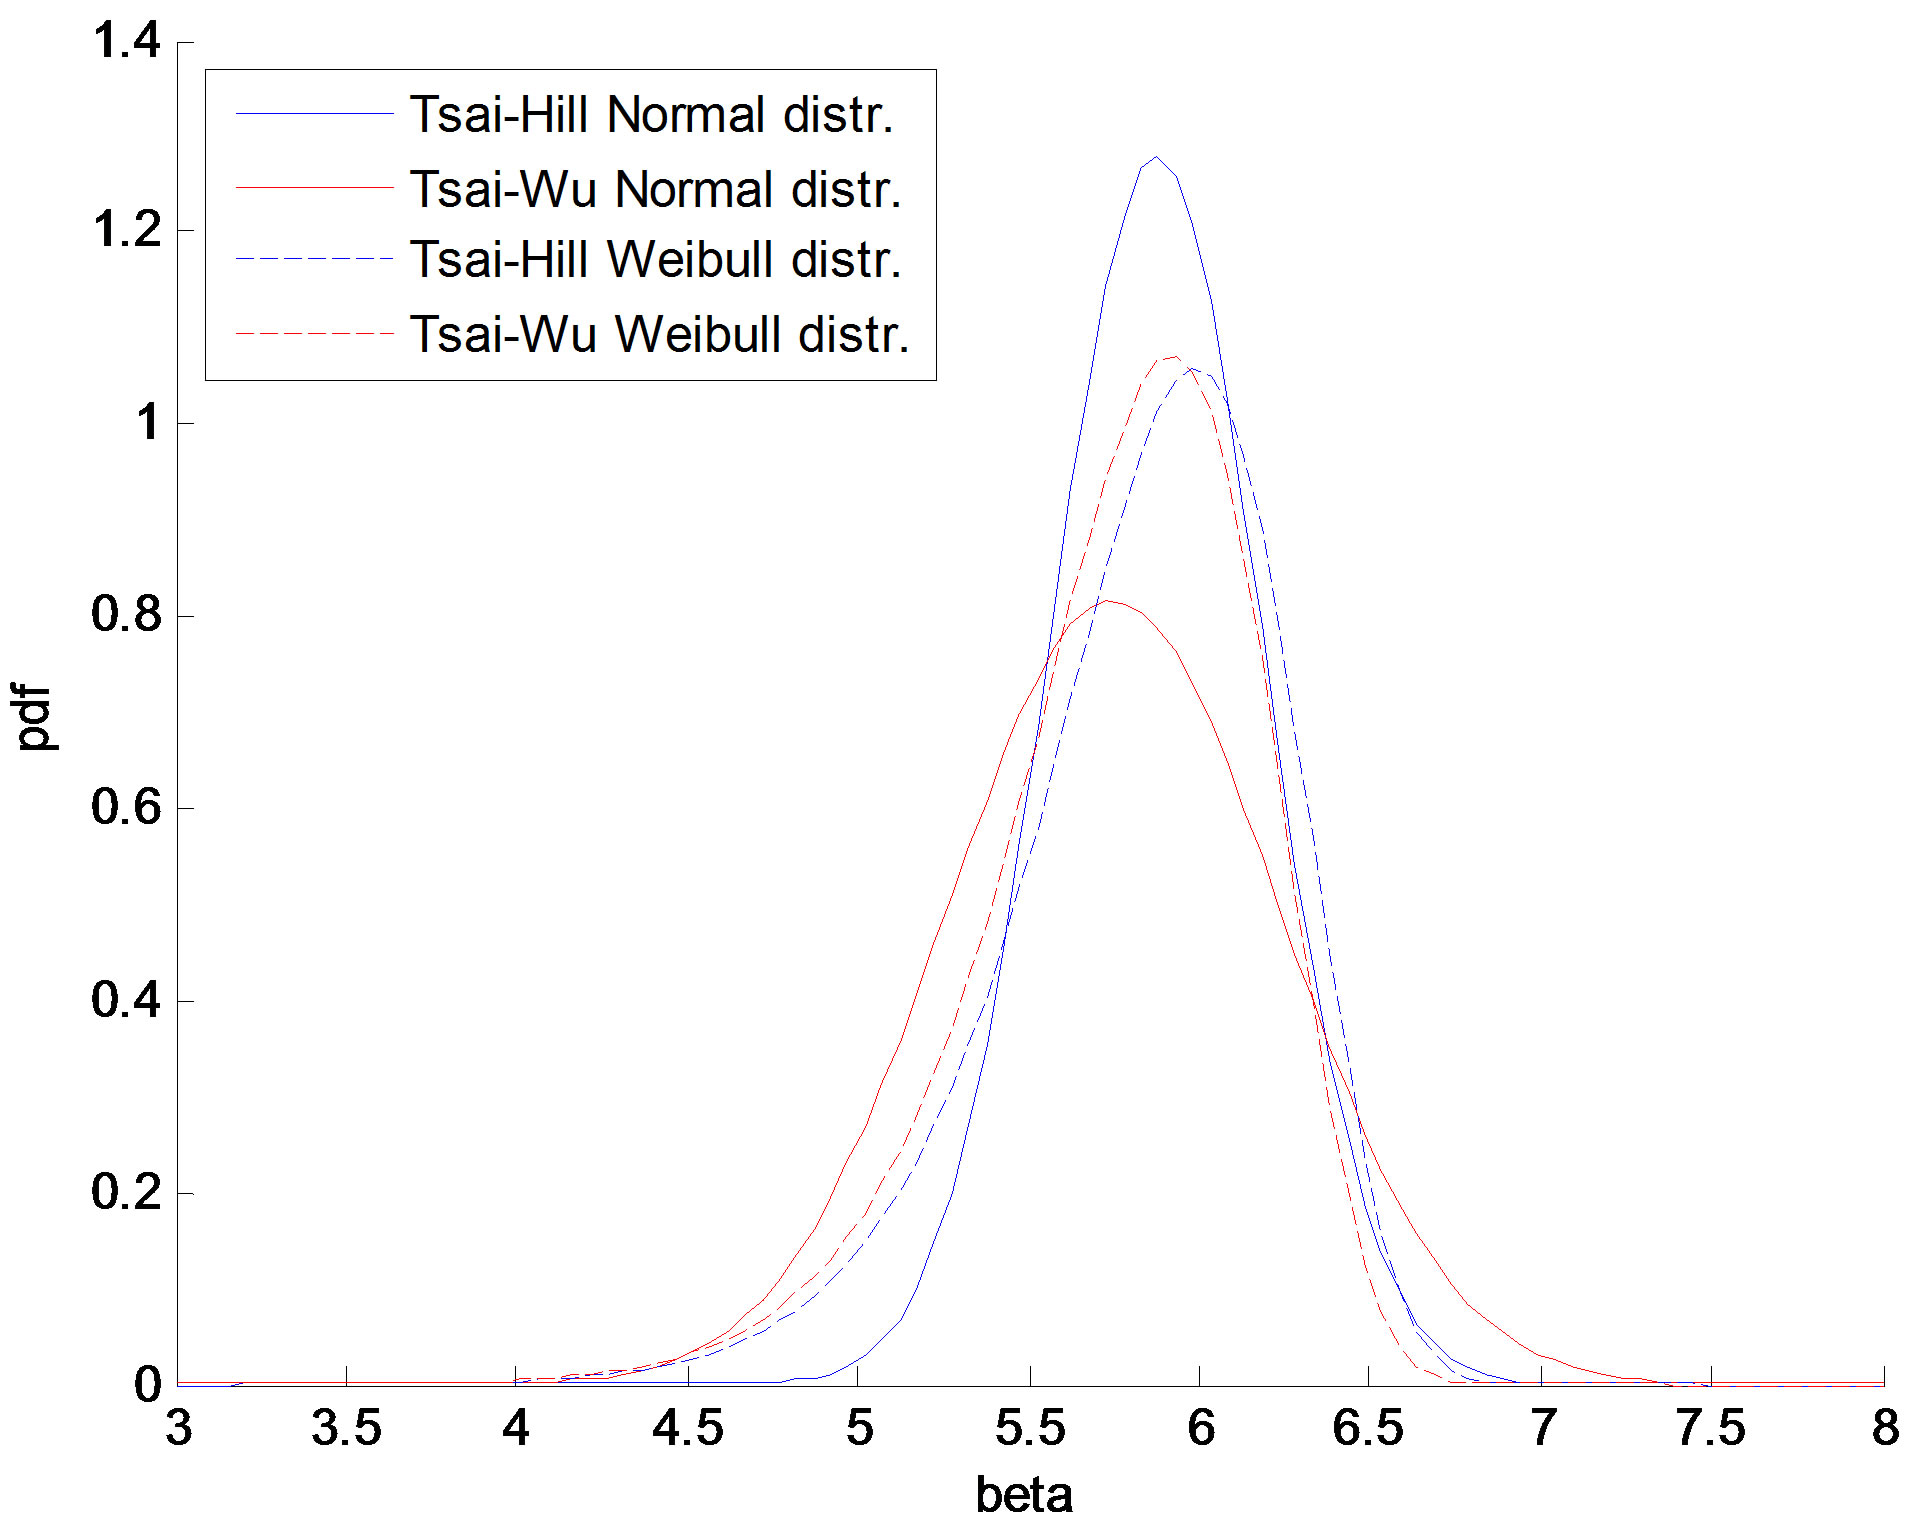
Figure 6. Statistical distributions of beta values.
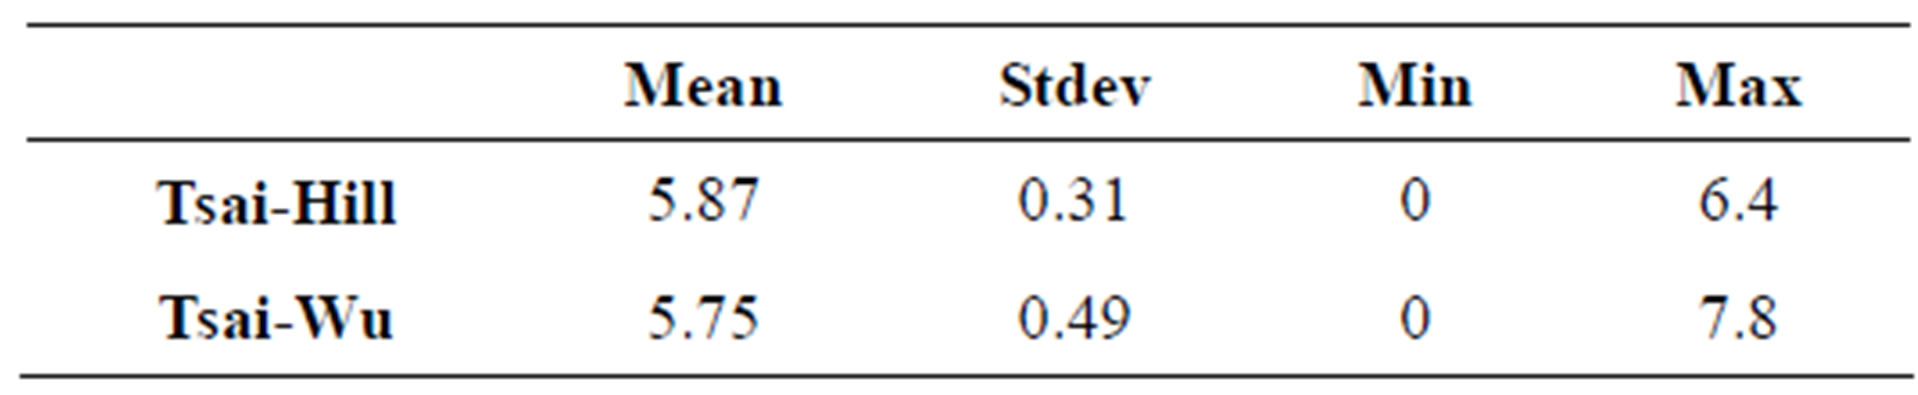
Table 3. Statistical properties of betas.
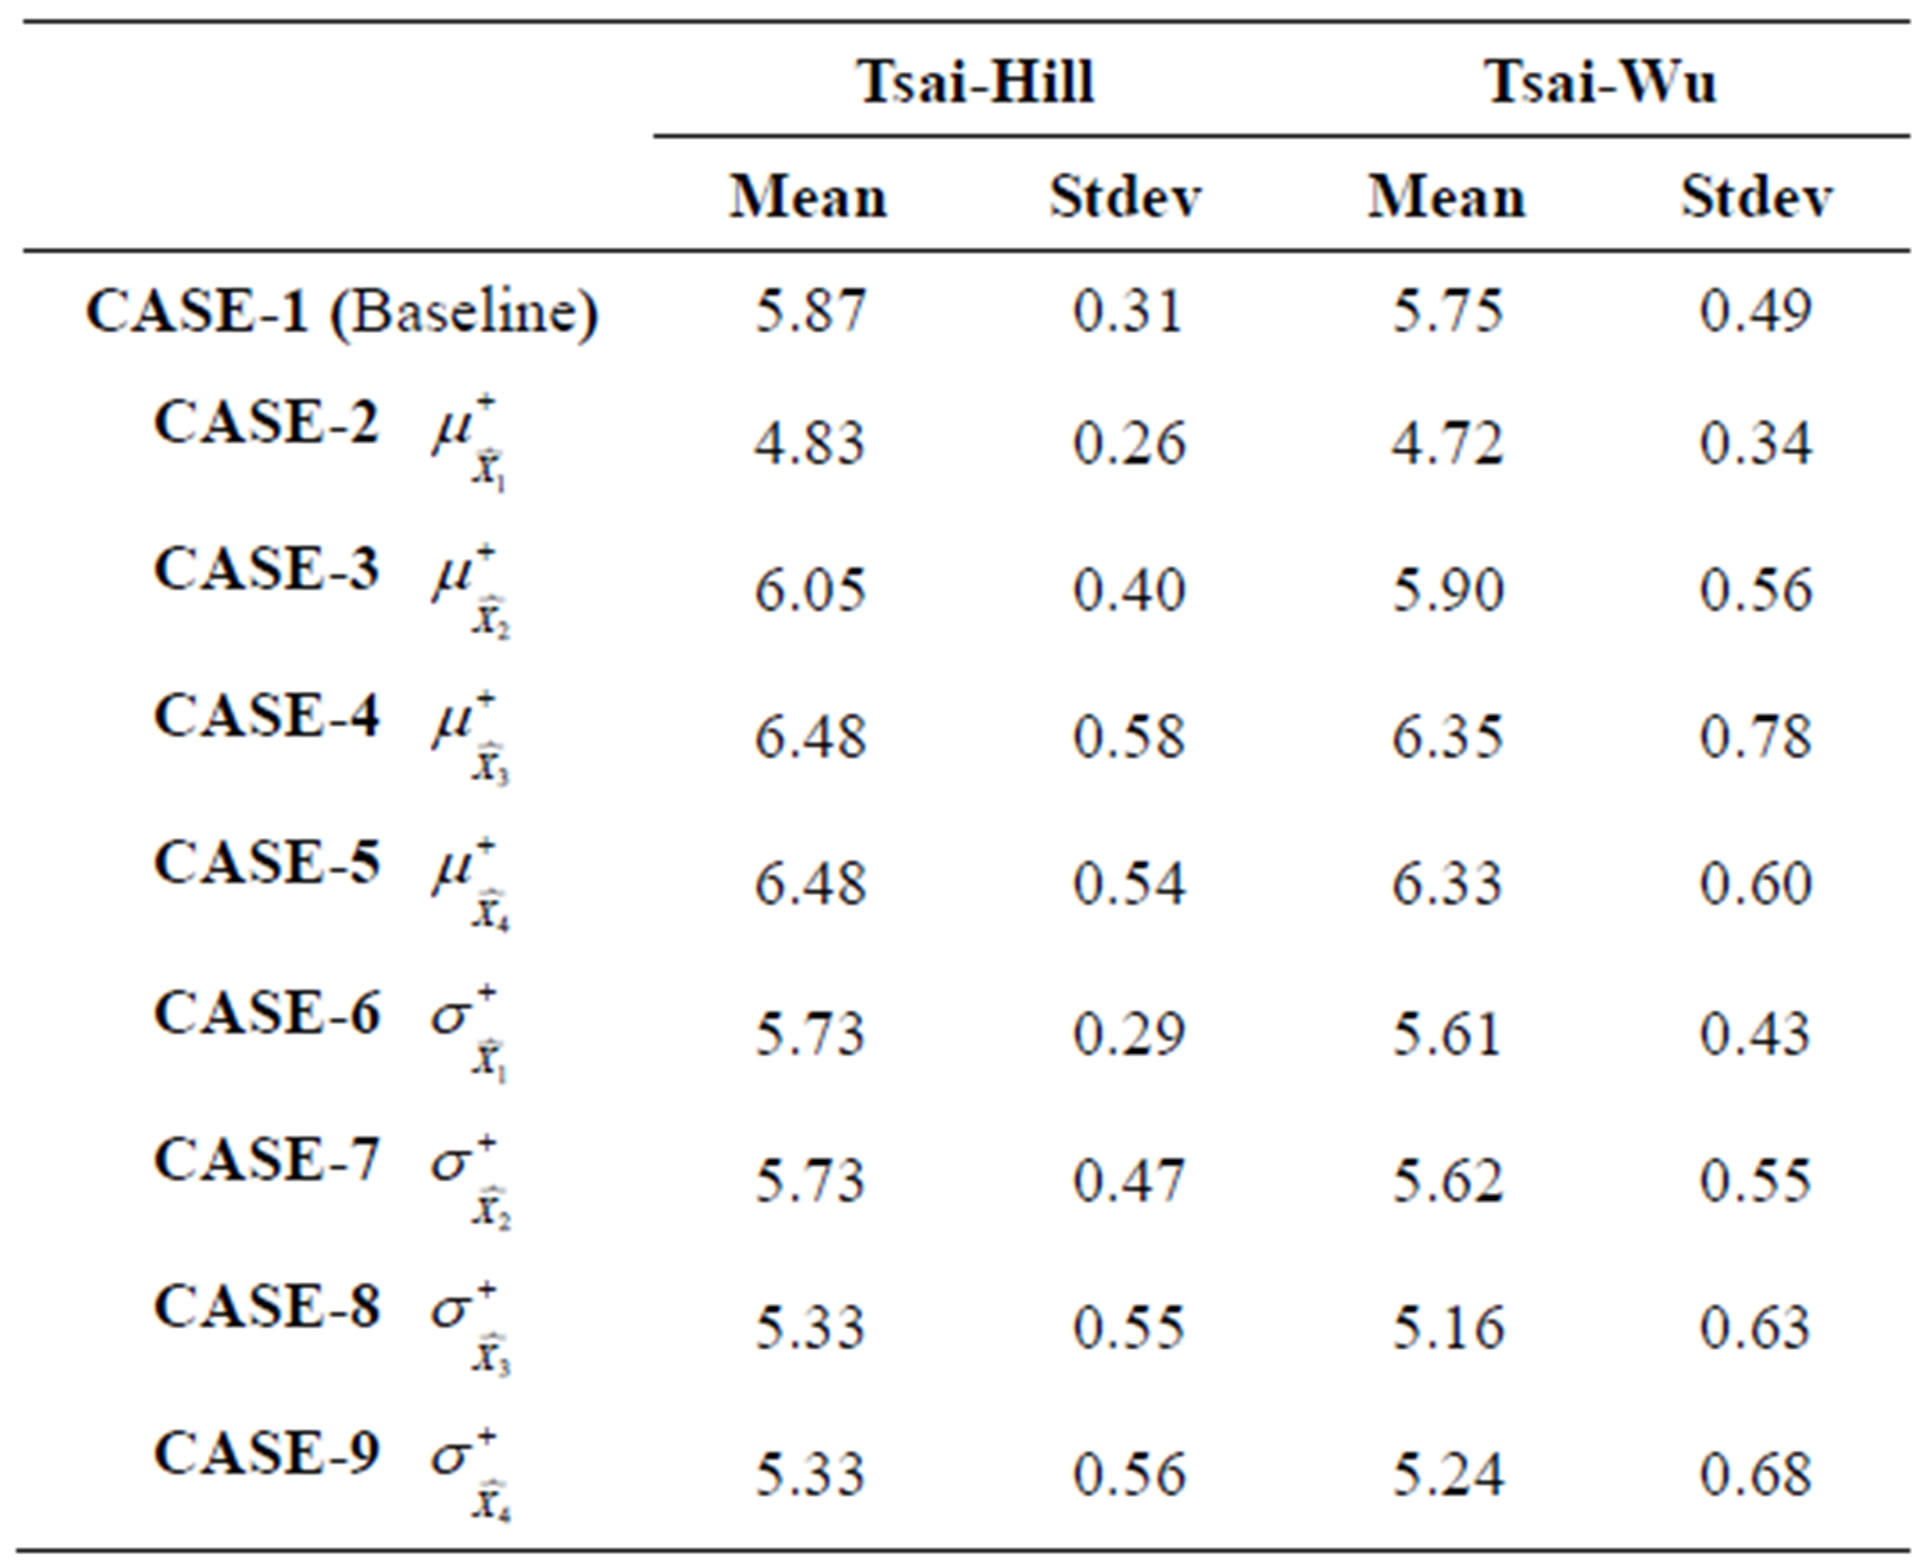
Table 4. Statistics of sensitivity analysis.
than others affects globally the front wing’s reliability is the transvers strength of the material, for the stochastic variables under consideration.
5. Conclusion
This paper has documented a methodology for the efficient reliability assessment of composite structures based on a combination of Finite Element Simulations, Stochastic Response Surface Method and First Order Reliability Methods for the estimation or reliability indices, based on Tsai Hill and Tsai Wu failure criteria. Application of the method in a typical composite structure has illustrated its efficiency and simplicity in implementation since each step can be executed in specialized software without requiring one unified numerical procedure. Results of the comparative study, expressed as spatial reliability contours as well as statistical distributions, distinguish Tsai Wu criterion as more conservative one (smaller values of β) in mean values but with a greater standard deviation implying marginal results in a greater distance from the mean value of β.
REFERENCES
- B. R. Ellingwood, “Issues Related to Structural Ageing in Probabilistic Risk Assessment of Nuclear Power Plants,” Reliability Engineering and System Safety, Vol. 62, No. 3, 1998, pp. 171-183. doi:10.1016/S0951-8320(98)00018-0
- Y. W. Liu and F. Moses, “Sequential Response Surface Method and Its Application in reliability Analysis of Aircraft Structural Systems,” Journal of Structural Safety, Vol. 16, No. 1-2, 1994, pp. 39-46. doi:10.1016/0167-4730(94)00023-J
- A. Kolios, “A Multi-Configuration Approach to Reliability Based Structural Integrity Assessment for Ultimate Strength,” Ph.D. Thesis, Cranfield University, Cranfield, 2010.
- J. C. P. Kam, “Fatigue Reliability Assessment of Offshore Structures,” Quality and Reliability Engineering International, Vol. 4, No. 1, 1988, pp. 41-48. doi:10.1002/qre.4680040111
- P. C. Das, “Application of Reliability Analysis in Bridge Management,” Engineering Structures, Vol. 20, No. 11, November 1998, pp. 957-959, doi:10.1016/S0141-0296(97)00189-2
- T. V. Micic, M. K. Chryssanthopolous and M. J. Baker, “Reliability Analysis for Highway Bridge Deck Assessment,” Journal of Structural Safety, Vol. 17, No. 3, 1995, pp. 135-150. doi:10.1016/0167-4730(95)00005-O
- G. C. Sih and A. M. Skudra, “Failure Mechanics of Composites,” Elsevier Science & Technology Books, Amsterdam, 1985.
- R. G. Budynas and K. J. Nisbett, “Shigley’s Mechanical Engineering Design,” McGraw-Hill, New York, 2006.
- S. W. Tsai, “Strength Theories of Filamentary Structures Fundamental Aspects of Fiber Reinforced Plastic Composites,” Wiley-Interscience, New York, 1968.
- V. D. Azzi, S. W. Tsai, “Anisotropic Strength of Composites,” Experimental Mechanics, Vol. 5, No. 9, 1965, pp. 283-288. doi:10.1007/BF02326292
- I. M. Daniel and O. Ishai, “Engineering Mechanics of Composite Materials,” Oxford University Press, New York, 1995.
- I. Gol’denblat and V. A. Kopnov, “Strength of Glass Reinforced Plastic in the Complex Stress State,” Polymer Mechanics, Vol. 1, No. 2, 1966, pp. 54-59. doi:10.1007/BF00860685
- S. W. Tsai and E. M. Wu, “A General Theory of Strength for Anisotropic Materials,” Journal of Composite Materials, Vol. 5, No. 1, 1971, pp. 58-80.
- MSC Software Corporation, “Patran—Laminates Theory,” 2011. http://www.mscsoftware.com/training_videos/patran/Reverb_help/index.html#page/Laminate%20Modeler/lam_theory.6.5.html
- M. T. Todinov, “Risk-Based Reliability Analysis and Generic Principles for Risk Reduction,” Elsevier Science, Oxford, 2006.
- S. K. Choi, R. V. Grandi and R. A. Canfield, “ReliabilityBased Structural Design,” Springer-Verlag, London, 2007.
- M. Hohenbichler, S. Gollwitzer, W. Kruse and R. Rackwitz, “New Light on Firstand Second-Order Reliability Methods,” Structural Safety, Vol. 4, No. 4, 1987, pp. 267-284. doi:10.1016/0167-4730(87)90002-6
- H. P. Gavin and S. C. Yau, “High-Order Limit State Functions in the Response Surface Method for Structural Reliability Analysis,” Structural Safety, Vol. 30, No. 2, 2008, pp. 162-179. doi:10.1016/j.strusafe.2006.10.003
- A. J. Kolios, et al., “An Approach of Stochastic Expansions for the Reliability Assessment of Complex Structures,” Proceedings of the 8th International Probabilistic Workshop, Szczecin, 18-19 November 2010.
- A. M. Hasofer and N. C. Lind, “Exact and Invariant Second Moment Code Format,” Journal of the Engineering Mechanics Division, Vol. 100, No. 1, 1974, pp. 111-121.
- M. Rosenblatt, “Remarks on a Multivariate Transformation,” The Annals of Mathematical Statistics, Vol. 23, No. 3, 1952, pp. 470-472.
- M. Hohenbichler and R. Rackwitz, “Non-Normal Dependent Vectors in Structural Safety,” Journal of the Engineering Mechanics Division, Vol. 107, No. 6, 1981, pp. 1127-1138.
- K. Breitung, “Asymptotic Approximations for Multi-Normal Integrals,” Journal of the Engineering Mechanics Division, Vol. 110, No. 3, 1984, pp. 357-366.
- L. Tvedt, “Two Second-Order Approximations to the Failure Probability—Section on Structural Reliability,” A/S Veritas Research, Hovik, 1984.
- J. von Neumann and S. Ulam, “The Monte Carlo Method,” Bulletin AMS, 51-0-165, 1945.
- Dassault Systèmes Simulia, “Abaqus 6.9 Theory Manual,” 2009.
- G. Savage, “Formula 1 Composites Engineering,” Engineering Failure Analysis, Vol. 17, No. 1, 2010, pp. 92- 115. doi:10.1016/j.engfailanal.2009.04.014
- A. Makeev, G. Seon and E. Lee, “Failure Predictions for Carbon/Epoxy Tape Laminates with Wavy Plies,” Journal of Composite Materials, Vol. 44, No. 1, 2010, pp. 95- 112. doi:10.1177/0021998309345352
- J. Lee and C. Soutis, “Experimental Investigation on the Behaviour of CFRP Laminated Composites under Impact and Compression after Impact (CAI),” Proceedings of the EU-Korea Conference on Science and Technology, Berlin, 28-31 August 2008, pp. 275-286.
- T. Nguyen-Thoi, G. R. Liu, H. C. Vu-Do and H. NguyenXuan, “A Face-Based Smoothed Finite Element Method (FS-FEM) for Visco-Elastoplastic Analyses of 3D Solids Using Tetrahedral Mesh,” Computer Methods in Applied Mechanics and Engineering, Vol. 198, No. 41-44, 2009, pp. 3479-3498. doi:10.1016/j.cma.2009.07.001
Nomenclature
 : Longitudinal stress
 : Longitudinal strength
 : Transverse stress
 : Transverse strength
 : Longitudinal tensile strength
 : Longitudinal compressive strength
 : Transverse tensile strength
 : Transverse compressive strength
 : In-plane shear stress
 : In-plane shear strength
 : Second order strength tensor
 : Fourth order strength tensor
 : Strength ratio for Tsai-Hill criterion
 : Failure index for Tsai-Hill criterion
 : Strength ratio for Tsai-Wu criterion
 : Margin of safety
 : Generic limit-state function
 : Global limit-state function
 : Continuous joint distribution
 : Probability of failure
 : Approximated limit-state function
 : Basic stochastic variable
 : Standard normal Gaussian
 : Mean of
 : Standard deviation of
 : Direction cosine
 : Design point of the limit-state function
 : Safety index (or reliability index)
 : Cumulative normal distribution
 : Load variable (Horizontal, Vertical)
 : Longitudinal strength variable (Tensile, Compressive)
 : Transverse strength variable (Tensile, Compressive)
 : In-plane shear strength variable
 : Increased mean in sensitivity analysis
 : Increased standard deviation in sensitivity analysis
 : Young’s modulus
 : Poisson’s ratio
 : Shear modulus
 : Layer’s thickness
 : Stacking sequence for wings
 : Stacking sequence for endplates