Atmospheric and Climate Sciences
Vol.4 No.2(2014), Article ID:44665,13 pages DOI:10.4236/acs.2014.42021
Extreme Rainfall Events over the Amazon Basin Produce Significant Quantities of Rain Relative to the Rainfall Climatology
Adriane Lima Brito1, José Augusto Paixão Veiga1*, Marcos Cezar Yoshida2
1Institute of Technology, Amazon State University, Manaus, Brazil
2National Institute for Space Research, São José dos Campos, Brazil
Email:*veiga.uea@gmail.com
Copyright © 2014 by authors and Scientific Research Publishing Inc.
This work is licensed under the Creative Commons Attribution International License (CC BY).
http://creativecommons.org/licenses/by/4.0/


Received 30 December 2013; revised 26 January 2014; accepted 3 February 2014
Abstract
Although much effort has been made to characterize and understand extreme rainfall’s causes and effects, little is known about their frequency and intensity. Moreover, knowledge about their contribution to the total rainfall climatology is still minimal, especially over the Amazon where rainfall data are very scarce. In this paper we propose to classify extreme rainfall events by type and analyze their frequency and intensity over South America with a focus on the Amazon basin. Gridded daily data from the MERGE/CPTEC product over a period of 15 years (1998–2013) was used. An adaptation of Rx5d climate index was applied to select different kinds of extreme rainfall for the purpose of quantifying their frequency and intensity as well as their contribution to the accumulated rainfall climatology. According to the results, all kinds of extreme rainfall events can be observed over the studied area. However, the quantity of rainfall produced by each type is different, and consequently their percent contributions to the total accumulated rainfall climatology also differ. For example: in the Amazon region EET-I is responsible for 15% - 40% of the total accumulated rainfall. Moreover, in the Brazilian northeast there are regions where EET-I exceeds 40% of the total rainfall. In northeast Brazil EET-II is responsible up to 30% of the total accumulated rainfall. EET-III is responsible for 5% - 15% in the Amazon basin, 25% - 45% in northeast Brazil and 10% - 45% over Roraima State. Area-mean time variation shows that the quantity of rainfall extremes over the Amazon basin was reduced during the El Niño years of 2002, 2005, 2007 and 2010, while during the La Niña episodes of 1999, 2008 and 2011 the quantity of rainfall related to the extremes increased.
Keywords:Extreme Rainfall Events; Climatology; Amazon

1. Introduction
Extreme rainfall events can be defined as significant deviations from the rainfall average and can have major impacts on human life, ecology and economy. Depending on regional vulnerability, an extreme rainfall event can inflict strong damage to buildings and bring inconvenience for citizens. Extreme events of short duration have been considered some of the most impacting [1] . This is true for Manaus, a state province in Amazonas State. Manaus has been frequently faced problems due to large amounts of rainfall related to short period extreme events. Over the past 10 years the Amazon basin has experienced frequent flood and drought conditions [2] -[5] that directly impact the lives of its people. It is known that flood and drought conditions are strongly related to Pacific and Atlantic SST Sea Surface Temperature) anomalies, which affect the quantity of moisture that is available to converge/diverge over the Amazon region [6] . However, little is known about the short period extreme rainfall events that frequently impact the Amazon region. Furthermore, detailed information related to their spatial and temporal patterns is very important for decision makers and civil defense.
In 2005 the southwestern portion of the Amazon basin experienced the most severe drought of the last 100 yr, which strongly impacted its hydrological regime and produced several forms of inconvenience to people living there [2] . During 2009 the Amazon region underwent heavy flooding, impacting the livelihoods of the local population. According to [4] , the combination of enhanced moisture transport from the tropical North Atlantic and a premature onset of the rainy season resulted in the flooding. In 2010 anomalous warming conditions in the tropical North Atlantic induced a second recent round of historically severe wet conditions by forcing a very northerly climatological position of the ITCZ (Intertropical Convergence Zone). This ITCZ pattern was then responsible for the rainfall deficiency over Amazon [3] . Assessing the last 70 - 80 years of rainfall trends over the Amazon basin from 18 sets of homogeneous station data [7] , it can be observed that there was no significant rainfall trend in the Amazon as a whole, either seasonal or annual. In direct contrast to the modeling studies, [7] found a decreasing trend in the western Amazon where the forest is still preserved and an increasing rainfall trend in the eastern portion where the forest has been depleted.
[8] observed that some climate models project more frequent and intense extreme events for the future. [9] analyzed anthropogenic influences over extremes of temperature and precipitation based on climate change scenarios. Among other results, the authors observed that changes in extremes of temperature and precipitation will be more intense in the Amazon. However, [10] analyzing a climatology of extreme rainfall indices for the Amazon basin, observed that future scenarios obtained from a limited are a model forced by initial and boundary conditions from the Had CM3 (Hadley Centre Coupled Model, version3) indicate an increase (decrease) in the CDD (R95p) index for the area of the Amazon basin. These results indicate that periods of drought (floods) will be more (less) intense in the near future. [11] analyzed the outputs of climate models designed by MOHC (Met Office Hadley Centre) and observed percentage reductions in rainfall over the Amazon as the average annual global temperature increases, so that steeper changes occur after the year 2040. However, observational studies showed no obvious signs of negative trends in precipitation in the Amazon. Thus, considering the uncertainties in climate models, it is necessary to study extreme rainfall events using present weather observations in order to obtain details about the behavior of the see vents. According to [12] , in the near future, extreme events will tend to present an even more hostile scenario, with more frequent occurrences of drought sand floods. Therefore, it is important to use an appropriate methodology to quantify the frequency and intensity of extreme rainfall events and what their preferred regions of occurrence are.
Considering the small number of works related to the spatial and temporal distribution of short extreme rainfall events over the Amazon, here we aim to characterize the frequency and intensity, as well as climatology, of short period (maximum of five days) extreme rainfall events over the South American region with a focus on the Amazon basin. The study uses a methodology that is capable of separating particular kinds of extreme rainfall based on rainfall quantity.
2. Data and Methodology
Totals of daily gridded rainfall data derived from the CPTEC (Centro de Previsão de Tempo e Estudos Climáticos) product of the National Institute for Space Research were used in this work. This product is called MERGE once it is combined rain gauge observations and satellite estimations of precipitation data [13] [14] . The data are distributed with a horizontal resolution of 20 × 20 km over South America and cover a period of 15 years (1998- 2013).
This study makes use of an adaptation of the methodology of [15] and [16] , which consists in determining extreme rainfall events as a function of the average of the maximum precipitation value (here named MMP), Rx5d. In this method only cases of maximum precipitation occurrence in consecutive five (5) day intervals in each grid point are selected. Thereafter, the MMP is calculated according to the following equation

where,  denotes the maximum precipitation in each selected grid point and n is the number of time-series data. A comparison between the MMP and the observed rainfall value determines the existence of an extreme rainfall event as follows: if the precipitation value is equal to or larger than the MMP it is considered to be an extreme rainfall event; otherwise, the rainfall value is considered as a normal event. In this case we have a rainfall day that could be considered either normal or extreme; however, this tells us nothing about the intensity or strength of the rainfall event. To select different kinds of extreme rainfall events we need to consider a threshold value from the MMP. This threshold value can be achieved by calculating the standard deviation of the maximum precipitation occurrences in consecutive five-day intervals (hereafter named DPMP). The advantage of this threshold is that it is not fixed but space-dependent, which makes the selection of rainfall extremes more robust. The DPMP is calculated from the following equation:

Thus, different kinds of extreme rainfall are classified as follows: if the value of the rain recorded at the grid point either equals or exceeds the value of the MMP but is less than the MMP plus one DPMP, the event is considered an extreme rainfall event type I (named as EET-I, meaning Extreme Event Type-I). In the same way a rainfall event is considered to be an EET-II (Extreme Event Type-II) if the amount of rainfall recorded at the grid point lies between MMP + (1 ´ DPMP) and MMP + (2 ´ DPMP). An amount of rainfall exceeding MMP + (3 ´ DPMP) is classified as EET-III (Extreme Event Type-II). Applying this method to the time series of rainfall we can split the rainfall events by type and analyze their climatology, contributions to total rainfall and frequency of occurrence in each grid point. While the period of time over which the data was compiled encompasses entire seasons, here we concentrate on the Austral summer (DJF) for the analyses.
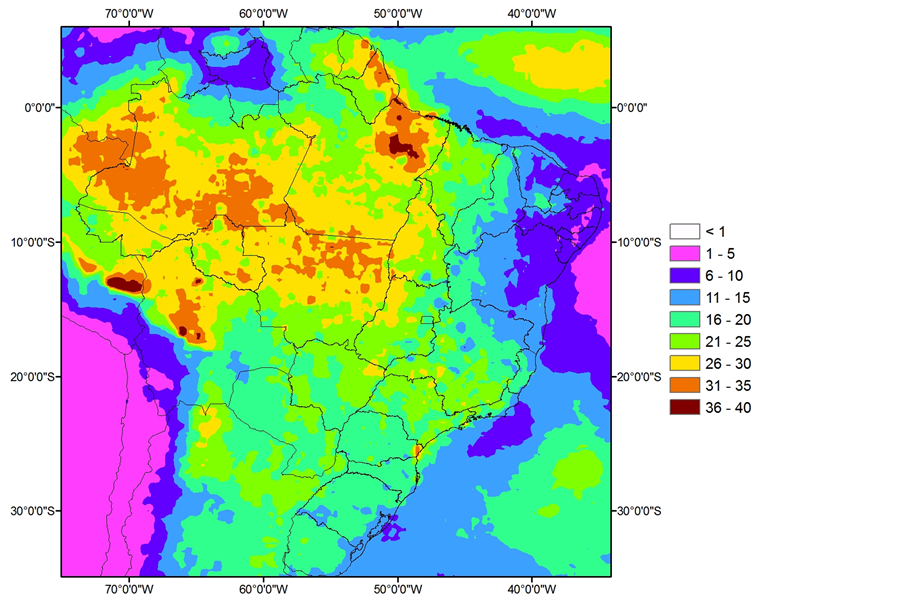
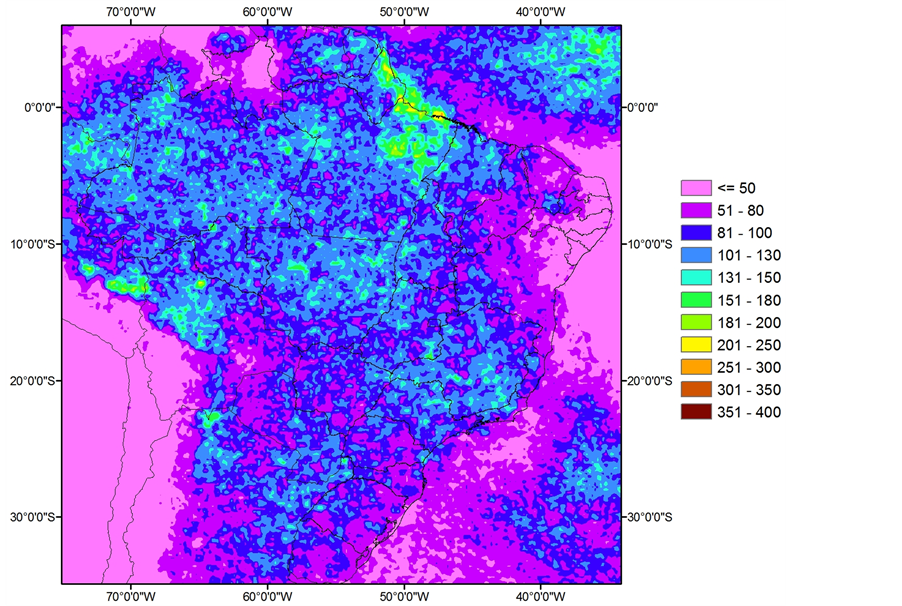
The DJF mean of maximum five consecutive days precipitation used to select extreme rainfall events is presented in Figure 1. From this Figure it can be seen that higher values for the extreme rainfall threshold are observed over most of the Amazon basin, with the highest values occurring over northern Pará State and southern Amazon State. Lower values are presented over northeast and southern Brazil. These figures reveal that to be considered an extreme rainfall event the gridded daily data must exceed 35 mm/day in the southern Amazon basin and northern Pará State, for example. Values much less than this are required in southern and northeast Brazil in order for a total daily rainfall to be considered an extreme rainfall event. Here, we considered the frequency of extreme rainfall by counting the number of times a particular level of extreme rainfall occurred in each grid point. It is expected that ETT-III is the rarest case, while EET-I is more frequent than the others.
3. Results
3.1. Spatial Pattern of Extreme Rainfalls
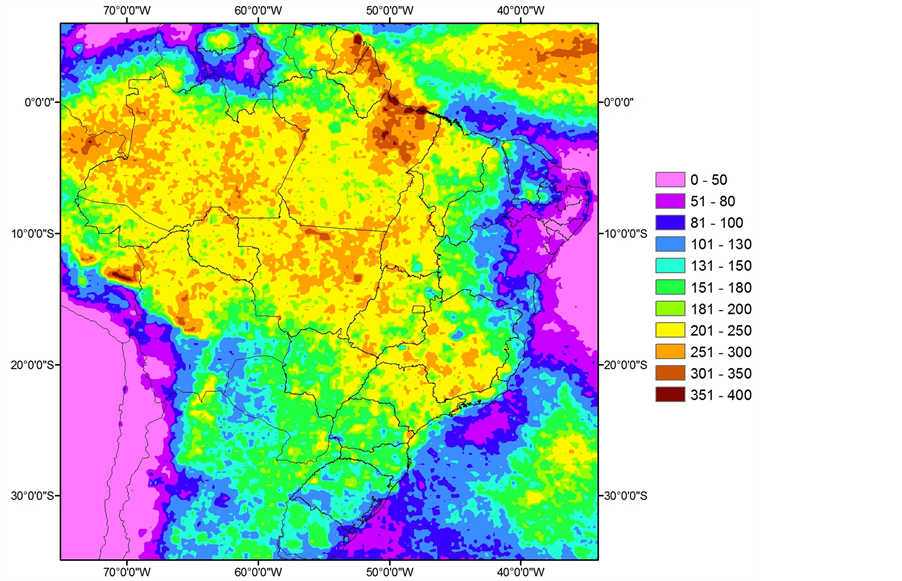
The mean accumulated rainfall produced by EET-I over South America for the 1998-2013 period is presented in Figure 2(a). The large-scale pattern of higher values of mean accumulated rainfall seems to cover most of Brazil. Lower values are observed over Roraima State and northeast Brazil. North of Pará, Amazon and Mato Grosso States, which make up part of the Brazilian Amazon, are regions where EET-I produced large quantities of rainfall, especially over northeast Pará and Marajó Island. On average, EET-I events yielded more than 200 mm of rainfall during the summer months. In the Litoranea areas like Pará and Amapá States and Franch Guiana, the quantity of rainfall produced by this kind of extreme rainfall exceeded 300 mm. This large quantity of rainfall can be due the passage of squall lines round these regions such as are frequently observed in the litoral north. Furthermore, there is a wideband from the western Amazon to southeast Brazil with local maxima of accumulated rainfall that seems related to the SACZ (South Atlantic Convergence Zone). In fact, during Austral
 (a)
(a)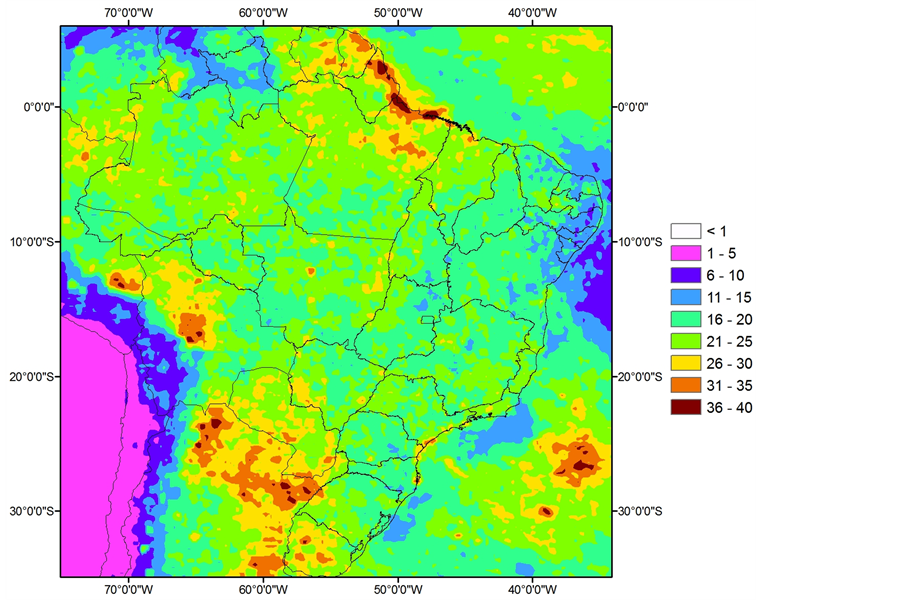 (b)
(b)
Figure 1. DJF mean of maximum consecutive 5 days precipitation (a) and its standard deviation (b) for the period of 1998-2013. Units are in mm/day.
 (a)
(a)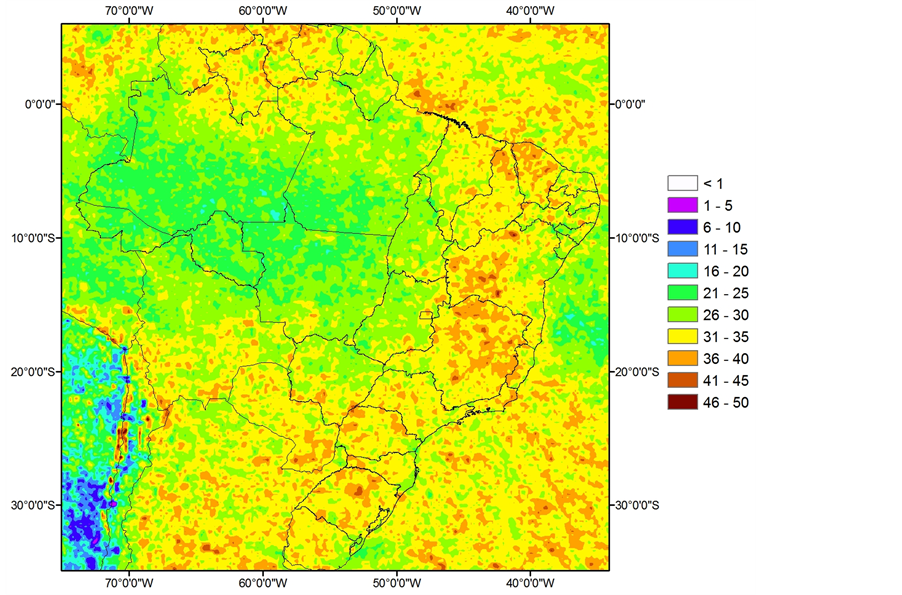 (b)
(b)
Figure 2. Climatology of accumulated precipitation produced by EET-I for DJF (a) and contribution of EET-I to the total DJF rainfall recorded for the period 1998-2013. Units are, respectively, in mm/month and percentage (%).
summer SACZ produces large quantities of rainfall and, according to the results, SACZ yields more rainfall in specific locations. In the Amazon region the contribution of EET-I to the total rainfall (Figure 2(b)) lies between 15% and 40%, showing that the greatest quantity of accumulated rainfall is due non-extreme rainfall. However, there are north-south oriented localities in northeast Brazil in which ETT-I exceeded 40% of the total rainfall expected for DJF.
A smaller total quantity of rainfall over Brazil is produced by EET-II (Figure 3(a)). The highest values were observed in the littoral of Pará and Amapá States. The quantity of rainfall produced by EET-II is highly variable over most of Brazil. For example, one can find values ranging from 50 mm till 180 mm over the Amazon basin. However, rainfall values between 50 and 80 mm are more locally concentrated, with more dominant rainfall values ranging from 100 and 180 mm. The results still show small values of rainfall associated with EET-II occurring over northeast Brazil, with moderate quantities of rain over southern Brazil. A wide ranging area oriented southwestern-southeast over Brazil suggests that EET-II is responsible for 5% - 15% of the total accumulated rainfall (Figure 3(b)). In other parts of Brazil, like the northeast, southeast and south, EET-II can be responsible for up to 30% of the total accumulated rainfall. On Marajó Island and neighboring areas EET-II yields ~15% of the total rainfall, while EET-I produces ~30% of the total precipitation (see Figure 2(b)).
The accumulated rainfall produced by EET-III is shown in Figure 4(a). From 50 up to 100 mm of rainfall is produced by this kind of extreme event over most of Brazil, excepting the littoral part of Pará and Amapá states, whose values exceeded 180 mm. Relative to total rainfall, EET-III is responsible for 5% - 15% in the Amazon basin, 25% - 45% in northeast Brazil and 10% - 45% over Roraima State, respectively (Figure 4(b)).
The total number of events (frequency) occurring in each grid-point during the analyzed period is presented in Figures 5(a)-(c). The frequency was computed by compiling the days where the threshold values of each EET were achieved. This figure can help us understand why the different types of extreme events produce different quantities of rain. For example, it can be noted that similar quantities of rainfall over the Amazon basin and southeast Brazil are produced by different numbers of extreme events (Figure 5(a)). In the former case, a mean quantity of ~200 - 300 mm of rain is associated with 100 cases, while the latter needed nearly 30% more cases to produce the same quantity of rainfall. Moreover, it is notable that EET-I is more frequent in the northern Amazon basin than in the southern part. A smaller number of events are observed over southern and northeast Brazil. The frequency of EET-II is less spatially homogeneous than that of EET-I (Figure 5(b)); however, there is a more homogeneous region over southeast Brazil where the number of cases is high. The frequency of EET-III presents a more uniform spatial patter, with the highest values over Bahia State, ~24 cases by grid-point (Figure 5(c)).
3.2. Temporal Patterns in Extreme Rainfalls
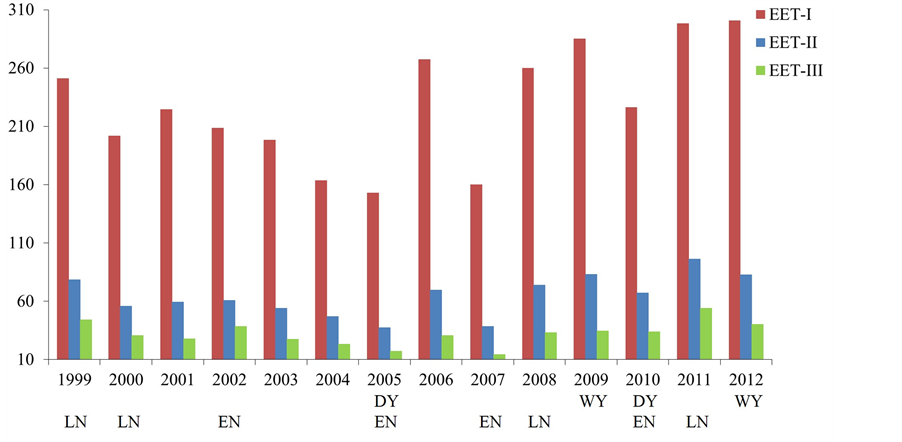
Temporal variations in DJF area-mean accumulated rainfall related to ETTs during the period 1999 to 2012 are presented in Figure 6. This Figure shows the relative contributions of the extremes that occurred over just the Amazon basin area, i.e., only gridded-data included inside this region is considered for evaluation. In addition to this Figure there is information about ENSO and dry/wet year conditions. According to Figure 6 and in accordance with the previous results, the mean quantity of rainfall produced by ETT-I is greater than that of the other extremes. The inter-annual variability in the three kinds of extremes is easily observed. As can be seen, the three kinds of rainfall extremes produced greater rainfall quantity in the last 7 years, with maxima during the last two years (2011 and 2012). 2011 was characterized by a La Niña condition and 2012 by a record flood. During La Niña (El Niño) years the quantity of rainfall over the Amazon basin is expected to be higher (smaller) than normal years. During the years 2005 and 2007, characterized by a positive ENSO phase, minimum values of accumulated rainfall were observed. In 2005 the Amazon basin experienced its worst drought condition, with serious damage to people living near the riverside. The quantity of rainfall extremes over the Amazon basin was greatly reduced in the years 2002, 2005, 2007 and 2010 (El Niño years), while during the La Niñas of 1999, 2008 and 2011 the quantity of rainfall related to extremes increased. The contrasting rainfall quantities between opposite phases of ENSO are notable for EET-I, especially for the years 2009 and 2012. Both were characterized as wet years, and the mean accumulated rainfall achieved, respectively, was 758 and 799 mm. In the years 2005 and 2010, characterized as dry conditions, the mean accumulated rainfall was nearly 402 mm. Similarly, time variation and ENSO dependence can be observed in the case of EET-II and EET-III. There is one interesting case where the mean accumulated rainfall yielded by EET-III was higher than that for ETT-II; this occurred in 2002,
 (a)
(a) 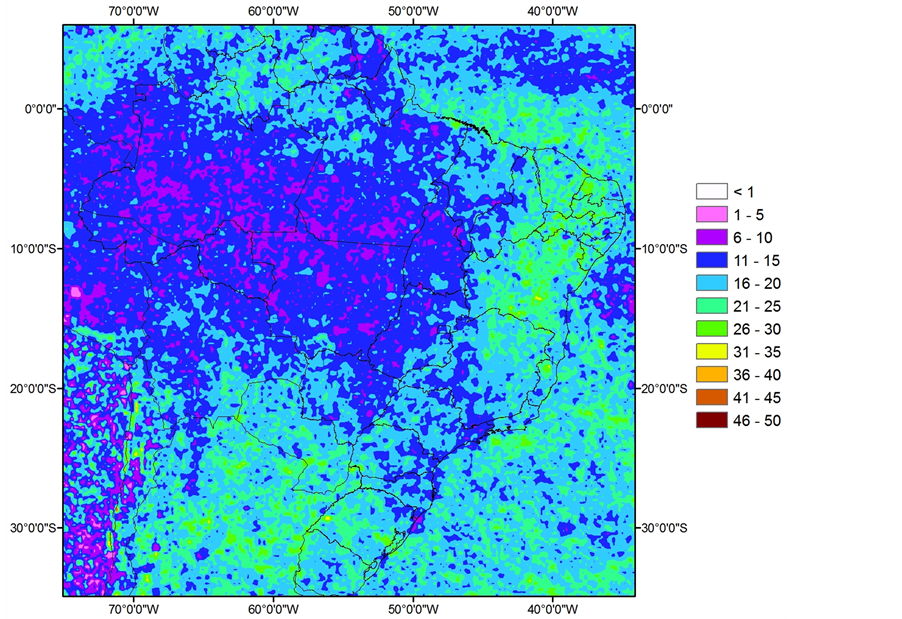 (b)
(b) 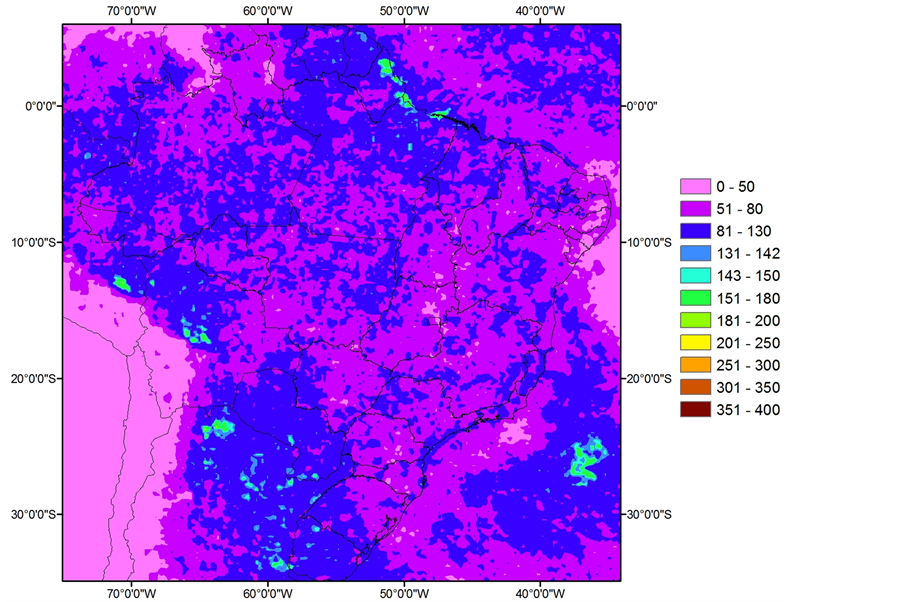 (a)
(a) 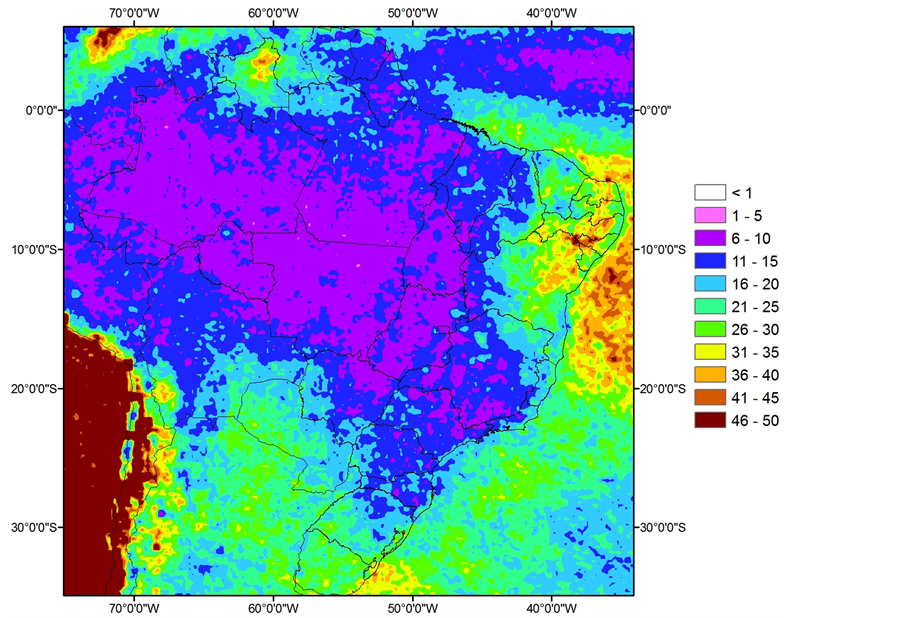 (b)
(b) 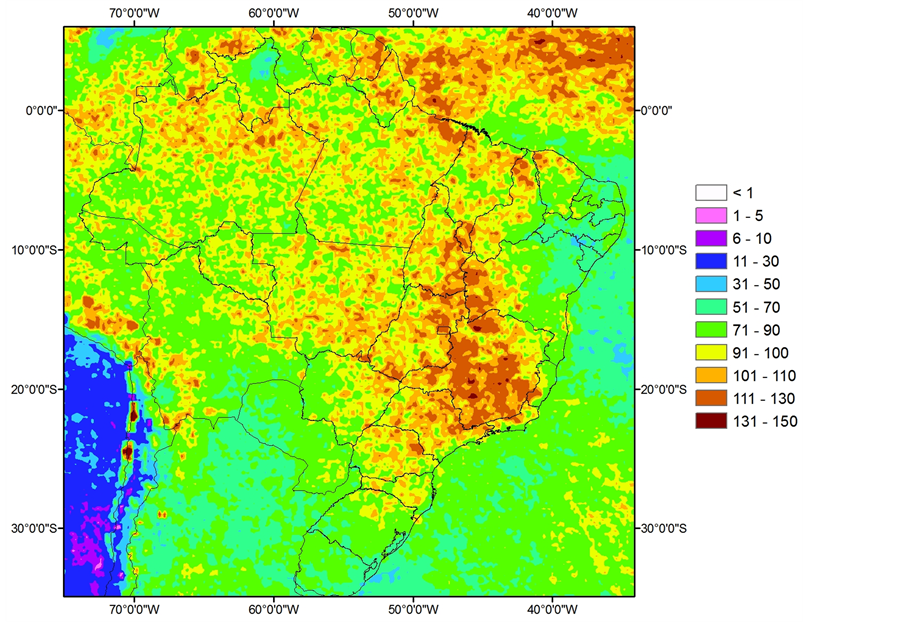 (a)
(a)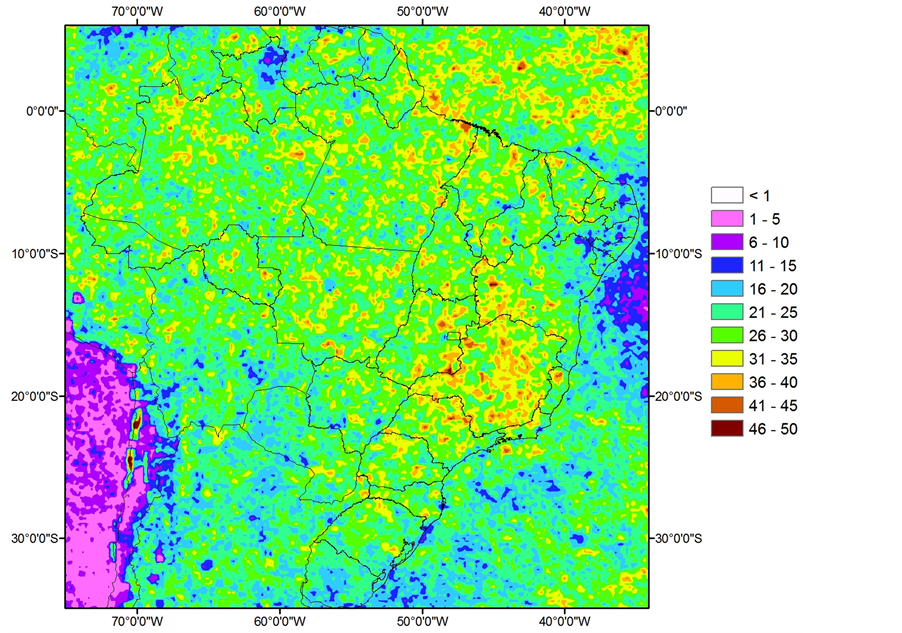 (b)
(b)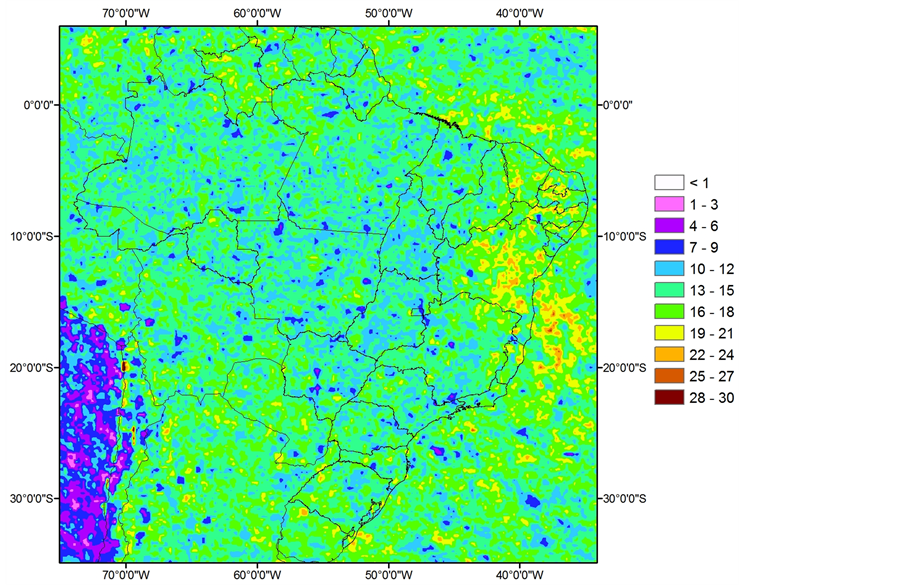 (c)
(c)
Figure 5 Number of events (Frequency) by grid point for EET-I (a), EET-II (b) and EET-III (c) occurred during all summer months for the period of 1998-2013.
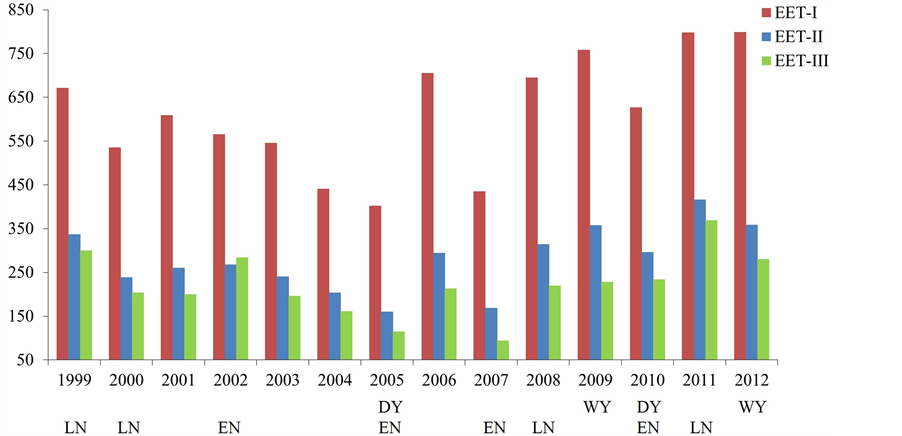
Figure 6. Temporal variation (1999 to 2012) of DJF mean accumulated rainfall over the Amazon basin region. Red, blue and green color bars denote the rainfall related, respectively, to EET-I, EET-II and EET-III. The bottom labels EN, LN, DY and WY, respectively, refer to El Niño Year, La Niña Year, Dry Year and Wet Year.
a La Niña year.
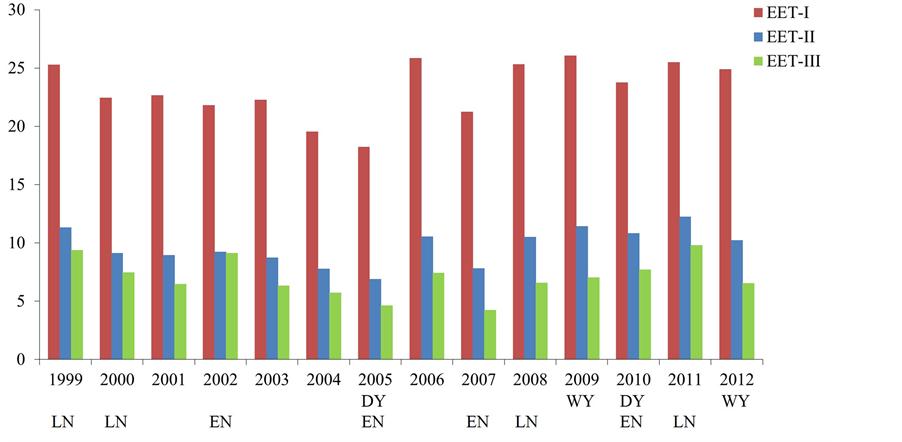
Area-mean temporal variations the frequencies of DJF extremes related to EETs during the period from1999 to 2012 are presented in Figure 7. This Figure presents the relative frequencies of extremes occurring just over the Amazon basin, like in Figure 6. According to Figure 7, the mean frequency of ETT-I is the highest. The mean accumulated quantity of extremes follows a similar pattern of frequency, i.e., the most frequent events are those producing the largest quantity of rainfall. In the first two years of the period of study, 2011 and 2012, 298 and 301 cases of EET-I were registered over Amazon basin, respectively; similarly, 80 and 70 cases of EET-II and 50 and 40 cases of EET-III. Moreover, the relationships between the frequency of events and wet/dry and EL Niño/La Niña years are similar to those for the accumulated rainfall totals (Figure 6).
Figure 8 shows the percent contributions of extreme rainfall events relative to the total rainfall. According to the Figure, different kinds of rainfall extremes produce different percentages of rainfall, with the largest contribution coming from the least rare type of extreme rainfall, EET-I. Thus, EET-II and EET-III only produce small quantities of rainfall related to the total quantity of rain. It can be observed that none of the extremes reach 50% of the total rainfall, indicating that most rain is produced by normal events. However, from 2006 till 2012 the sum of all types of extreme events reached its highest values for the period. Furthermore, even with a small number of instances EET-III produces large quantities of rainfall over the Amazon basin, suggesting that such
events are important to the climatology of the region.
4. Conclusions
Here, we have identified three kinds of extreme rainfall events that are very important for understanding how they contribute to the accumulated rainfall climatology for the summer season over the studied area. Among the results it was observed that the rarer the extreme event the more rainfall it produces; however, due to their low frequency of the rarest events, EET-III, are responsible for just 5% - 15 % of the total rainfall in the Amazon basin, 25% - 45% in northeast Brazil and 10% - 45% over the State of Roraima. In the northeast, southeast and south, EET-II can produce up to 30% of the total accumulated rainfall. On Marajó Island and in neighboring areas EET-II yields ~15% of the total rainfall, while EET-I produces ~30% of the total precipitation. Moreover, it is notable that EET-I is more frequent in the northern Amazon basin than in the southern portion. A smaller number of events are observed over southern and northeastern Brazil. The frequency of EET-II is less spatially homogeneous than that of EET-I. The frequency of EET-III presents a more uniform spatial pattern, with the highest values over Bahia State, ~24 cases by grid-point.
Temporal variations in the area-mean accumulated rainfall show that extreme rainfall events present interannual variations strongly tied to ENSO events. Furthermore, the wet/dry years over the Amazon basin are strongly related to the behavior of the rainfall produced by all kinds of rainfall extremes. For example, results show that during the La Niña of 2011 the quantity of rainfall produced by EET-III exceeded the quantity of rain yielded by EET-II during the El Niño year of 2010. The same behavior is observed for the ENSO conditions of 2007 and 2008, respectively, characterized as EL Niño and La Niña years. Over the Amazon basin the three kinds of rainfall extremes produced more rainfall in the last 7 years, reaching a maximum during the last two years of the analyzed period, 2011 and 2012. The year of 2005 presented the lowest values of rainfall produced by extreme events, suggesting that the extremes are very important to the total accumulated rainfall. As the total quantities of rainfall produced by extreme rainfalls depend on the total number of events, their frequency seems to be strongly tied to wet/dry and ENSO events as well as the percentage of total rainfall produced by them.
This is the first time the contributions made by extreme rainfall events to the total rainfall over the Amazon basin have been quantified. We verified that the relative contribution is strongly tied to the frequency of the extremes. Furthermore, extreme rainfall events are closely related to ENSO and wet/dry years. As a recommendation for future work, this technique could also be applied to quantify future changes in intensity and frequency of extreme rainfalls under a condition of warmed climate, which is expected to occur in the near future. Another suggestion is to evaluate model outputs and quantify their abilities to simulate these kinds of events.
Acknowledgements
ALB and JAPV would like to thank the Amazon State University and the Amazon Climate Change Network Project (REMCLAM/FINEP), process number 01.10.0470.00 by the financial support.
References
- Marengo, J.A. (2009) Impactos de extremos relacionados com o tempo e o clima—Impactos sociais e econômicos. Boletim do Grupo de Pesquisa em Mudanças Climáticas, n. 08, 1-5.
- Marengo, J.A., Nobre, C.A. and Tomasella, J. (2008) The Drought of Amazon in 2005. Journal of Climate, 21, 495- 516. http://dx.doi.org/10.1175/2007JCLI1600.1
- Marengo, J.A., Javier, T., Alves, M.A., et al. (2011) The Drought of 2010 in the Context of Historical Droughts in the Amazon Region. Geophysical Research Letters, 38, Article ID: L12703. http://dx.doi.org/10.1175/2007JCLI1600.1
- Marengo, J.A., Tomasella, J. and Soares, W.R. (2012) Extreme Climate Events in the Amazon Basin. Theoretical and Applied Climatology, 107, 73-85. http://dx.doi.org/10.1007/s00704-011-0465-1
- Espinoza, J.C., Ronchail, J., Frappart, F., et al. (2012) The Major Floods in the Amazonas River and Tributaries (Western Amazon Basin) during the 1970-2012 Period: A Focus on the 2012 Flood. Journal of Hydrology, 14, 1000- 1008.
- Satyamurty, P., da Costa, C.P., Manzi, A.O., et al. (2013) A Quick Look at the 2012 Record Flood in the Amazon Basin. Geography Research Letter, 40, 1-6. http://dx.doi.org/10.1002/grl.50245
- Satyamurty, P., De Castro, A.A., Tota, J., et al. (2010) Rainfall Trends in the Brazilian Amazon Basin in the Past Eight Decades. Theoretical and Applied Climatology, 99, 139-148. http://dx.doi.org/10.1007/s00704-009-0133-x
- Marengo, J.A., Alves, L., Valverde, M., Laborbe, R. and Rocha, R. (2007) Eventos extremos em cenários regionalizados de clima no Brasil e América do Sul para o Século XXI: projeções de clima futuro usando três modelos regionais. Ministério do Meio Ambiente, Secretaria de Biodiversidade e Florestas, Diretoria de Conservação da Biodiversidade, Relatório 5, 8-62.
- Hegerl, G.C., Zwiers, F.W., Stott, P.A. and Kharin, V.V. (2004) Detectability of Anthropogenic Changes in Annual Temperature and Precipitation Extremes. Journal of Climate, 17, 3683-3700. http://dx.doi.org/10.1175/1520-0442(2004)017<3683:DOACIA>2.0.CO;2
- Valverde, M. and Marengo, J.R. (2011) Rainfall Extremes Events Climatology over the Amazon Basin. Proceedings of the Global Conference on Global Warming, Lisbon, 11-14 July 2011, 1-8.
- Marengo, J.A., Nobre, C.A., Chou, S.C., Tomasella, J., Sampaio, G., Alves, L.M., Obregón, G.O., Soares, W.R., Betts, R. and Kay, G. (2011) Riscos das Mudanças Climáticas no Brasil. Análise Conjunta Brasil-Reino Unido Sobre os Impactos das Mudanças Climáticas e do Desmatamento na Amazônia, 2-56.
- Carvalho, L.M.V., Jones, C. and Liebmann, B. (2003) The South Atlantic Convergence Zone: Persistence, Intensity, Form, Extreme Precipitation and Relationships with Intraseasonal Activity. Journal of Climate, 17, 88-108.
- Rozante, J.R., Moreira, D.S., Gonçalves, L.G., et al. (2010) Combining TRMM and Surface Observations of Precipitation: Technique and Validation over South America. Weather and Forecasting, 25, 885-894. http://dx.doi.org/10.1175/2010WAF2222325.1
- Vila, D.A., Goncalves, L.G.G., Toll, D.L. and Rozante, J.R. (2009) Statistical Evaluation of Combined Daily Gauge Observations and Rainfall Satellite Estimates over Continental South America. Journal of Hydrometeorology, 10, 533- 543. http://dx.doi.org/10.1175/2008JHM1048.1
- Frich, C., Alexander, L.V., Della-Marta, P., Gleason, B., Haylock, M., Klein Tank, A.M.G. and Peterson, T. (2002) Observed Coherent Changes in Climatic Extreme during the Second Half of the Twentieth Century. Climate Research, 19, 193-212. http://dx.doi.org/10.3354/cr019193
NOTES

*Corresponding author.