Atmospheric and Climate Sciences
Vol. 2 No. 2 (2012) , Article ID: 18822 , 17 pages DOI:10.4236/acs.2012.22018
Hydrometeorological Modeling Study of Tropical Cyclone Phet in the Arabian Sea in 2010
1 Department of Irrigation and Hydraulics, Faculty of Engineering, Cairo University, Giza, Egypt
2 Department of Irrigation and Hydraulics, Faculty of Engineering, Ain Shams University, Cairo, Egypt
Email: *mohammed.abou-elhaggag@dargroup.com
Received October 25, 2011; revised November 29, 2011; accepted December 20, 2011
Keywords: Cyclone Phet; Arabian Sea; Oman; WRF; Rainfall; Orography; Simulation; Convection
ABSTRACT
Tropical cyclone Phet is the second strongest tropical cyclone ever recorded in the Arabian Sea. Phet made landfall in the northeast mountainous area of Oman in early morning on 4 June in 2010, causing a breaking record rainfall in this arid region of 488 mm/48 h. The cyclone heavy rainfall triggered flash floods causing enormous losses in lives and infrastructure in northeast Oman. The state of the art Advanced Research WRF model is used to study the atmospheric circulation and to reproduce the heavy rainfall over Oman. Three one-way nested domains with 32 vertical layers with terrain following sigma coordinate are used to setup eight numerical experiments aiming to investigate the effect of initialization time, horizontal grid resolution and terrain elevations on reproducing the cyclone track, intensity and heavy rainfall. Simulation results show negligible effect of model initialization time on cyclone track, intensity and rainfall. In contrast, the orographic effect played a substantial role in rainfall simulation over northeast Oman. The heavy rainfall was a combination of the cyclone circulation effect and the orographic lifting in the mountains. The northeasterly cyclone moist-warm wind was lifted in the Omani mountains releasing its potential energy and enhancing further thermal convection. The numerical experiment with the highest terrain elevation (RUN3.3-C) resulted in overestimation of observed rainfall due to the enhanced topographic lifting of the saturated cyclone wind. Experiment with similar horizontal grid resolution but smoother terrain elevation (RUN3.3-TER) resulted in much less rainfall amount comparable to the observed values. The increased precipitation in RUN3.3-C is due to the increase in the rainwater and cloud water and graupel of the explicit moisture scheme.
1. Introduction
A tropical cyclone (TC) is the generic term for a nonfrontal synoptic-scale low-pressure system originating over tropical or subtropical waters with organized convection and definite cyclonic surface wind circulation [1]. In North Indian Ocean (NIO), the occurrence of TCs is not as many as in other basins (northwest Pacific Typhoons or Northwest Atlantic Hurricanes), only few cyclonic storms form each year [2]. NIO is a potentially energetic region for the development of cyclonic storms. The Bay of Bengal contributes 7% of the global annual tropical storms, at the same time; Arabian Sea contributes 2% of the global annual tropical storms [3]. Much of the TCs-related damage is attributed to storm surges, high winds, and damage associated with strong thunderstorm complexes, in addition to the contribution of tropical cyclone-induced rainfalls [4].
The recent four severe cyclonic storm generated over the NIO are perfect examples of severe hazards associated with TCs, namely TC Gonu, TC Sidr, TC Nargis, and TC Phet. The super cyclone Gonu formed in the Arabian Sea (2-7 June in 2007) is considered the worst natural disaster in Oman, it caused about 4.2 billion $US in damage, fifty deaths and 20,000 people wereaffected. In Iran, the cyclone caused twenty-eight deaths and 215 million $US in damage [5]. In November 2007, a Super Cyclonic Storm (SIDR) formed in the Bay of Bengal. The death toll due to SIDR was estimated to be tenthousands with about 1.7 billion $US in damage. Tropical Storm Nargis (2008) formed in the Bay of Bengal and landed in the Irrawaddy Delta in Myanmar in early May 2008. With its maximum low-level wind speed over 60 m·s–1, Nargis caused at least 146,000 fatalities and over 10 billion $US economic loss, the worst record in Myanmar [6]. Cyclone Phet formed in the Arabian Sea on May 31 in 2010, it had two landfalls in Oman and in Pakistan on 4 June and on 6 June, respectively. TC Phet caused about 1 billion $US in damage, fourty-four deaths and several thousands of people were affected.
Impact from TCs is one of the major natural hazards to countries located in the southern part of the Arabian Peninsula, namely Oman and Yemen (refer to Figure 1 for geographic location). In the last few years, Oman was affected by the two strongest TCs ever recorded in the Arabian Sea: TC Gonu that made a landfall in Oman in early June 2007 and TC Phet that made landfall in early June 2010. The most apparent devastating effect of TCs in Oman is associated with the TC induced heavy rainfall and the flash floods following. In the meanwhile, rainfall arising from TCs can be an important water source for agriculture and other applications over subtropical and semi-arid regions [7].
An important concern about the consequences of the 21st century climate change is the potential increase in tropical cyclone activity [8]. The NIO is one of the hot spots with respect to climate change effects on the intensification of TCs. Under changing climate conditions, an increase in Sea Surface Temperature (SST) and largescale circulation over the NIO are taking place. Reference [6] indicates that the SST over the NIO has already increased 0.6˚C since 1960, the largest warming among tropical oceans. Reference [10] indicates that tropical easterly jet associated with the summer monsoon is weakening in recent years, reducing the easterly vertical shear and hence provide favorable conditions for more severe TCs. Using ensample simulations from fifteen coupled general circulation models participated in the Intergovernmental Panel for Climate Change (IPCC) Forth Assessment Report (AR4), [6] indicates that there is a significant increase in the potential intensity of tropical cyclones in the Arabian Sea.
The status of meteorological observations in the Arabian Peninsula has generally been inadequate to capture the mesoscale aspects of the cyclogenesis of tropical cyclones or even the associated strong winds and heavy rainfall. This is ideal situation where more dependence on numerical simulation tools implementation becomes crucial. Numerical models based on fundamental dynamics and well-defined physical processes provide useful tools for understanding and predicting TCs [5]. In the last decade, there have been substantial improvements in the field of weather prediction by numerical models. The PSU (Pennsylvania State University)/NCAR (National Center for Atmospheric Sciences) meso-scale model MM5 [11] has been used extensively in large number of studies for the simulation of TCs. The recently developed Weather Research Forecasting (WRF) [9] system has improved model physics, cumulus parameterization schemes, planetary boundary layer physics, etc. The WRF model is currently taking leading position among atmospheric models and more members of the meteorologists’ community are now shifting the use of MM5 to WRF.
With current advances in computer resources, it becomes feasible to use high-resolution atmospheric models to study the characteristics of TCs and have better investigation of its associated hydrological hazards. Re-
 (a) (b)
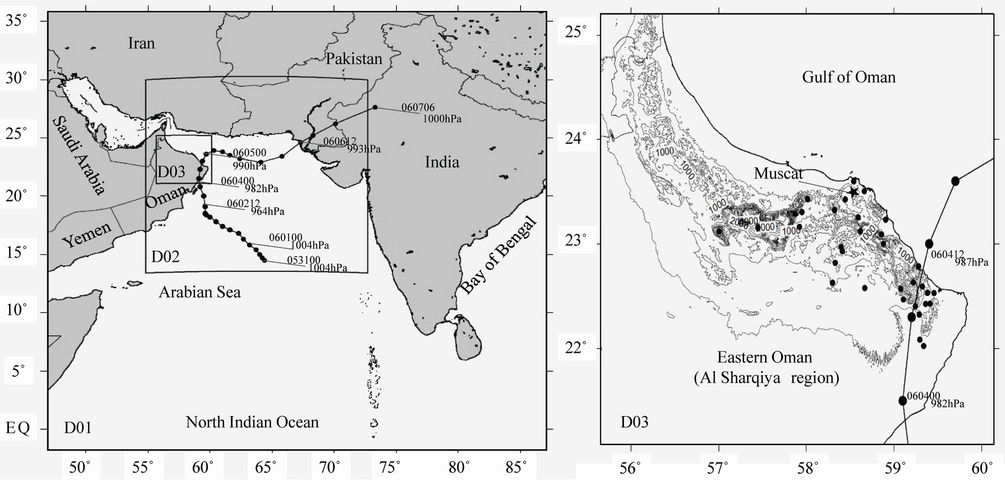
Figure 1. (a) The computational domains, the Joint Typhoon Warning Center (JTWC) best track, and central pressure of TC Phet (circles, every 6 h), and (b) the topography of the 1.667 km horizontal resolution model and the best track. The red-filled circles indicate the location of surface rainfall gauges. In Figure 1(b) the black star indicates the location of Omani capital (Muscat).
cent studies indicated that some high-resolution dynamical model simulations are capable of capturing the rainfall pattern of TCs. Reference [12] used the MM5 model to simulate tropical cyclone Fanoos over the Bay of Bengal. Reference [12] focused their study in testing the performance of different convection parameterizations in reproducing accurate cyclonic fields. They recommended Kain-Fritsch (KF, [13]) cumulus parameterization scheme over the Betts-Miller [14] and Grell scheme [15] in simulating cyclone track and intensity. Reference [3] presented a comparative study of the MM5 and WRF models in the simulation of three TCs (TC Mala in 2006, TC Gonu in 2007, and TC Sidr in 2007) over the NIO. Their results indicated that WRF has better performance with respect to track, intensity and rainfall prediction than the MM5 model. Reference [16] investigated the torrential rainfall associated with Typhoon Rusa in South Korea in 2002 through numerical simulation using WRF. WRF model successfully simulated the mesoscale rainfall distribution and timing resolving the complexity of forecasting associated with the interactions between environmental flows, typhoon flow, and local topography. Reference [17] studied the hydro-meteorological features of TC Gonu using a coupled atmosphere, ocean, and land surface modelling system with an atmospheric component based on the MM5 model. The simulated meteorological parameters used to drive a hydrological model of an example catchment in Oman. Reference [18] used the MM5 model to produce the meteorological forcing to study the high waves and storm surge of TC Nargis using a coupled atmosphere-ocean-wave model. Their results showed adequate performance of the MM5 model in reproducing the cyclonic characteristics of TC Nargis.
The main objective of this paper is to investigate the predictability of the heavy rainfall caused by TC Phet, which produced record-breaking rainfall of 488 mm in northeast Oman with a peak rainfall rate of 56 mm/h. For this purpose, we used the WRF model [8], a recently developed mesoscale numerical weather prediction system. We also used the observed behavior of rainfall at ground gaugesto support the simulation results in identifying the precipitation processes that maintained the heavy rainfall associated with TC Phet. In addition, we attempted to quantify the simulated rainfall in terms of the horizontal resolution of the model, the initial state of the cyclone, and the role of topography. Following this introduction, a brief description of the TC Phet obtained from India Meteorological Department Report [19] is given. The model setup and the numerical experiments are explained in Section 3. Simulation results and discussion are given in Section 4. Finally, the paper is concluded in Section 5.
2. TC Phet Synoptic Description and Heavy Rainfall
The Arabian Sea witnessed the formation of two cyclonic disturbances during 2010. Out of the two, one intensified up to the stage of very severe cyclonic storm (PHET) and the other up to the stage of cyclonic storm (BANDU). Track of TC Phet over the Arabian Sea is shown in Figure 1. TC Phet is the second strongest tropical cyclone in record in the Arabian Sea following the super cyclonic storm Gonu in 2007 [19]. Intense cyclones like Gonu and Phet have been extremely rare over the Arabian Sea, as most storms in this area tend to be small and dissipate quickly [5].
A low-pressure area with persistence convection developed over central Arabian Sea in association with the prevailing surge in monsoon flow. During this period, there was favorable upper-level environment (TC heat potential, upper level divergence, lower level relative vorticity, and moderate vertical wind shear, deep convection) and seawater with warm SSTin the order of 30˚C - 32˚C over the Arabian Sea. As a result, the system concentrated into a depression and lay centered over central Arabian Sea near 15˚N and 64˚E at 0300 UTC of May 31. Initially, the system moved in the northwest direction and intensified into a deep depression at 0000 UTC of 1 June and into a cyclonic storm, Phet at 0900 UTC of 1 June withits center lay at 16.0˚N and 63.0˚E (Figure 2(a)). Continue heading in a northwest direction, it further intensified into a severe cyclonic storm at 0000 UTC on 2 June, when its eye was visible from KALPANA satellite (Figure 2(b)) with a center located near 17.5˚N and 61.0˚ E. The system again intensified into a very severe cyclonic storm at 0600 UTC on 2 June remaining practically stationary over the region with center at 18.0˚N/60.5˚E, keeping a slow northwest movement. The lowest estimated central pressure of the system was recorded at this stage of 964 hPa (Figure 1(a)) and estimated maximum sustained surface wind speed of 44 ms–1 [19]. At 0000 UTC on 3 June, the intensity of the system started to weaken, meanwhile, heading directly to the north toward Oman (Figure 2(c)).
The system made a first landfall in the northeast coast of Oman between 0000 & 0200 UTC on 4 June near 21.50˚N and 59.50˚E (Figure 2(d)). After crossing over to land, it assumed north/northeast movement and re-entered into the Gulf of Oman at 1200 UTC on 4 June (Figure 1(a)). At 2300 UTC on 4 June the system weakened into a cyclonic storm (Figure 2(e)). It crossed the Pakistan coast close to south of Karachi between 1230 and 1330 UTC on 6 June 2010 (Figure 2(f)), keeping east-northeast movement across south Pakistan before dissipating in the evening of 7 June. TC Phet is the rarest of the rare track in the Arabian Sea as per the recorded history during 1877-2009 [19]. It has the longest track in recent years with a relatively long lifetime of 7.6 days [20]. Because of such unique track, the system affected three countries, viz. Oman, Pakistan and India (Figure 1(a)).
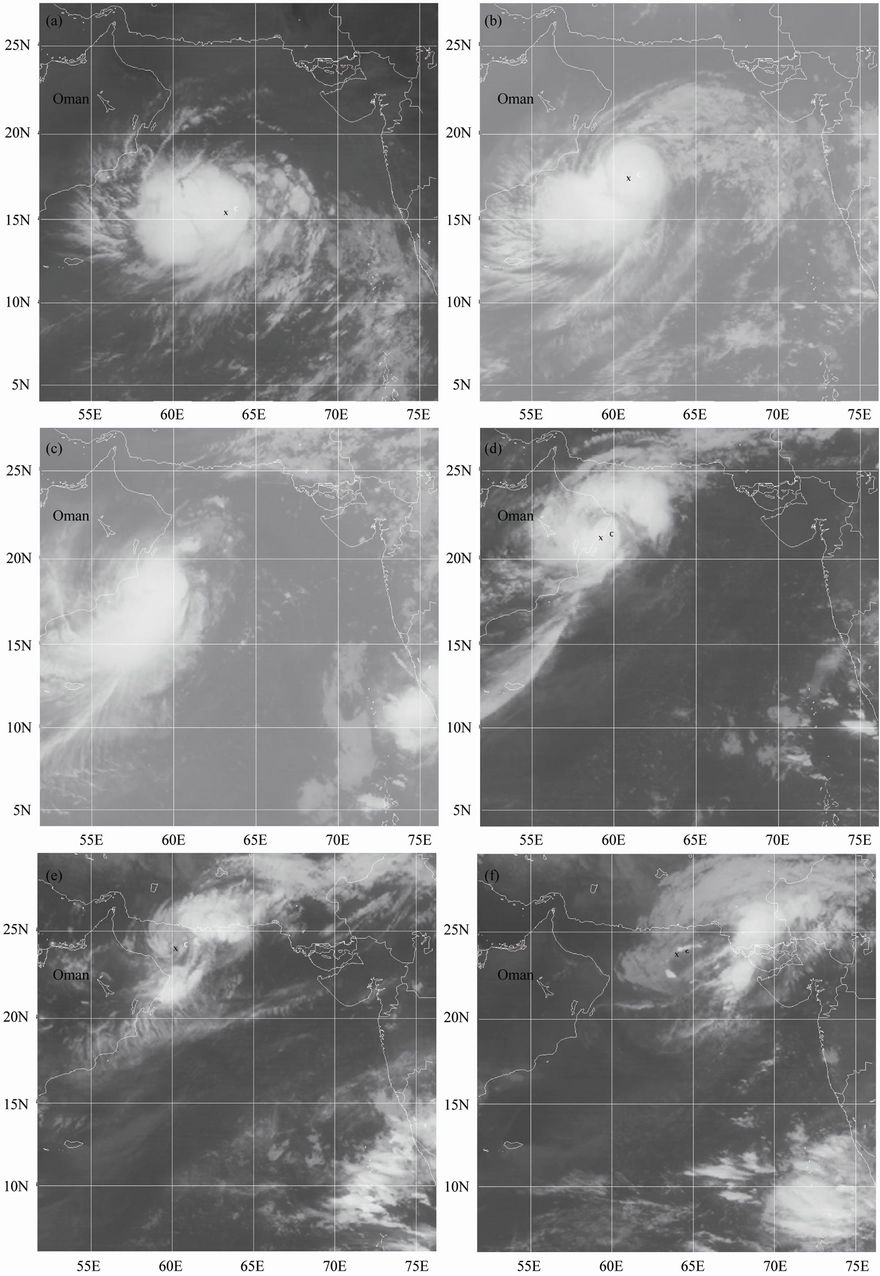
Figure 2. KALPANA satellite imagery (Infrared channel) of tropical cyclone Phet showing different stages of intensity and propagation from 1-6 June in 2010. (a) 01 June 2010, 00UTC; (b) 02 June 2010, 00UTC; (c) 03 June 2010, 00UTC; (d) 04 June 2010, 00UTC; (e) 05 June 2010, 00UTC; (f) 06 June 2010, 00UTC.
Phet brought not just strong winds but also heavy rains to the Arabian Sea, northeast Oman, and the coast of Pakistan. While TC Phet passed over Oman, heavy rainfall occurred in this region over north and northeast coastlines and inland. Phet produced the second largest record-breaking event rainfall depth (the largest rainfall record was during TC Gonu in 2007) in Mazara (56 km to the southeast of Muscat) and JabalHilm (127 km to the southeast of Muscat) at the foot of northern Oman mountain range. Mazara and JabalHilm are located upwind of the northeasterly wind originating from Phet as it approached and passed over Oman.
Figure 3 shows the distribution of the observed 48 h rainfall and the hourly rainfall time series at Mazara and JabalHilm rain gauges from 0000 UTC 3 June to 2300 UTC 4 June. It is based on hourly rain gauge data from the Omani Minstry of water resources (Available stations are shown in Figure 1(b)). It should be noted that the relatively sparse spatial distribution of the rainfall gauges and the absence of gauges over most of the domain (Figure 1(b)) have a profound effect on the areal rainfall distribution. The objective of using this distribution is only to show the relatively higher accumulated rainfall depth received at certain sites.
The maximum local rainfall recorded at the two stations is as follows: Mazara, 485.4 mm; and JabalHilm, 472.4 mm. These stations are approximately located in the northeast of Oman, to the left of Phet track (Figures 1 and 3). As the TC penetrated north-northeastward through Oman from 0000 UTC 4 June to 0000 UTC 5 June, the maximum hourly rainfall (55 mm at Mazara and 51.6 mm at JabalHilm) are directly attributable to the TC occurred at 0600 UTC 4 June. Figure 4 shows TRMM estimated CyclonePhet’s heaviest rainfall (600 or more millimetres) occurred over open waters of the Arabian Sea. One area of northeast Oman received as much as 450 millimetres, while Pakistan received between 150 - 300 millimetres.
National Center for Environmental Prediction (NCEP) final reanalysis (FNL) data was analyzed to investigate the prevailing synoptic conditions during Phet genesisand movement. Figure 5 shows the 850 hPa geopotential height, relative humidity and wind fields at 0000 UTC on 1 to 6 June. The genesis of the Phet associated with the southerly surge of the southwest monsoon during its onsetphase (Figure 5(a)). Meanwhile, a persisten tridge of the equatorial high pressure laid over Western India was blocking the westward movement of the cyclone toward western India and focusing the cyclone movement initially in the northwest direction and later on to the north (Figure 5(a)-(f)). Moreover, enhanced pressure gradient between the cyclone and the pressure ridge intensified the southerly flows, which convey warm moist air toward the north. The cyclone wind field was intensified during its propagating through the Somali low-level jet in 2 - 3 June resulting in enhanced convection and significant amounts of rainfall over the Arabian Sea. The relatively cold dry air continental air masses over Arabian Peninsula, Iran, Pakistan and India caused weakening of the cyclone intensity upon its landfall.
3. Numerical Model Description and Experiment Design
All numerical experiments were conducted using the state of the art weather research and forecasting model (WRF-ARW, Version 3.3) [8]. WRF-ARW is a fully compressible non-hydrostatic model with Arakawa-C grid
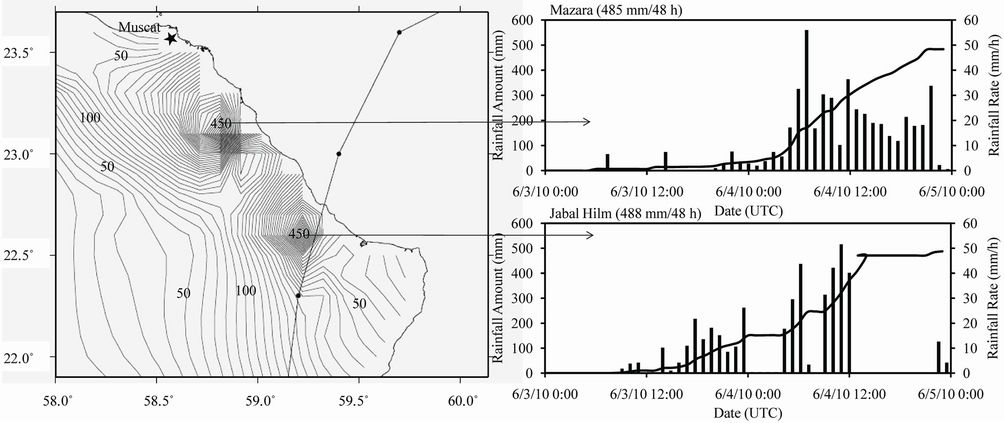
Figure 3. The 48 h accumulated rainfall observed at surface rain gauges from 0000 UTC 3 to 0000 UTC 4 June 2010 with time series of hourly rainfall at Mazara and JabalHilm rain gauges.
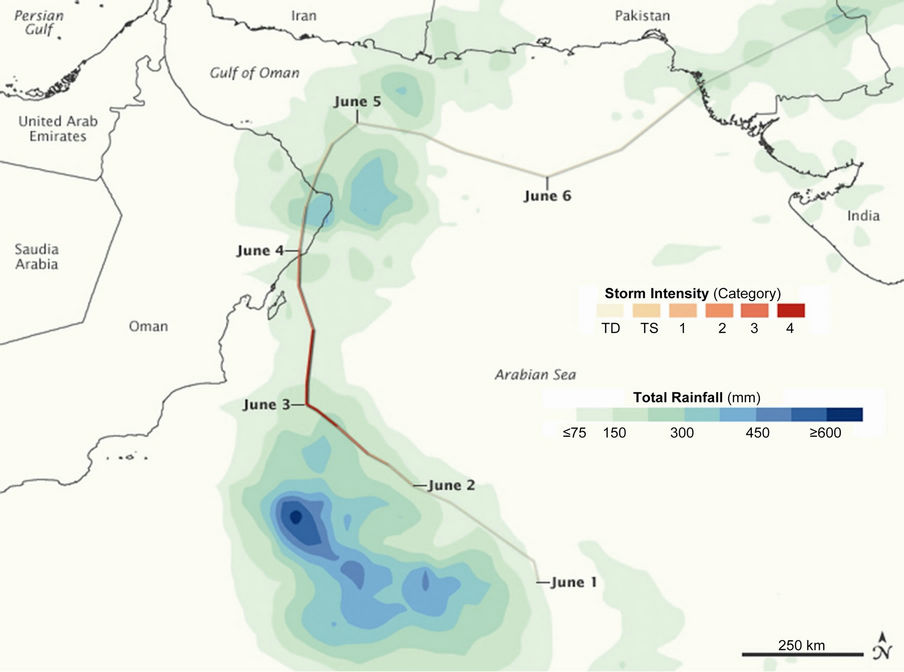
Figure 4. TRMM rainfall map shows the total rainfall triggered by TC Phet from 00 UTC 31 May to 00 UTC 7 June in 2010, colored line indicates storm track and intensity. http:/www.nasa.gov/mission_pages/hurricanes/archives/2010/h2010_phet.html
system. Performance of any numerical model in tropical cyclone forecast depends on how accurate the different physical processes are parameterized in the model [12]. Cumulus convection, surface fluxes of heat, moisture, momentum, vertical mixing in the PBL, radiative heating and cooling play important roles in the development of tropical cyclones [21].
The model physics package includes the WRF SingleMoment 6-class scheme for cloud microphysics with ice, snow and graupel processes [22,23], the Kain-Fritsch scheme with deep and shallow convection sub-grid parameterization using mass flux approach with downdrafts and CAPE removal time scale [13]. The planetary boundary layer was given by the Yonsei University scheme (YSU PBL) with non-local explicit entrainment layer and parabolic profile in unstable mixed layer [24]. The Noah land surface model [25] used for the land surface, the rapid radiative transfer model (RRTM) longwave scheme [26] used for longwave radiation, and the Dudhia shortwave scheme used for the atmospheric radiation processes [27].
The model configuration consists of one-way interactive triple-nested domains with a Mercator map projection (Figure 1(a)). A 3.33 km domain covering north eastern Oman (Domain 3, 151 × 151) is nested in a 10 km domain (Domain 2, 199 × 199) covering the Arabian Sea, which in turn nested in a 30 km domain (Domain 1, 150 × 150) covering a larger area of NIO (Figure 1(a)). All domains have 32 vertical layers with terrain following sigma coordinate, and the model top is at 50 hPais the same in all domains. The cumulus parameterization was not used in Domain 3 due to its fine grid size. Recent studies using WRF-ARW [28-30] argued that convection parameterization could be switched off at horizontal grid spacing below 4 - 5 km.
Global Geological Survey (USGS) elevation data, USGS global 25-category land use data, global 17 category soil data are used to represent elevation, land use, soil, respectively. Initial and boundary conditions for the coarse grid are constructed from the large-scale analysis data from NCEP at NCAR from 0000 UTC 31 May to 0000 UTC 7 June in 2010. The NCEP Final Analysis (FNL) data archived at NCAR exists every 6 hours at a spatial resolution of 1˚ × 1˚ at 27 standard pressure levels under 100 hPa. The data include two-dimensional variables including skin temperature, sea level pressure and
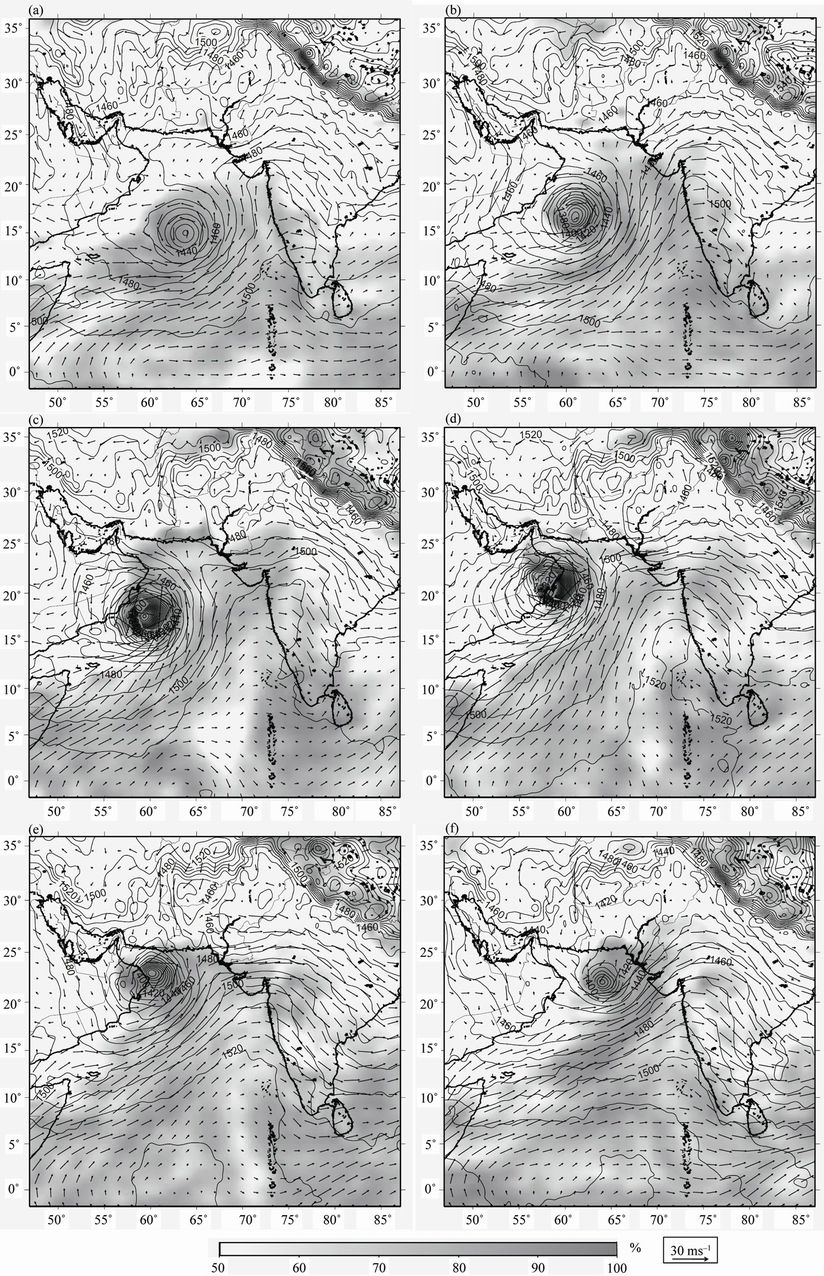
Figure 5. The 850 hPageopotential height (solid contours), relative humidity (shaded), and wind vectors (ms–1) for (a) 0000 UTC 1 June; (b) 0000 UTC 2 June; (c) 0000 UTC 3 June; (d) 0000 UTC 4 June; (e) 0000 UTC 5 June; and (f) 0000 UTC 6 June.
three-dimensional variables of temperature, geopotential height, U and V components and relative humidity. The resulting fields are interpolated to the model levels and the initialization process is completed with interpolation of the coarse grid fields to the fine grid. Real Time Global SST analysis data (RTG SST) available at horizontal resolution of 0.083˚ × 0.083˚ [31] is used to represent the sea surface temperature during the event.
Eight numerical experiments were designed and performed to investigate the characteristics of the simulated cyclone and associated rainfall. Table 1 presents summary description of the experiments. The objectives of these numerical experiments are to investigate 1) the effect of the initialization timing on simulated tropical cyclone track, intensity and associated rainfall and 2) the effect of high-resolution topography on the simulated rainfall in northeast Oman in domain 3. The control experiment (RUN30-C) started at 0000 UTC on 31 May for 168 h. This time coincides with Phet early genesis time. RUN10-C and RUN3.3-C were nested in RUN30-C and were integrated for the same time as in their mother domain. RUN30-I was provided a different initial time at 0000 UTC on 3 June for a total integration time of 96 h. RUN10-I and RUN3.3-I were nested in RUN30-I for the same integration time as in their mother domain. Two additional idealized numerical experiments were designed to investigate the effect of using higher terrain resolution on the simulated cyclone rainfall fields. RUN10- TER is identical to RUN10-C except for the terrain height was interpolated from RUN30-C. RUN3.3-TER is identical to RUN3.3-C except for the terrain height was interpolated from RUN30-C. These idealized experiments will results in a smoothed terrain field that is expected to have effects on the simulated local convection and rainfall in the northeast mountainous parts in Oman.
4. Results and Discussion
4.1. TC Track and Intensity
Figure 6 shows the computed track, eye pressure, and maximum wind speed for the simulated cyclones along with the observed best track data from the Joint Typhoon Warning Center (JTWC). The data shown in Figure 6 is based on the nested domain experiments: RUN10-C, RUN10-I, RUN10-TER, the results in the nested domain are highly dependable on their mother domains results and hence, it is expected that there is no difference among them. The simulated cyclones are rather following the exact track of the cyclone. In fact, the results show that the simulated tracks from the different experiment are almost the same. Some deviation from the observed tracks occurred in the early stages of the cyclone genesis over the Arabian Sea and after leaving the Omani land in the Gulf of Oman. The stage in which the cyclone reached its maximum intensity, the simulated cyclones exactly reproduced the cyclone track and its landfall point in northeast Oman. The reproduced timely landfall of the cyclone in Oman affords reasonable environmental circulations that facilitate enhanced simulation of observed rainfall.
Figures 6(b) and (c) show the minimum computed sea level pressure and maximum wind speed from the same experiments given above compared with the observed eye pressure and maximum wind speed. The three experiments show no significant difference in their simulated fields. All experiments resulted in delayed intensification of the cyclone by more than 12 h. The computed minimum sea level pressure was found to be 968 hPa compared to an observed value of 964 hPa. The computed maximum wind speed was found to be 37 ms–1 compared to an observed value of 43 ms–1. Despite of the satisfactory track of the simulated cyclones, the computed minimum pressure and maximum windspeed did not produce the rapid intensification of the cyclone that occurred in the morning of 2 June.
The above results show the insignificance of the Omani terrain resolution in the cyclone track and intensity. This is reasonable as the cyclone intensification is mainly depending on the heat provided from the seawater below. The initialization time did not have any effect on cyclone track and intensification. RUN30-I was initialized at 0000 UTC 3 June, after the observed peak of the
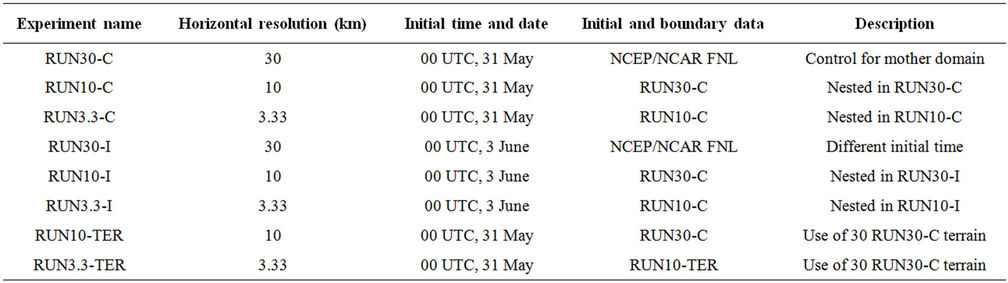
Table 1. Description of the performed numerical experiments.
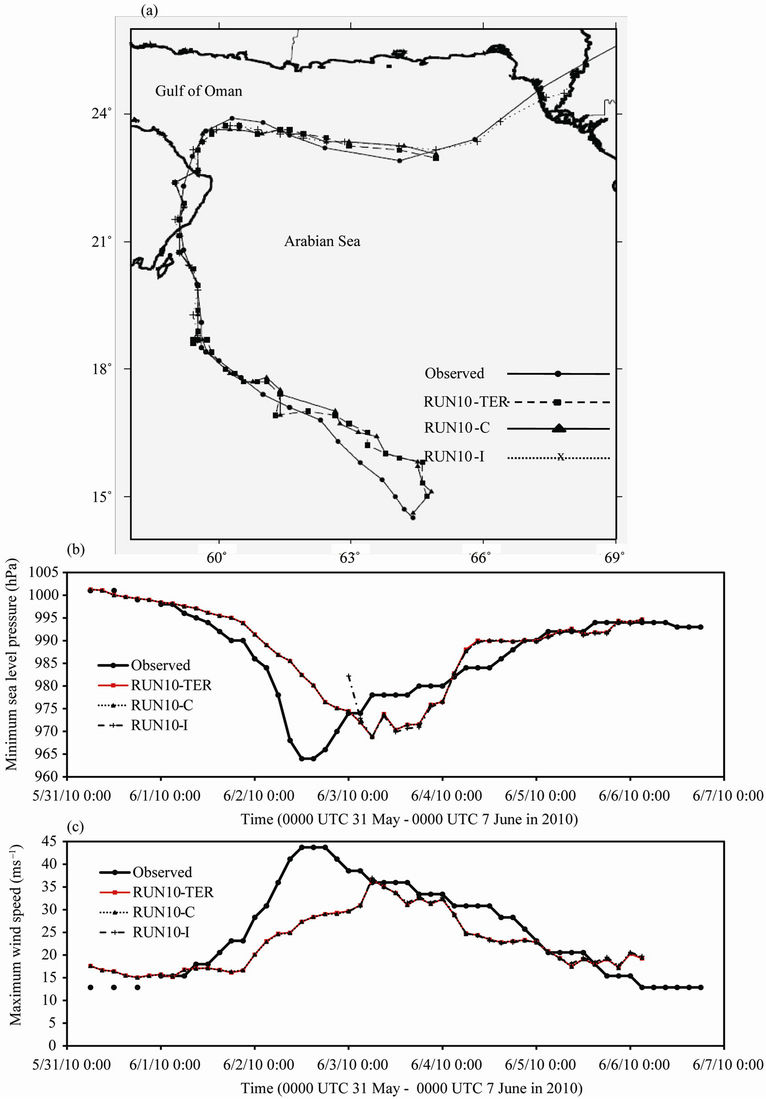
Figure 6. (a) Observed and simulated track of TC Phet from 0000 UTC 31 may to 0000 UTC 07 June 2010 with 3 h intervals; (b) Time series of observed and computed minimum sea level pressure (hPa); and (c) time series of observed and computed maximum wind speed (ms–1).
cyclone, however it reproduced the same pattern revealed in other experiments with intensified cyclone taking place on mid-day of 3 June.
4.2. Rainfall Simulation
Figure 7 shows the accumulated rainfall depth from 00 UTC on 31 May to 00 UTC on 7 June along with trajectories of simulated cyclones in the 10 km horizontal resolution experiments (RUN10-C, RUN10-TER). The only difference in the model setting in the two cases is the terrain resolution. RUN10-C used a terrain input based on a global terrain dataset with 5 min resolution
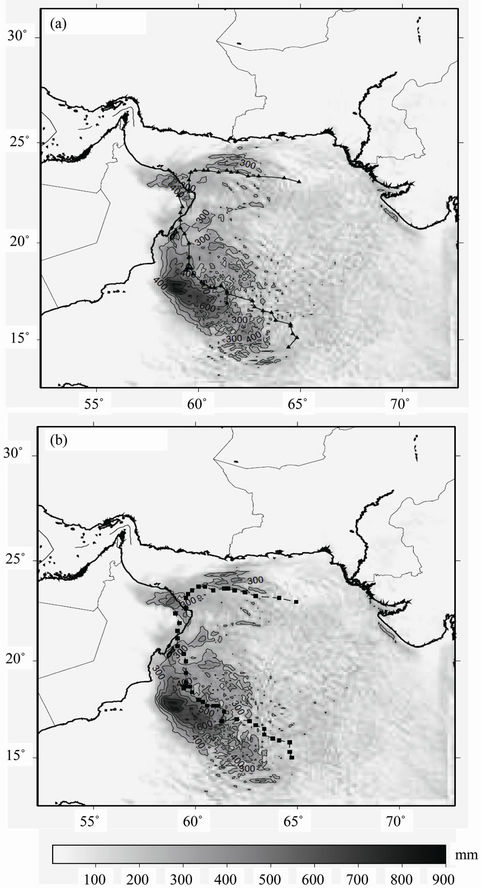
Figure 7. Accumulated total rainfall (mm, shaded and contours) from 0000 31 May to 0000 UTC 7 June in 2010 and trajectory of the simulated cyclones. (a) RUN10-C; (b) RUN10-TER.
(maximum elevation in northeast Oman was estimated to be 1650 m), while RUN10-TER used a terrain input based on a global terrain dataset with 10 min resolution (maximum elevation in northeast Oman was estimated to be 1400 m). Result from RUN10-I experiment is not shown in Figure 7 because of its delayed initialization after significant amounts of rainfall werereceived over the Arabian Sea.
Visual inspection of simulated rainfall in the two experiments shows good performance of the model in reproducing the spatial and temporal distribution of the observed rainfall given in Figure 4. Most of the rainfall over the Arabian Sea was concentrated to the west of the cyclone track with an accumulated depth of about 870 mm. The observed rainfall distribution showed the same distribution patterns with a total rainfall depth in excess of 600 mm (shown in Figure 4). After the landfall in northeast Oman, the rainfall distribution pattern takes a band shape extending from the northwest to southeast of the cyclone track. Over Omani heights, RUN10-C produced relatively higher rainfall depths compared to RUN10-TER. The maximum accumulated rainfall depth from RUN10-C was 600 mm while the maximum rainfall depth from RUN10-TER was 520 mm. Figure 8 shows time series of hourly rainfall (observed and simulated) at the location of the two rainfall gauges with the highest observed record during the event (Mazara: 485 mm/48 h, JabalHilm: 488 mm/48 h). Results of RUN10-C and RUN10-I were very close to each other indicating negligible effect of simulation initialization time on simulated rainfall. RUN10-TER simulated lower rainfall intensity compared to other experiments. Despite of the relatively lower rainfall intensities simulated with RUN10-TER, all experiments kept the same rainfall trend with same temporal distribution of rainfall peaks at the two sites. All experiments underestimated the accumulated rainfall depth over the 48 h from 00 UTC on 3 June to 00 UTC on 5 June in 2010 at the two rainfall gauges. Table 2 shows the accumulated (observed andsimulated) rainfall depths at Mazara and JabalHilm rainfall gaugeswith the percentage error in the accumulated rainfall depth. As indicated from the negative sign (–) of the error, all experiments underestimated theobserved rainfall with RUN10-C and RUN10-I showed better performancein reproducing the rainfall compared with RUN10-TER that resulted in the largest error.
Figure 9 shows the 96 h total accumulated rainfall depth from 00 UTC on 3 June to 00 UTC on 7 June in 2010 along with trajectories of simulated cyclones for the 3.3 km horizontal resolution experiments (RUN3.3-C, RUN3.3-I, RUN3.3-TER) with model terrain elevation. RUN3.3-C and RUN3.3-I overestimated the rainfall over the mountainous area in north-east Oman. The maximum accumulated rainfall depth was 1320 mm, 1300 mm in RUN3.3-C and RUN3.3-I, respectively. Meanwhile, ma-
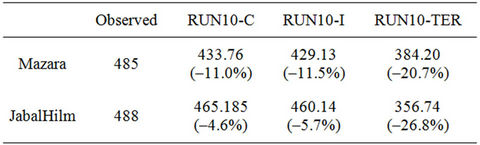
Table 2. Accumulated 48 h rainfall depth (observed and simulated) from 0000 3 June to 0000 UTC 5 June in 2010 at Mazara and JabalHilm rainfall gauges, the figures in parentheses are the percentage error compared to the observed value.
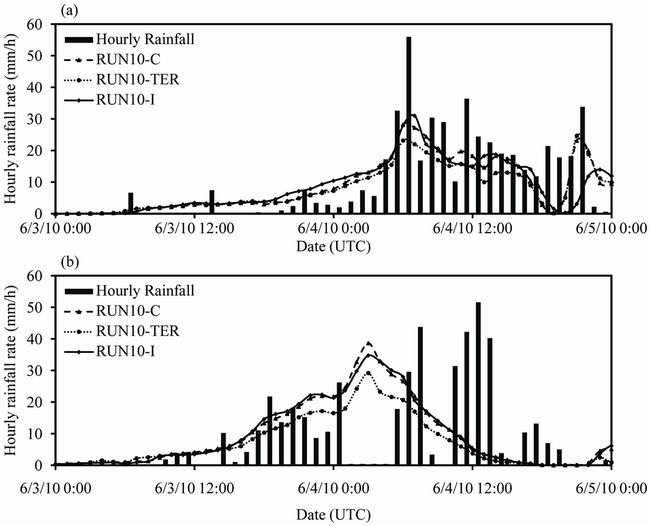
Figure 8. Time series of observed and simulated hourly rainfall from 0000 3 June to 0000 UTC 5 June in 2010 at (a) Mazara rainfall gauge and (b) JabalHilm rainfall gauge.
ximum rainfall depth simulated in RUN3.3-TER, that uses rough terrain resolution, was found to be 600 mm. Recalling that maximum rainfall observed at rain gauges in northeast Oman was 485 mm (Mazara) and 488 mm (JabalHilm), refer to Figure 3, we find that RUN3.3-TER reproduce reasonable results compared to the other experiments. The observed rainfall distribution by TRMM in Figure 4 shows a total rainfall amount that best matches with RUN3.3-TER (Figure 9(c)). Rainfall observations (Figures 3 and 4) indicate two rainfall maxima of about 500 mm to the west of the cyclone track over Oman. This trend accurately reproduced by RUN3.3-TER, but RUN3.3C and RUN3.3-I shows a third maxima to the southwest of Muscat that was not observed. All of the three experiments produced a rainfall band, of same size and intensity, extending from south of Muscat into a northeast direction, following the cyclone track in the gulf of Oman.
4.3. Effects of Terrain Elevation
Earlier discussion showed the negligible effect of the initialization time on cyclone track, intensity and rainfall simulation; however, it showed the significant effect of the horizontal grid resolution and the terrain height of the model in simulating the cyclone’s rainfall. This section is devoted to deeper investigation of the effect of cloudresolving scale simulation on the simulation of heavy rainfall in northeast Oman in terms of horizontal resolution and terrain elevation of the model. Rainfall simulated from RUN3.3-C is investigated and compared with simulated rainfall from RUN10-C to study the effect of the model grid resolution. It was also compared with rainfall simulated from RUN3.3-TER to study the effect of theterrain height. The average terrain height for the area of northeast Oman is 262.3m in RUN10-C, 270.1 m in RUN3.3-C and 261.2 in RUN3.3-TER. The maximum height in the area is found to be 1723.2 m in RUN10-C, 2498.2 m in RUN3.3-C and 1657.4 in RUN3.3-TER. The maximal terrain elevation in northeast Oman derived from a 30 s digital elevation model (GEBCO_08 dataset) is 2901m. Even though the model terrain elevation is lower than those estimated from GEBCO_08, the maximum model terrain elevation in northeast Oman in RUN3.3-C increases by 775 m (44.9%) as the model horizontal grid resolution goes form 10 km to 3.3 km.
Figure 10 shows the total accumulated rainfall during the simulation period and the wind vectors at 00 UTC on 4 June for RUN3.3-C, RUN3.3-TER, and RUN10-C. The maximum rainfall simulated in RUN3.3-C is substantially higher compared with the rainfall simulated from RUN3.3-TER and RUN10-C. A maximum value of 1320.9 mm is computed in RUN3.3-C and a maximum value of 518.2 mm and 577.7 mm are simulated in RUN3.3-TER and RUN10-C, respectively. Recalling that maximum observed accumulated rainfall depth at ground gauges is 488 mm; this proves that rainfall simulated from RUN3.3-C is obviously overestimating the cyclone rainfall over northeast Oman. The rainfall produced from RUN10-C and RUN3.3-C is relatively similar despite of
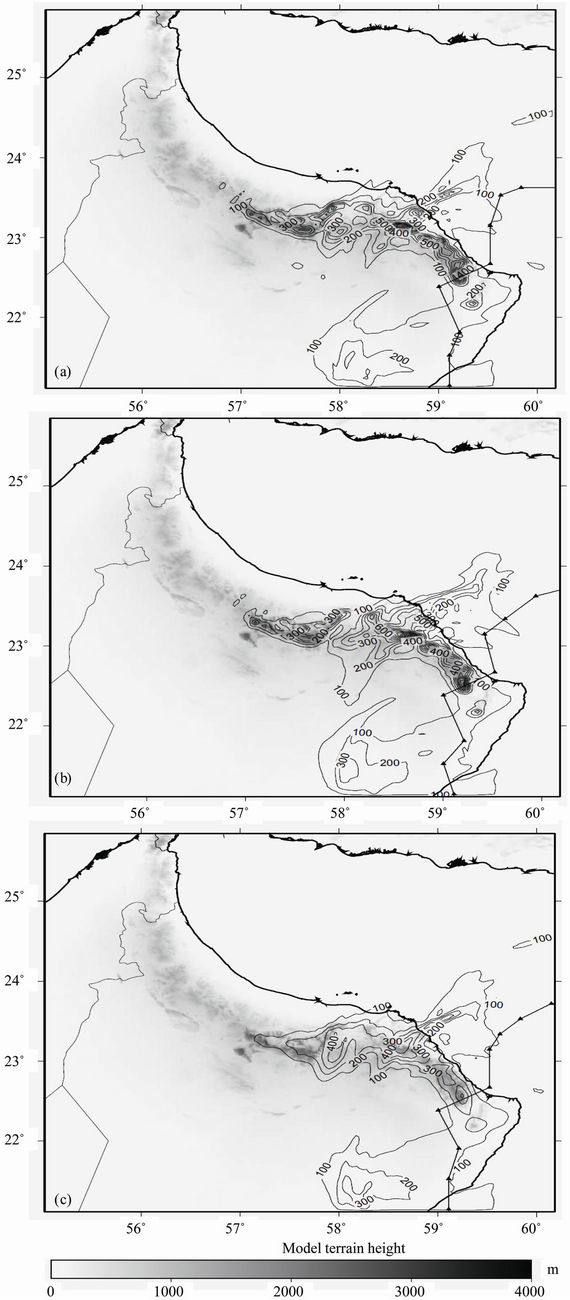
Figure 9. Accumulated total rainfall (mm, contours lines each 100) from 0000 3 June to 0000 UTC 7 June in 2010 and trajectory of the simulated cyclone for (a) RUN3.3-C; (b) RUN3.3-I; (c) RUN3.3-TER with model terrain elevation (m, shaded).
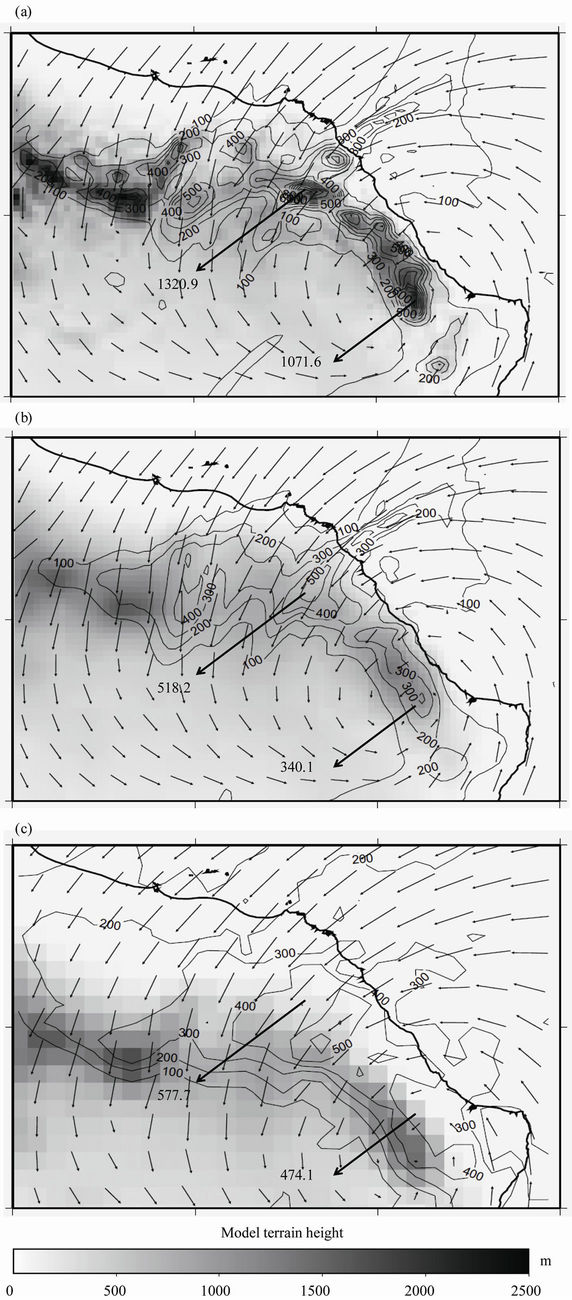
Figure 10. Accumulated total rainfall (mm, contours lines each 100) from 0000 3 June to 0000 UTC 7 June in 2010 and surface wind vectors at 0000 4 June for (a) RUN3.3-C; (b) RUN3.3-TER; (c) RUN10-C with model terrain elevation (m, shaded).
the fact of different employed physics. The cloud subgrid resolvable rainfall in RUN3.3-TER is close to the cumulus physics scheme rainfall in RUN10-C. The wind vectors given in Figure 10 do not indicate significant variation in the horizontal wind circulation pattern over the area due to variation in terrain elevation or model grid resolution. Such significant variations in simulated rainfall between the different experiments are result of terrain elevation effects.
Figure 11 shows time series of hourly rainfall, horizontal surface wind components, vertical wind speed component at the model first vertical layer, from 00 UTC on 3 June to 00 UTC on 6 June in 2010, at the model grid point that received the maximum accumulated rainfall,
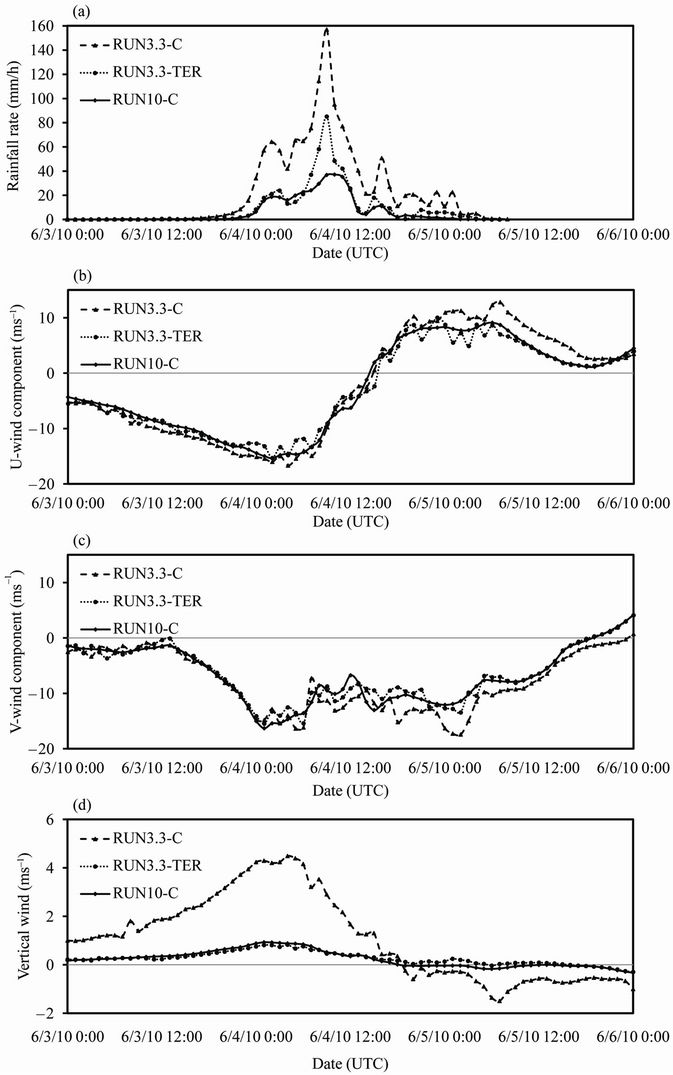
Figure 11. Time series at the grid point received maximum accumulated rainfall depth for (a) hourly rainfall intensity; (b) east-west surface wind component; (c) north-south horizontal wind component and (d) vertical wind speed. Data based on RUN3.3-C, RUN3.3-TER, and RUN10-C.
from RUN10-C, Run3.3-C, and RUN 3.3-TER. The horizontal wind speed component shows no difference among the three experiments (Figure 11(b)), whereas RUN3.3-C shows significant higher vertical wind speed compared to those simulated by RUN10-C and RUN3.3-TER. This shows that the main factor causing higher rainfall rates in RUN3.3-C is the enhanced vertical wind speed due to the higher terrain employed.
Figure 12 shows time series of vertically integratedhydrometeors at the model grid point with maximum accumulated rainfall depth from 00 UTCon 3 June to 00 UTC on 6 June in 2010 for RUN3.3-C and RUN3.3-TER. These values are calculated by superposition of the corresponding values in all vertical layers of the model. Figure 12 shows that the heavy rainfall in RUIN3.3C is caused mainly by the enhanced rainwater in the lower layers of the atmosphere. Cloud water and graupel showa relative increase in RUN3.3-C comparedto RUN3.3-TER. The ice content in the top layers of the model does not show any effect due to changes in model terrain height.
5. Conclusions
In the last three years, the Arabian Sea has witnessed the two strongest tropical cyclones ever recorded in this basin (Cyclone Gonu in 2007 and cyclone Phet in 2010).
Both cyclones resulted in heavy rainfall over northeast mountainous area of Oman triggering massive flash floods associated with losses in lives and infrastructure.
This paper focused on the atmospheric simulation of the circulation characteristics and heavy rainfall associated with cyclone Phet. The Advanced Weather Research WRF was used to set the numerical experiments for the cyclone using triple one-way nested domains of 30, 10, and 3.3 km grid size in the horizontal with 32 verticallayers in the vertical. The main objective of the study was to investigate the predictability of the heavy rainfall caused by TC Phet, which produced record-breaking rainfall of 488 mm in northeast Oman with a peak rainfall rate of 56 mm/h. Using WRF, we conducted eight numerical experiments with different horizontal model grid resolution, different model initialization time, and different model terrain resolution. The experiments were designed to investigate the effect of the initialization timing and high-resolution topography on the simulated cyclone rainfall and intensity over the Arabian Sea in addition to the rainfall simulation in northeast Oman.
All experiments resulted in analogous cyclone track and intensity (minimum sea level pressure and maximum wind speed) that well conform to the observations. Landfall time and location in northeast Oman was adequately reproduced by the experiments enabling better simulation and interpretation of rainfall results over Oman. The results of track and intensity indicated the negligible effect of the model initialization time and model terrain height on reproducing such fields. This is reasonable since tropical cyclone track and intensity is mainly driven by the sea surface temperature that fuels the cyclone with moisture and heat.
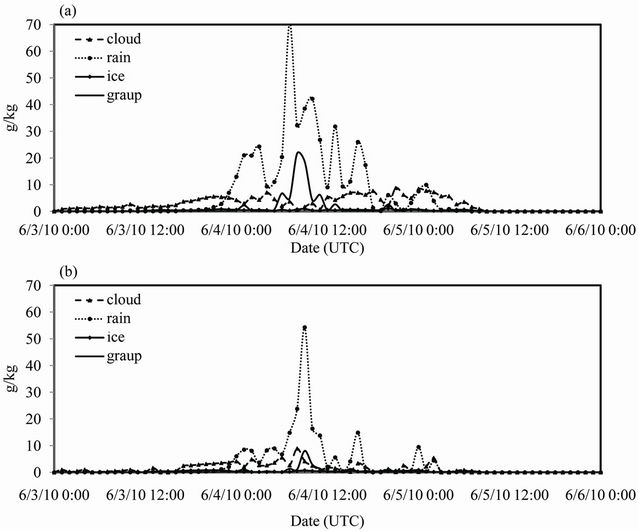
Figure 12. Time series of vertically integrated hydrometeors at the model grid point with maximum accumulated rainfall depth from 0000 3 June to 0000 UTC 6 June in 2010 for (a) RUN3.3-C and (b) RUN3.3-TER.
In contract to the simulated cyclone track and intensity, rainfall results over land showed high sensitivity to model terrain resolution. The heavy rainfall over northeast Oman was a combination of the cyclone circulation effect and the orographic lifting in the mountains. The northeasterly cyclone moist-warm wind was lifted in the Omani mountains releasing its potential energy and enhancing further thermal convection. Numerical experiments with different terrain resolution showed large variation in the simulated rainfall over northeast Oman. Rainfall simulation results proved an essential role of the mountains in northeast Oman in enhancing thermal convection and lifting mechanism for the warm moist wind of the cyclone. The maximum rainfall observed at ground rain gauges was 488 mm, in RUN3.3-C, with the highest terrain resolution; the maximum accumulated rainfall was 1320 mm, which is 2.7 times the observed maximum rainfall. Numerical experiment with smoother terrain elevation resulted in analogues rainfall maximum of 577.7 mm and 518.2 mm from RUN10-C and RUN3.3-TER, respectively. We should mention that there is uncertainty in the observed values due to the fact of being in an arid region with dry periods that extend for years at some stations, in addition data acquisition methods and quality control is unknown at these stations.
This study showed that the orographic effect played a substantial role in increasing the total rainfall in the cloud resolving scale rainfall simulation, as seen in the comparison between RUN3.3-C and RUN3.3-TER. The increased precipitation in RUN3.3-C is due to the increase in the rainwater and cloud water and graupel of the explicit moisture scheme. Future study will be conducted to investigate the sensitivity of model physics schemes in reproducing accurate simulation of heavy rainfall associated with tropical cyclones landfall in the mountainous area of northeast Oman. This kind of studies will be useful in establishing of forecasting and early warning system against heavy rainfall and flash flooding in Oman.
6. Acknowledgements
This work was performed while the first author held a visiting associate-professorship at Hiroshima University provided by the Global Leaders Environment Program (GEL). The rainfall observation dataset of Northern Oman during the cyclone were provided by dar al-handasah (Shair and Partners), a leading multi-disciplinary consultant firm in the Middle East. The satellite images of the cyclone movement were extracted from the database of the India Meteorological Department.
REFERENCES
- A. Henderson-Sellers, H. Zhang, G. Berz, K. Emanuel, W. Gray, et al., “Tropical Cyclones and Global Climate Change, a Post-IPCC Assessment,” Bulletin of the American Meteorological Society, Vol. 79, No. 1, 1998, pp. 19-38. doi:10.1175/1520-0477(1998)079<0019:TCAGCC>2.0.CO;2
- A. T. Evan and S. J. Camargo, “A Climatology of Arabian Sea Cyclonic Storms,” Journal of Climate, Vol. 24, No. 1, 2011, pp. 140-158. doi:10.1175/2010JCLI3611.1
- S. Pattanayakand and U. C. Mohanty, “A Comparative Study on Performance of MM5 and WRF Models in Simulation of Tropical Cyclones over Indian Seas,” CURRENT SCIENCE, Vol. 95, No. 7, 2008, pp. 923-936.
- D. Knight and R. E. Davis, “Climatology of Tropical Cyclone Rainfall in the Southeastern United States,” Physical Geography, Vol. 28, No. 2, 2007, pp. 126-147. doi:10.2747/0272-3646.28.2.126
- M. Deshpande, S. Pattnaik and P. S. Salvekar, “Impact of Physical Parameterization Schemes on Numerical Simulation of Super Cyclone Gonu,” Natural Hazards, Vol. 55, No. 2, 2010, pp. 211-231. doi:10.1007/s11069-010-9521-x
- J. Yu and Y. Wang, “Response of Tropical Cyclone Potential Intensity over the North Indian Ocean to Global Warming,” Geophysical Research Letters, Vol. 36, No. L03709, 2009, p. 5. doi:10.1029/2008GL036742
- E. B. Rodgers, R. F. Adler and H. F. Pierce, “Contribution of Tropical Cyclones to the North Atlantic Climatological Rainfall as Observed from Satellites,” Journal of Applied Meteorology, Vol. 40, No. 11, 2001, pp. 1785-1800. doi:10.1175/1520-0450(2001)040<1785:COTCTT>2.0.CO;2
- J. B. Elsner, J. P. Kossin and T. H. Jagger, “The Increasing Intensity of the Strongest Tropical Cyclones,” Nature, Vol. 455, No. 7209, 2008, pp. 92-95. doi:10.1038/nature07234.
- W. C. Skamarock, J. B. Klemp, J. Dudhia, D. O. Gill, D. M. Barker, et al., “A Description of the Advanced Research WRF Version 3, NCAR Technical Note,” National Center for Atmospheric Research, Boulder, 2008.
- V. B. Rao, C. C. Ferreira, S. H. Franchito and S. S. V. S. Ramakrishna, “In a Changing Climate Weakening Tropical Easterly Jet Induces More Violent Tropical Storms over the North Indian Ocean,” Geophysical Research Letters, Vol. 35, No. L15710, 2008, p. 4. doi:10.1029/2008GL034729
- G. Grell, J. Dudhia and D. Stauffer, “A Description of the Fifth Generation Penn State/NCAR Mesoscale Model (MM- 5),” NCAR Library, Boulder, 1996, p. 117.
- S. R. Rao, K. M. Krishna and O. S. R. U. Bhanu Kumar, “Study of tropical cyclone Fanoos using MM5 model—A Case Study,” Natural Hazards and Earth System Sciences, Vol. 9, No. 1, 2009, pp. 43-51.
- J. S. Kain, “The Kain—Fritsch Convective Parameterization: An Update,” Journal of Applied Meteorology, Vol. 43, No. 1, 2004, pp. 107-181. doi:10.1175/1520-0450(2004)043<0170:TKCPAU>2.0.CO;2
- A. K. Betts and M. J. Miller, “The Betts-Miller Scheme,” In: K. A. Emanuel and D. J. Raymond, Eds., Representation of Cumulus Convection in Numerical Models, American Meteorological Society, Boston, 1993, p. 246.
- G. A. Grell, “Prognostic Evaluation of Assumptions Used by Cumulus Parameterizations,” Monthly Weather Review, Vol. 121, No. 3, 1993, pp. 764-787. doi:10.1175/1520-0493(1993)121<0764:PEOAUB>2.0.CO;2
- D. K. Lee and S. J. Choi, “Observation and Numerical Prediction of Torrential Rainfall over Korea Caused by Typhoon Rusa (2002),” Journal of Geophysical Research, Vol. 115, No. D12105, 2010, p. 20. doi:10.1029/2009JD012581
- M. Haggag and T. Yamashita, “Environmental Simulator Application to the Analysis of the Tropical Cyclone Gonu in 2007,”Journal of International Development and Cooperation, Vol. 15, No. 1-2, 2009, pp. 47-63.
- M. Haggag, T. Yamashita, K. O. Kim and H. S. Lee, “Ocean-Atmosphere Coupled Simulation of Storm Surge and High Waves Caused by Cyclone Nargis in 2008,” Asian and Pacific Coasts, Vol. 1, No. 1, 2009, pp. 208-215.
- IMD, “India Meteorology Department Report on Cyclonic Disturbances over North Indian Ocean during 2010, RSMC-Tropical Cyclones,” IMD, New Delhi, 2011, pp. 61-75.
- NASA, “Hurricane Season 2010, Tropical Storm Phet (Northern Indian Ocean),” 2011. http://www.nasa.gov/mission_pages/hurricanes/archives/2010/h2010_phet.html
- R. A. Anthes, “Tropical Cyclones: Their Evolution, Structure and Effects,” American Meteorological Society, Boston, 1982.
- S. Y. Hong, J. Dudhia and S. H. Chen, “A Revised Approach to Ice Microphysical Processer for the Bulk Parameterization of Clouds and Precipitation,” Monthly Weather Review, Vol. 132, No. 1, 2004, pp. 103-120.
- S. Y. Hong and J. O. Lim, “The WRF Single-Moment 6-Class Microphysics Scheme (WSM6),” Journal of the Korean Meteorological Society, Vol. 42, No. 2, 2006, pp. 129-151.
- S. Y. Hong, Y. Noh and J. Dudhia, “A New Vertical Diffusion Package with an Explicit Treatment of Entrainment Processes,” Monthly Weather Review, Vol. 134, No. 9, 2006, pp. 2318-2341. doi:10.1175/MWR3199.1
- F. Chen and J. Dudhia, “Coupling of an Advanced Land Surface Hydrology with the Penn State-NCAR MM5 Modeling System. Part I: Model Implementation and Sensitivity,” Monthly Weather Review, Vol. 129, No. 4, 2001, pp. 569-585. doi:10.1175/1520-0493129
- E. J. Mlawer, S. J. Taubman, P. D. Brown, M. J. Lacono and S. A. Clough, “Radiative Transfer for Inhomogeneous Atmospheres: Rrtm, a Validated Correlated-K Model for Thelongwave,” Journal of Geophysical Research, Vol. 102, No. 16, 1997, pp. 663-682. doi:10.1029/97JD00237
- J. Dudhia, “Numerical Study of Convection Observed During the Winter Monsoon Experiment Using a Mesoscale Two-Dimensional Model,” Journal of the Atmospheric Sciences, Vol. 46, No. 20, 1989, pp. 3077-3107. doi:10.1175/1520-0469
- J. Done, C. Davis and M. Weisman, “The Next Generation of NWP: Explicit Forecasts of Convection Using the Weather Research and Forecasting (WRF) Model,” Atmospheric Science Letters, Vol. 5, No. 6, 2004, pp. 110-117. doi:10.1002/asl.72
- J. S. Kain, S. J. Weiss, D. R. Bright, et al., “Some Practical Considerations Regarding Horizontal Resolution in the First Generation of Operational Convection-Allowing NWP,” Weather and Forecasting, Vol. 23, No. 5, 2008, pp. 931-952. doi:10.1175/WAF2007106.1
- M. L. Weisman, C. Davis, W. Wang, K. W. Manning and J. B. Klemp, “Experiences with 0-36-h Explicit Convective Forecasts with the WRF-ARW Model.” Weather and Forecasting, Vol. 23, No. 3, 2008, pp. 407-437. doi:10.1175/2007WAF2007005.1
- J. Thiébaux, E. Rogers, W. Wang and B. Katz, “A New High-Resolution Blended Real-Time Global Sea Surface Temperature Analysis,” Bulletin of the American Meteorological Society, Vol. 84, No. 5, 2003, pp. 645-656. doi:10.1175/BAMS-84-5-645
NOTES
*Corresponding author.