Journal of Behavioral and Brain Science
Vol.3 No.7(2013), Article ID:39338,22 pages DOI:10.4236/jbbs.2013.37056
Lack of Rbl1/p107 Effects on Cell Proliferation and Maturation in the Inner Ear
1Department of Oral Biology, Creighton University School of Dentistry, Omaha, USA
2College of Public Health, University of Nebraska Medical Center, Omaha, USA
3College of Information Science and Technology, University of Nebraska at Omaha, Omaha, USA
4Developmental Auditory Physiology Laboratory, Boys Town National Research Hospital, Omaha, USA
Email: ssanchez@creighton.edu
Copyright © 2013 Sonia M. Rocha-Sanchez et al. This is an open access article distributed under the Creative Commons Attribution License, which permits unrestricted use, distribution, and reproduction in any medium, provided the original work is properly cited.
Received August 30, 2013; revised September 29, 2013; accepted October 15, 2013
Keywords: Rbl1/p107; Inner Ear; Proliferation; Differentiation; Hair Cells; Supporting Cells
ABSTRACT
Loss of postnatal mammalian auditory hair cells (HCs) is irreversible. Earlier studies have highlighted the importance of the Retinoblastoma family of proteins (pRBs) (i.e., Rb1, Rbl1/p107, and Rbl2/p130) in the auditory cells’ proliferation and emphasized our lack of information on their specific roles in the auditory system. We have previously demonstrated that lack of Rbl2/p130 moderately affects HCs’ and supporting cells’ (SCs) proliferation. Here, we present evidence supporting multiple roles for Rbl1/p107 in the developing and mature mouse organ of Corti (OC). Like other pRBs, Rbl1/p107 is expressed in the OC, particularly in the Hensen’s and Deiters’ cells. Moreover, Rbl1/p107 impacts maturation and postmitotic quiescence of HCs and SCs, as evidenced by enhanced numbers of these cells and the presence of dividing cells in the postnatal Rbl1/p107−/− OC. These findings were further supported by microarray and bioinformatics analyses, suggesting downregulation of several bHLH molecules, as well as activation of the Notch/Hes/Hey signaling pathway in homozygous Rbl1/p107 mutant mice. Physiological assessments and detection of ectopic HC marker expression in postnatal spiral ganglion neurons (SGNs) provided evidence for incomplete cell maturation and differentiation in Rbl1/p107−/− OC. Collectively, the present study highlights an important role for Rbl1/p107 in OC cell differentiation and maturation, which is distinct from other pRBs.
1. Introduction
Differentiation of inner ear sensory hair cells (HCs) and their associated non-sensory supporting cells (SCs) follows a unidirectional path. Early in development, organ of Corti (OC) prosensory cells undergoes proliferation, withdraw from the cell cycle, and commits to their specific differentiation program [1]. In mammalian vertebrates, differentiated HCs and SCs are unable to proliferate [1]. Many genes regulating cell proliferation, differentiation, and maturation elsewhere in the body are thought to function similarly in the auditory system. Nevertheless, the identification of specific genes participating in those processes is incomplete. There has been growing interest in determining the role of the retinoblastoma (pRB) family, a.k.a. pocket proteins (Rb1, Rbl1/p107, Rbl2/p130), in the inner ear [2-8]. The pRBs are components of a pathway that mediates a variety of cellular responses by controlling the E2F transcription factors (TF) and the expression of their targets during cell cycle progression [9]. In the mouse OC, loss of Rb1 results in massive tonotopically graded proliferation of HCs and, to some extent, SCs [2]. Rb1 deletion also triggers the death of all sensory cells in the cochlea [2,3]. Loss of Rbl2/p130 is associated with SCs and HC proliferation in limited regions of the cochlea. Moreover, Rbl2/ p130−/− mice have a near-normal auditory sensitivity, despite the presence of supernumerary cells [8]. The clear distinctions and similarities between Rb1 and Rbl2/p130 loss-of-function in the inner ear suggest both redundant and non-redundant roles of the pRB family. However, effects seen in Rb1- and Rbl2/p130-deleted OC are likely influenced by Rbl1/p107 and vice-versa. All three pRBs are expressed at relatively low levels in the primordial OC. In the postmitotic OC, the expression of Rb1 and Rbl2/p130 is increasingly upregulated, while Rbl1/p107 transcript levels become undetectable [8]. Whether low Rbl1/p107 expression reflects its reduced importance in OC cell proliferation and postmitotic quiescence, or implies a basal function not subject to differential regulation, remains to be addressed. To further address this question and any potential relevance in HC regeneration, we characterized the OC of Rbl1/p107−/− mice, examined the expression profile of Rbl1/p107−/− OC by microarray, and used bioinformatics tools to analyze the biological relevance of Rbl1/p107 during OC development and maturation. Additionally, we assessed the physiological phenotype of the auditory periphery of Rbl1/p107−/− mice. Consistent with Rbl1/p107 playing a crucial role beyond OC precursor cell cycle regulation, Rbl1/p107−/− mice have supernumerary HCs and SCs. Moreover, Rbl1/ p107−/− mice show distinctive features of peripheral auditory immaturity, confirmed by both cytological and functional analyses. Further corroborating these observations, more than 1000 genes changed their level of expression in the mature Rbl1/p107−/− OC, supporting a role for Rbl1/p107 in OC precursor cell differentiation and functional maturation.
2. Material and Methods
2.1. Animals
Rbl1/p107−/− mice were obtained from Dr. Tyler Jacks (MIT) and crossed to C57BL/6 mice purchased from Charles River Laboratories (Wilmington, MA). Experimental animals were genotyped by PCR following procedures described elsewhere [10]. All tissues were harvested from animals in accordance with the Creighton University Institutional Animal Care and Use Committee (IACUC)-approved protocol number 0853.
2.2. In Vivo Functional Assessment
Auditory evoked brainstem responses (ABRs) and distortion product otoacoustic emissions (DPOAEs) were recorded in postnatal (P) days 16 and P30 WT and Rbl1/ p107−/− animals, as previously described [8]. This study was approved by the Boys Town National Research Hospital (BTNRH) Institutional Animal Care and Use Committee.
2.3. Semithin Sections
Inner ear tissues of P0, P16, and P35 WT and Rbl1/ p107−/− animals were prepared as previously described [8].
2.4. Immunohistochemistry
Immunolocalization of Myosin VIIa (Proteus Biosciences), acetylated α-tubulin (Zymed), SOX2, PROX1, and Ki-67 (Millipore) proteins was performed on formalin-fixed whole-mount preparations or paraffin-embedded 4 μm thick cross sections of dissected OC of P0, P16, and P35 WT and Rbl1/p107−/− animals, as described elsewhere [8]. All samples were processed for antigen retrieval before the standard immunohistochemistry procedures. Microscopy and images were analyzed using a Zeiss LMS 510 confocal microscope.
2.5. Proliferation Assay
Detection of the thymidine analog 5-ethynyl-2’-deoxyuridine (EdU) incorporation (Invitrogen/Molecular Probes) was performed following the manufacturer’s instruction and experimental procedures described elsewhere [8].
2.6. Apoptosis Assay
The TUNEL assay was performed as described elsewhere [11]. Apoptotic nuclei in the serial sections were counted at 20 μm intervals to prevent double counting of the same cell. A total of four cross sections were analyzed per genotype. Four different areas within each cross-section were selected. All nuclei within the selected areas were counted and the ratio of TUNEL-positive nuclei to the total nuclei was calculated per section. Student’s t-test was performed to assess statistical significance. A p-value equal to or smaller than 0.01 was considered significant.
2.7. Western Blot
Whole otocyst/early-stage cochleae of WT and Rbl1/ p107−/− male and female mice between embryonic day 12.5 (E12.5) to E14.5 and cochleae of P0, P16, and P35 were dissected away from their attached vestibular regions and processed for Western blot analyses using primary monoclonal or polyclonal antibodies against β- ACTIN, Rbl1/p107, RB1 (Sigma), PROX1, SOX2, PCNA, ID1, HES1, HES5, RBL2/p130, NOTCH1, NOTCH1 CD (Millipore), Delta-like1 (DLL1), ID2, and ID3 (Abcam) as previously described [8].
2.8. In Situ Hybridization (ISH)
Whole-mount ISH was performed in E12.5 whole otocyst, E18.5, and P14 cochleae as previously described [8]. Digoxigenin-labeled (DIG RNA Labeling Kit; Roche, Indianapolis, IN) riboprobe antisense to Rbl1/p107 mRNA (478 nt) was transcribed and purified by denaturing polyacrylamide gel electrophoresis from template DNA generated by PCR amplification of a sequenceverified clonal isolate of Rbl1/p107 derived from mouse genomic DNA using primers (5’-CAGTTGGACATGCCTATAATTCC and 5’-TAATACGACTCACTATAGGGAGGAGCTAGACTGCCAAGCCAATAC). A minimum of three samples were prepared for each time point.
2.9. Real-Time Quantitative PCR (RT-QPCR)
Total RNA isolation from whole otocyst/early stage cochleae of WT and Rbl1/p107−/− mice between E12.5 to E14.5 and from dissected OC of P0, P14, and P35 mice. RT-QPCR procedures using TaqMan PCR assays (Applied Biosystems; StepOne plus system) for Rb1, Rbl2/ p130, Pcna, Caspase 3, p21Cip1, p53, Atoh1, Dll1, Jag2, Notch1, Hes1, Hes5, and Id1-3 were performed as previously described [8]. T tests were performed on the normalized gene expression values to determine whether differences were statistically significant. A value of p ≤ 0.01 was considered significant.
2.10. Microarray Study
The Mouse Gene 1.0 ST array (Affymetrix, Inc.) was used to look for differential expression between Rbl1/ p107−/− and WT littermates at three different time points (E12.5, P0, and P35) in triplicate. A total of 18 arrays were included in the analyses and 35,556 probe sets were included on array. The experiment was designed to be in compliance with Minimum Information about a Microarray Experiment (MIAME) standards. Each RNA sample was processed and hybridized to individual slides. Target preparation, including verification of RNA quality, was assessed using a Bioanalyzer 2100 (Agilent Technologies, Santa Clara, USA). Low-level analysis, which converts probe-level data to gene-level expression data, was done using RMA. RMA was implemented using the rma function of the affy package of the Bioconductor project in the R programming language [12]. The background correction method corrected the perfect match (PM) probe intensities using a model based on the assumption that the observed intensities are the sum of signal and noise. Quantile normalization was used and the calculation of summary expression measures was done using the median polish method, which fits a multichip linear model to the data and gives the expression on the log2 scale [12].
2.11. Statistical Analyses of Microarray Data
Analysis of microarray data was done using BRB ArrayTools version 4.3.0 beta_3 release, developed by Dr. Richard Simon and Amy Peng Lam (Biometrics Research Branch, National Cancer Institute: http://linus.nci.nih.gov/ArrayTools/v4_3_0_Beta_1/Manual.pdf). Gene filtering was done prior to analysis, with a gene being excluded if less than 20% of expression data values were greater than 1.5-fold changed in either direction from the median value. Random-variance t-tests and F-tests were used to determine which genes are differentially expressed between Rbl1/p107−/− and WT samples [13]. A significance level of 0.01 was selected. Once a p value was assigned for each gene, the pool of differentiated genes was sorted to include only those genes with expression greater than 2-fold and smaller than 0.5. The false discovery rate was also estimated [14]. Unsupervised hierarchical clustering of the arrays was done as well, using both the full set and the filtered subset. PRomoter Integration in Microarray Analysis (PRIMA) [15] was used to search for E2f1-5 consensus-binding sequences within the transcriptional start site of a number of differentially regulated genes. The PRIMA analysis used a probability weight matrix made from 1046 transcription factor binding sites (TFBS), which is the ratio of vertebrate TFBS/mammalian TFBS × 21,973 annotated mouse genes (affy 430-2 chip).
2.12. Network Analyses
The known protein-protein interaction network (PPIN) for Mus musculus was downloaded from the Pathway Commons on 03/30/2012. This network contains 3143 nodes and 345,073 edges. After duplicate edges were removed, this network contained 172,536 edges. Gene Ontology enrichment for each network was performed using PANTHER’s gene list analysis system [16]. The Gene Ontology trees used were biological process, molecular function, and cellular component. Pathway biomolecule analysis and characterization was performed using the NCI Nature's Pathway Interaction Database [17]. Microarray expression data was taken for Rbl1/ p107 vs. WT at three time points (E12.5, P0, and P35), creating three datasets from which to draw. Each dataset contained differentially expressed genes, including a unique identifier, expression means, etc. Each gene also contained a gene symbol annotation if it existed or was known. Having known gene symbols, these genes were filtered from each dataset. Protein-protein interaction networks of genes listed in each dataset were created from the M. musculus PPIN, such that, if the gene/protein listed in the dataset was also present in the network, that node was kept in the network. If that gene/protein was connected to another node in the network that was also in the dataset, the edge between the two was also kept. Each dataset contained differentially expressed genes, including gene symbol annotation (if available), a unique identifier, expression means, etc. Gene Symbols were filtered from each dataset. This pre-processing step produced a set of 22 (E12.5), 148 (P0), and 680 (P35) genes.
3. Results
3.1. Rbl1/p107 Expression in the Inner Ear
Earlier assessment of pocket proteins expression in the developing and postnatal OC revealed that, in comparson to the remaining pRBs, Rbl1/p107 transcript levels are kept at consistently low levels in the auditory sensory epithelia [8]. To detect Rbl1/p107 expression at a cellular level, we performed whole-mount ISH in postnatal WT mouse OC. Starting at P0, when OC cells are postmitotic, Rbl1/p107 expression was observed in both inner hair cell (IHC)- and outer hair cell (OHC)-associated SCs, as well as in a subset of cells in the spiral limbus (Figures 1(A) and (B)). Although no expression was detected in the OHCs (Figures 1(A)-(C)), some Rbl1/p107-positive reaction was observed in the IHC nuclei, particularly in the apical region (Figure 1(A)), as well as in Hensen’s cells (HeC) and Deiters’ cells (DC) (Figures 1(A), (B) and (D)). Moreover, Rbl1/p107-positive reaction was also observed in the vestibular supporting cells (Figure 1(E)).
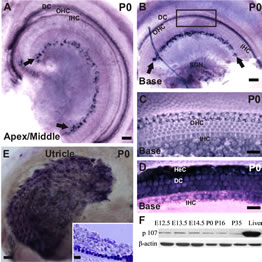
Figure 1. Spatiotemporal expression of Rbl1/p107 in the WT OC. (A), (B) In the early postmitotic OC, Rbl1/p107 transcripts were detected in the IHCs at the most apical region of the cochlea, as well as in a subset of cells in the spiral limbus (black arrows) and OHCs’ supporting cells throughout the length of the cochlea. Some positive reaction was also observed in the basal region SGNs (B). (C), (D) Higher power view of the squared region displayed in B, shown at two different focal plans, revealed lack of positive Rbl1/p107 mRNA detection in the OHCs and IHCs (C), but not HeC and DC (D). (E) Rbl1/p107 transcripts were also detected in the vestibular sensory epithelia. 10 μm thick, cross sections through the utricular epithelium revealed a subset of positive cells at the SCs’ area (inset); (F) Temporal immunoblot analyses of Rbl1/p107 levels in cochleae of WT animals throughout OC development and maturation. P35 WT liver lysate was used as positive control. β-actin was used as loading control. OHC, outer hair cells; IHC, inner hair cells; DC, Deiters’ cells; SGN, spiral ganglion neurons; HeC, Hensen’s cells. Scale bar: 100 μm (A, B and E), 10 μm (D, E and inset in E).
Beyond P0, Rbl1/p107 expression was below in situ hybridization detection threshold (data not shown). Consistent with previous RT-QPCR temporal analyses of Rbl1/p107 expression in the OC [8], Rbl1/p107 protein was kept at relatively low levels throughout embryonic and early postnatal development, becoming notably downregulated past P0 (Figure 1(F)). Liver biopsies, where Rbl1/p107 is known to be expressed, were collected and used as positive control tissue (Figure 1(F)).
3.2. Microarray Analyses in Rbl1/p107−/− Mice at Different Stages of OC Development
Consistent with lack of the Rbl1/p107 gene in the Rbl1/ p107−/− OC, Rbl1/p107 mRNA expression levels in the mutant OC exhibited a 0.00168-, 0.00171-, and 0.00164- fold change at E12.5, P0, and P35, respectively. With Rbl1/p107 expression in the mouse OC established, we sought to understand its role during OC development and maturation. To this end, microarray analyses were performed comparing WT and Rbl1/p107−/− dissected otocysts (E12.5) and OCs (P0 and P35). Distinct gene expression patterns at each time point were altered by Rbl1/p107 loss, supporting the importance of Rbl1/p107 at different stages of OC development. Respectively, 84, 600, and 1005 genes were differentially expressed at E12.5, P0, and P35 (i.e., expression levels were greater than 2-fold or smaller than 0.5) between Rbl1/p107−/− and WT OC at the 0.01 significance level (data not shown). To better understand the biological significance of those differentially expressed genes, we used Shortest-Path network analyses [18] to detect major targets of Rbl1/ p107 within the pool of differentially expressed genes resulting from the microarray analysis. Expression data were taken for Rbl1/p107−/− vs. WT at E12.5, P0, and P35, creating three datasets. The resulting networks showed known interactions between differentially expressed genes in the dataset, suggesting how Rbl1/p107-related networks can work together to achieve specific functions in the auditory sensory epithelia. Overall, genes differentially expressed between Rbl1/p107−/− and WT OC at E12.5 involved a number of those regulating biological processes and molecular functions, namely gene transcription and DNA binding (Table 1). Included within those genes are a few important regulators of neurogenesis, inner ear morphogenesis, and cell fate specification (Table 2). Shortest-Path network analyses provided evidence for protein complexes formed by the gene/protein interactions drawn from the microarray data at E12.5 (Figures 2(A) and (A’)). Although small in origin, the effects of Rbl1/p107 loss in the OC grew exponentially over time to affect, directly and indirectly, a number of major components of the neural patterning and development of the otic vesicle, such as Neurod1, Pax3, and Id3, as highlighted by our Shortest-Path network analyses
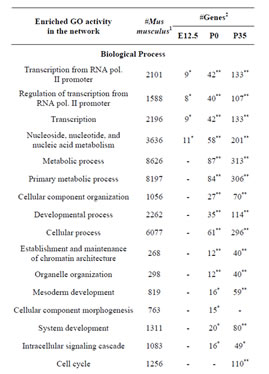
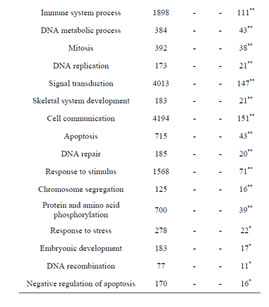
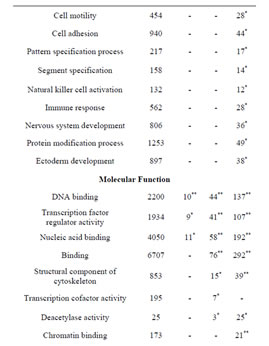
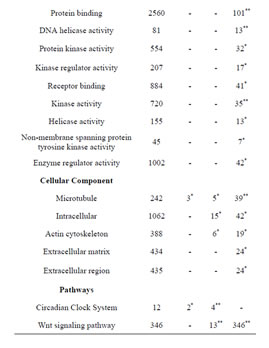
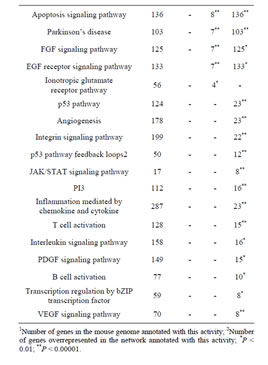
Table 1. Gene Ontology (GO) of Rbl1/p107−/− mouse otocyst and differentiated OC.
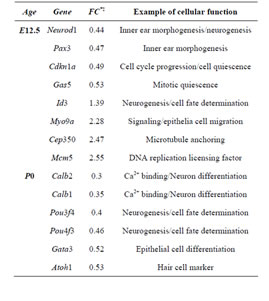
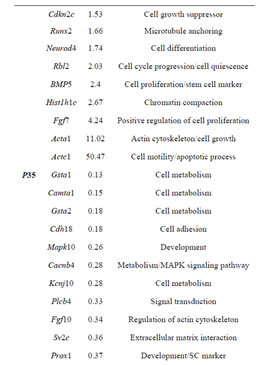
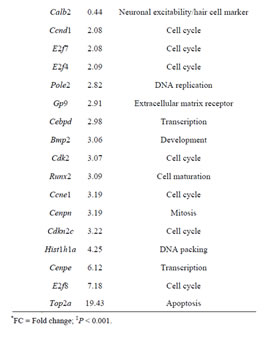
Table 2. Sample of differentially expressed genes in Rbl1/ p107−/− mouse otocyst and differentiated OC.
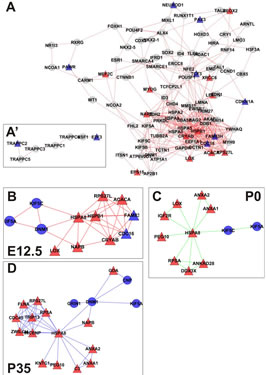
Figure 2. (A) Correlation network depicting pathways directly or indirectly affected by loss of Rbl1/p107 in the mouse sensory epithelia at E12.5. Edges represent known protein-protein interactions between nodes. Differentially expressed genes in the dataset showing connection to only one other gene in the network are shown as paired nodes on the side of the main network (A’). Of note, all affected proteins at this time point are represented on the forefront of the network. (B)-(D) A PPIN cluster of genes directly affected by the lack of Rbl1/p107 at E12.5 (B), P0 (C), and P35 (D) is shown above. Correlations in the complete networks generated for P0 and P35 (data not shown) were removed for clarity. Network structures, such as high-degree nodes (hubs), cliques, and bottlenecks were identified as having possible critical roles in the model. High-degree nodes and bottlenecks are known in PPINs to have a tendency to represent essential genes and clusters/cliques known to represent protein complexes or regulatory cohorts. Upregulated (≥2-fold) and downregulated (≤0.5-fold) genes are represented by red and blue shapes, respectively. Genes represented by gray circles were found to have fold-change values smaller than 2-fold, but greater than 0.5.
(Figure 2(A)).
Next, we mined the data set to identify PPINs where all components were differentially expressed by lack of Rbl1/p107 (Figure 2(B)). This network summarized the direct targets for Rbl1/p107 in the mouse otocyst at E12.5. More specifically, lack of Rbl1/p107 was directly associated with upregulation of genes involved in a variety of cellular processes associated with different stages of cell division (i.e., Cdc16, Acaca, Lox, Fam83h, Cryab, etc.) (p = 3.92E−05) and apoptosis inhibition (i.e., Rps27l and Hspb1) (p = 1.54E−04) (Figure 2(B)). In addition to these neurosensory-related growth factors, downregulated genes in this pathway were associated with cytoskeleton composition, organization, and intracellular vesicular trafficking (i.e., Kif5a, Kif5c, and Dnm1) (p = 2.65E− 04) (Figure 2(B)). The specific relevance of these distinct pathways to inner ear development and function, as well as additional differentially expressed pathways observed at later time points, is yet to be determined.
Gene ontology analysis revealed that, in addition to an overrepresentation of changed genes associated with gene transcription, lack of Rbl1/p107 in the OC at P0 also affected the expression of a number of genes associated with nucleic acids and cell metabolism, as well as organelle organization and intracellular signaling cascades (Table 1). While the precise pattern of expression for a number of the differentially expressed genes is still unknown, significantly changed genes included several OC cell fate determination and HC differentiation markers, such as Gata3, Atoh1, and Pou4f3, which were found to be downregulated in the absence of Rbl1/p107 (Table 2). Of note, Pou3f4, which is expressed in the spiral limbus [19], the supporting structure for the OC, was detected in our array analyses (Table 2). Such occurrence is not completely unexpected, considering the physical proximity between these two inner ear structures and the inherent difficulty to manually dissect the sensory epithelia. Nevertheless, the consistent representation of bona fide OC markers attests to the overall efficiency of our sampling method. A variety of different pathways were differentially affected by lack of Rbl1/p107, including the Wnt, Fgf, and Egf signaling pathways, strongly supporting the role of Rbl1/p107 in controlling proliferation and differentiation processes in the inner ear sensory epithelia (Tables 2 and 3). A PPIN cluster of genes directly affected by lack of Rbl1/p107 was enriched for genes associated with cell growth (i.e., Ddx3x, Ankrd28, Rpsa, Lox) (p = 4.13E−04), formation of intracellular vesicle and actin-binding proteins (Anax1 and Anax2) (p = 2.25E−05), and apoptosis inhibition (Ankrd28 and Peg10) (p = 1.48E−04) (Figure 2(C)). Similar to Rbl1/ p107−/− OC at E12.5, levels of the neuron-specific kinesins Kif5a and Kif5c were found to be significantly downregulated (p = 3.43E−04) at P0. Consistent with Rbl1/ p107 playing a key role in postmitotic OC homeostasis, genes characterizing the Rbl1/p107−/− OC at P35 included genes associated with cell cycle progression, cell proliferation, metabolism, development, and apoptosis (Table 1).
Downregulated genes at P35 included a variety of ion channels, genes involved in cell communication and spe-
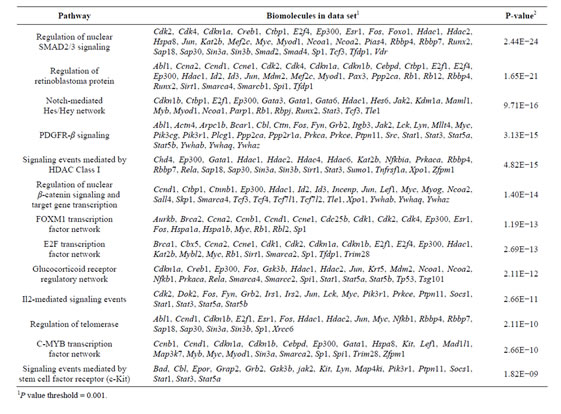
Table 3. Pathway enrichment on Rbl1/p107−/− OC over time.
cialization, and genes associated with HC and SC functional maturation (Table 2). On the other hand, upregulated genes in the Rbl1/p107−/− mouse OC at this time point consisted of a variety of genes involved in cell cycle progression, cell division, and cell death (Table 2). As expected from the complexity of genes differentially affected by Rbl1/p107 loss, a large and complex network was observed at P35 (data not shown), underscoring the variety of pathways underlying the Rbl1/p107−/− OC phenotype (Table 1). We further narrowed this network by concentrating on clusters composed of differentially expressed genes. Similar to the previous time points, only one cluster was revealed (Figure 2(D)). Genes directly downregulated in the OC of P35 mice lacking Rbl1/p107 included a group associated with microtubule formation and cytoskeleton organization (i.e., Cnp, Kif5a, Dnm1) and synaptic plasticity (i.e., Grin1) (p = 5.10E−07). Moreover, genes directly upregulated in the absence of Rbl1/p107 were particularly involved with different stages of M phase (Hspa8, Napb, Cdc45, Incenp, Kntc1, Zwilch, Trip13, Peg10, etc.) (p = 1.31E−06) and apoptosis (Anxa1 and C3) (p = 1.27E−04).
To address the general temporal effect of Rbl1/p107 loss, we combined the datasets from all three time points (data not shown) and performed a pathway enrichment analysis of the final generated network. As expected, multiple pathways were found to be overrepresented, most notably those associated with the regulation of the TGF-β pathway, Notch-Hes-mediated cell differentiation, and PDGFR-β signaling pathway, among others (Table 3).
3.3. Ectopic Cell Division and Supernumerary Cells in the OC of Rbl1/p107−/− Mouse
Given the gene expression differences pointing to Rbl1/ p107’s role in OC cell cycle control and cell differentiation, we questioned to what extent lack of Rbl1/p107 would affect the mammalian OC. To address this question, we compared semithin sections of the developing otocyst/early-stage inner ear of Rbl1/p107−/− and WT mice at E12.5, E14.5, and P0. No apparent morphological differences were observed between Rbl1/p107−/− and WT sections at either E12.5 or E14.5 (data not shown).
At P0, HCs and SCs along the length of the WT cochlear duct are all postmitotic and have acquired the cell arrangement characteristic of the adult OC, with three rows of OHCs standing on top of three rows of DCs, two rows of pillar cells (PCs) in each side of the tunnel of Corti, and a row of IHCs sitting on top of the inner phalangeal and inner border cells (Figures 3(A) and (C)). In sharp contrast to WT OC, toluidine blue-stained semithin cross sections through the apical, middle, and basal turns of the Rbl1/p107−/− OC revealed clear signs of OC immaturity, with disorganized cells, the presence of mitotic figures, and enlarged nuclei, suggestive of cells in the G2 phase of the cell cycle (Figures 3(B) and (D)). Proliferation within the postnatal OC of Rbl1/p107−/− mouse was further analyzed by EdU incorporation at P0, P16, P21, and P35. While no signs of proliferation were detected in the WT OC at any of those postnatal time points (data not shown), EdU-positive cells were detected at each of the time points analyzed (data not shown), particularly in the apex, where clusters of proliferating cells were still observed at postnatal time points (Figures 3(E) and (F)). These results were corroborated by RT-QPCR (Figure 3(G)) and Western blot (Figure 3(H)) on OC cell lysates collected at different stages of development. We specifically looked for PCNA expression, which is generally low in quiescent cells, increasing with cell proliferation [20]. At E12.5, PCNA protein and transcript levels were comparable in both Rbl1/p107−/− and WT OC. By E13.5, when the OC progenitor cells undergo their terminal mitosis, PCNA levels become elevated in Rbl1/p107−/− compared to WT mice. Starting at E14.5, when the OC epithelia cells either exit the cell cycle or have become postmitotic, PCNA levels increased significantly (p < 0.01), suggesting extension of the cell cycle beyond the normal end point. PCNA levels were still higher than those in the WT mice later in postnatal development; suggesting that some cells in the Rbl1/p107−/− OC may never fully become postmitotic (Figures 3(G) and (H)).
As the unusual signs of proliferation in the posmitotic OC could result in the generation of supernumerary HCs and SCs, we sought to further characterize the OC morphology in Rbl1/p107−/− mice at P21 when the mouse OC is near adult-like from a morphological and physiological point of view [8]. Myosin VIIa (M7a) and SOX2 antibodies, which label HC and SC, respectively, were used to identify the nature of those cells. On average, one additional row of M7a-positive cells was observed in the apical turn of the cochleae (Figure 4(A)). Ectopic M7apositive cells were also observed along the length of the cochleae in the OHC and IHC regions (Figures 4(E) and (I)). Likewise, supernumerary Sox2-positive cells were observed in the different regions of the sensory epithelia (Figures 4(C), (G) and (K)).
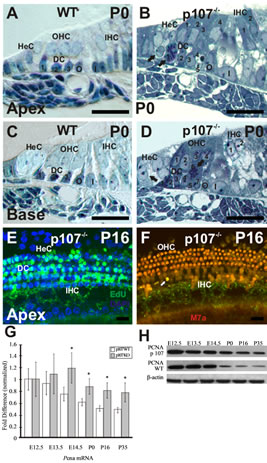
Figure 3. Rbl1/p107 deficiency affects postmitotic quiescence of the mouse OC. (A)-(D) Semithin (0.5 μm) plastic sections of apical and basal turns of the cochlea stained with toluidine blue show evidence of the presence of supernumerary cells in the Rbl1/p107−/− OC. The presence of dividing cells in the areas of the OC corresponding to the HeC and DC regions (black arrows) were equally observed at both turns of the mutant cochlea, but not in the WT control animals. (E), (F) Whole-mount preparations of the OC of P16 Rbl1/p107−/− and WT were assessed for cell cycle reentry using EdU (green). All tissues were counterstained with DAPI (blue). No labeling was observed in the WT OC (data not shown). Likewise, no signs of proliferation were observed at the OHC and IHC levels, except for a few sporadic cells infrequently observed near the IHCs (white arrow). (G), (H) PCNA transcript and protein expression were compared between WT and Rbl1/p107−/− OC. Consistent with the presence of cycling cells in Rbl1/p107−/− OC, PCNA levels were significantly upregulated in the postmitotic sensory epithelia (i.e., E14.5 forward). β-actin was used as loading control. HeC, Hensen’s cells; OHC, outer hair cells; IHC, inner hair cells; DC, Deiters’ cells; O, outer pillar cells; I, inner pillar cells; M7a, Myosin VIIa. Scale bar: 10 μm. *p < 0.01.
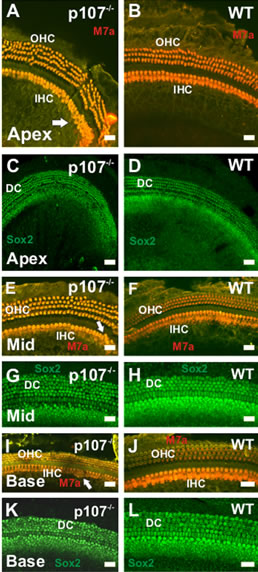
Figure 4. Supernumerary myosin VIIa (M7a)- and Sox2- positive cells in P21 p107−/− OC. (A)–(L) Additional rows of M7a-positive cells are observed in the OHC and IHC region of the apical turn in p107−/− (A), but not the WT (B) animals. While the presence of additional hair cells in the apical tip (white arrow) of the cochlea is not an uncommon trait for WT animals, the presence of supernumerary M7a-positive cells in the middle (Mid) (E) and basal (I) turns of Rbl1/ p107−/− cochlea (white arrows) resembles previous results observed in p130−/− OC12. Likewise, ectopic Sox2-positive cells were observed in Rbl1/p107−/− (C, G, K), but not in the WT control animals (D, H, L), supporting our premises that supernumerary cells in Rbl1/p107−/− survive to later time points. OHC, outer hair cells; IHC, inner hair cells; DC, Deiters’ cells. Scale bar: 10 μm.
3.4. Lack of Rbl1/p107 Affects Cell Differentiation in the Mouse OC
Of all the defects associated with Rbl1/p107 deficiency, failed cell differentiation is among the most prominent [21-23]. Given the previously described signs of OC morphological immaturity, we sought to investigate the possible impact of Rbl1/p107 loss in HC and SC differentiation. The Notch signaling pathway has been previously shown to regulate OC progenitor cell differentiation into HC and SC [24-27]. To determine whether it was affected in Rbl1/p107−/− OC, we examined the expression of genes in the Notch-signaling pathway, including Notch1, and its ligands Jag2, Delta-like 1 (Dll1), as well as the downstream targets Hes 1 and Hes 5 (Figures 5(A)-(E)). As revealed by RT-QPCR and supported by Western blot analyses (Figure 5(F)), the relative expression levels of Notch1 and its downstream target Hes1 were elevated in the Rbl1/p107−/− mouse, particularly in the postmitotic OC and at postnatal time points (Figures 5(A) and (B)). In contrast, Rbl1/p107−/− OC expression levels for Jag2 and Dll1, were comparable between Rbl1/ p107−/− and the WT control OC during embryonic development (Figures 5(C) and (D)). However, their lower levels in the postnatal Rbl1/p107−/− OC, supports our previous observations of impaired cell differentiation and OC imamturity. Except at E12.5, Hes5 relative expression levels showed no statistical differences from the WT OC. The biological relevance of this observation remains to be addressed.
Besides Notch-signaling, the interactive pathways for OC precursor cell proliferation and differentiation also require the basic helix-loop-helix (bHLH) family of TFs, including Atoh1 and the Inhibitor of DNA binding (Id) gene family [28-30]. During inner ear development, members of the Id family, particularly Id1 and Id3 [29, 31], act as natural inhibitors of the Atoh1 gene, a bona fide HC differentiation marker, and are thought to regulate HC proliferation and differentiation through their interaction with a variety of cell cycle regulators, including the pRB family [32-35]. Previous studies showed that Id1, Id2, and Id3 are expressed in the developing and postnatal inner ear [29]. Moreover, Id3, which had an expression level of 1.89-fold in Rbl1/p107−/− OC at E12.5 (p = 0.0098672), was considered “borderline upregulated” after the microarray data was sorted to include only those genes with expression greater than 2-fold and smaller than 0.5 (Figure 2). To further address the effects of Rbl1/p107 deficiency in the mouse OC, we analyzed the relative expression levels of Id1, Id2, and Id3, as well as the bHLH Atoh1 by RT-QPCR and Western blot. In agreement with Rbl1/p107’s role in OC cell proliferation and differentiation, expression of the three Id genes in the Rbl1/p107−/− OC during postmitotic development was noticeably affected (Figures 6(A)-(D)). While Id1 and
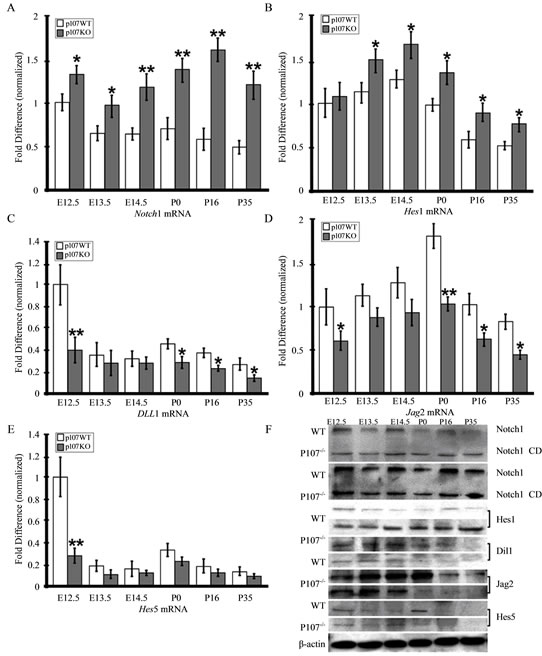
Figure 5. Rbl1/p107 deficiency affects OC differentiation. (A), (B) Consistently high levels of Notch1 mRNA and its downstream target, Hes1, were observed in Rbl1/p107−/− mice, but not in the WT control mice OC. (C), (D) On the other hand, Jag2 and Dll1 expression levels became significantly downregulated from P0 onward. (E) While at E12.5, Hes5 relative expression was lower than the control levels; no statistical differences were observed between WT and Rbl1/p107−/− Hes5 transcript levels during periods of cell proliferation and postnatal maturation. (F) Western blot analysis of protein lysates from WT and Rbl1/p107−/− developing (E12.5 – E14.5) and developed (P0 – P35) cochleae supported the RT-QPCR results. Of note, Rbl1/p107−/− OC had higher levels of both full-length Notch1 (~260 kD) and the activated intracellular domain of Notch1 (Notch1 CD) (160 kD). β-actin was used as loading control. *p < 0.01; **p < 0.001.
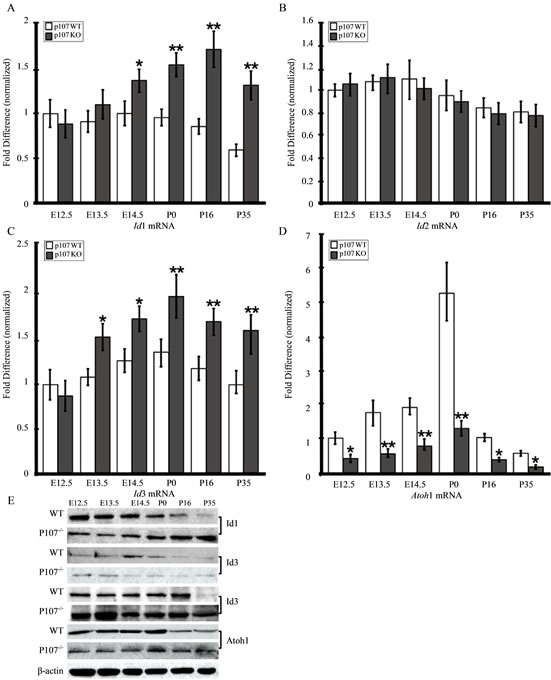
Figure 6. Rbl1/p107 represses the Id family of proteins and favors Atoh1 expression in the mouse OC. (A)-(C) Mouse OC lacking Rbl1/p107 displayed significantly elevated levels of Id1 (A) and Id3 (C). Id2 levels were not statistically different from those of the WT animals (B). (D) On the other hand, levels of the bona fide HC differentiation marker, Atoh1, were significantly downregulated compared to those of the WT control animals. Western blot analyses confirmed RT-QPCR results, supporting the importance of Rbl1/p107 in OC progenitor cell differentiation. β-actin was used as loading control. *p < 0.01; **p < 0.001.
Id3 levels were upregulated in the postmitotic OC (Figures 6(A) and (C)), Id2 levels were not significantly different from those of the WT animals (Figure 6(B)). Moreover, Atoh1 transcript levels were consistently downregulated in embryonic and postnatal Rbl1/p107−/− OC (Figure 6(D)), providing additional evidence for Rbl1/ p107’s impact on OC cell differentiation. Consistent with the RTQPCR results, Western blot analyses confirmed the expression pattern described for the Ids and Atoh1 transcripts (Figure 6(D)).
Because Rbl1/p107 has been shown to interact primarily with E2F TFs, we also examined mouse Notch1, Jag2, Dll1, Hes1, Hes5, Atoh1, and Id1-3 genes for E2f1-5 consensus binding sequences. Using PRIMA [15], we searched within 3000 bp upstream and 200 bp downstream of the transcriptional start site of each gene listed above. PRIMA analyses revealed the overrepresentation of a nine base sequence, TTTGGCGCG, which is a known E2F binding site [36], within the selected region, in all nine genes (data not shown; p = 0.00942, Bonferroni adjusted). Therefore, in the context of the Rbl1/p107−/− murine OC, these data suggest that Rbl1/p107 likely affects the regulation of crucial genes associated with OC progenitor cell proliferation and differentiation, through regulation of the E2f genes.
3.5. Lack of Rbl1/p107 Promotes Apoptosis in the Postnatal Rbl1/p107−/− Mouse OC
Previous studies have shown that unrestricted deletion of cell cycle-related genes leads to apoptotic death of all sensory HCs and their associated SCs in the mouse cochlea [2-5]. To determine the impact of Rbl1/p107 deficiency on OC cell survival, cryostat sections of OC from Rbl1/p107−/− and WT mice at P0, P16, and P35 were examined by TUNEL assay (Figures 7(A)-(H)). In situ end labeling of apoptotic cells by TUNEL revealed labeling in all nuclei in sections of the positive control (data not shown). However, no apoptotic cells were observed in the WT OC at any time point examined (data not shown). Likewise, no signs of apoptosis were observed in the Rbl1/p107−/− OC at P0 (data not shown). At P16 a lower number of TUNEL-positive HCs were detected (Figure 7(C)). By P35, apoptotic HCs and SCs were present in higher numbers, apparently following a baseto-apex gradient of cell death (Figures 7(E) and (G)). These results were further confirmed by the analyses of M7a immunostained whole-mount preparations of Rbl1/ p107−/− OC at P40, showing cellular debris and signs of cell loss throughout the length of the OC (Figures 7(I)-(K)), and particularly noticeable at the basal turn (Figure 7(K)). Of note, M7a, a marker not normally expressed in inner ear neurons [37], was observed in Rbl1/p107−/− SGNs (Figure 7(I)). To further assess our visual observation of inter-age variation in the number of
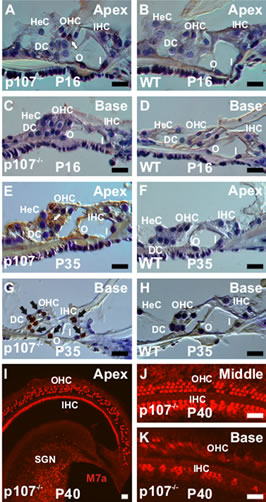
Figure 7. Rbl1/p107 deficiency triggers postnatal apoptosis in the mouse OC. (A), (C), (E), (G) Apoptotic cells as demonstrated by TUNEL assay were observed in Rbl1/p107−/−. Starting with sporadic cells at P16 (white arrow) (A), staining increased significantly by P35 (black arrows) (E, G). Cell death at later postnatal time points appeared to follow a base-to-apex gradient. Of note, no signs of apoptotic cells were observed in the WT control animals (B, D, F, H). (I)– (K) Consistent with a base-to-apex pattern of HC death, very few Myo7a-positive cells were left in the base of the cochlea by P40 (K). Likewise, clear signs of cell loss, particularly at the OHC level, were observed over the length of the Rbl1/p107−/− mouse OC. HeC, Hensen’s cells; OHC, outer hair cells; IHC, inner hair cells; DC, Deiters’ cells; O, outer pillar cells; I, inner pillar cells; SGN, spiral ganglion neurons; M7a, Myosin VIIa. Scale bar: 10 μm.
apoptotic cells in Rbl1/p107−/− OC, we counted the number of TUNEL-positive cells per section in 10 animals at P16 and P35. Since no apoptotic cells were observed in WT animals, we used only mutant animals for this analysis. Confirming our visual observations, the mean number of apoptotic cells per field was significantly higher at P35 compared to P16 (p < 0.01). This notion was further supported by the highly significant upregulation of Caspase 3 transcript and downregulation of p21cip1 (Cdkn1a) levels in postnatal Rbl1/p107−/− OC (Figures 8(A) and (B)).
3.6. Rbl2/p130, but Not Rb1 Expression, Is Upregulated in the Absence of Rbl1/p107
Cellular sensitivity to pRB deficiency seems to vary among tissues and may reflect the ability of these genes to functionally overlap and compensate for each other’s loss [23,38,39]. Previously, we have shown that Rbl1/ p107 and Rb1 mRNA expression remained unchanged in the OC of Rbl2/p130-deficient mouse [8]. To investigate whether lack of Rbl1/p107 in the cochlea sensory epithelia can be compensated for by the remaining pRBs, we analyzed the relative expression levels of all three pRBs in developing and postnatal OC of Rbl1/p107−/− and WT OC. As expected, no Rbl1/p107 mRNA or protein expression was observed in Rbl1/p107−/− mouse OC at any time point analyzed (data not shown). However, as suggested by our previous microarray analyses (Table 2), Rbl2/ p130 relative expression levels, which were elevated in Rbl1/p107−/− throughout OC embryonic development, became significantly upregulated at postnatal time points (Figure 8(C)). At P35, however, Rbl2/p130 levels were significantly downregulated compared to the WT control mouse (Figure 8(C)). Overall, differences in Rb1 mRNA levels between WT and mutant OC were not found to be statistically significant (data not shown). Combined, these analyses suggest that Rbl1/p107 loss in the cochlear sensory epithelia is, to some extent, compensated for by a
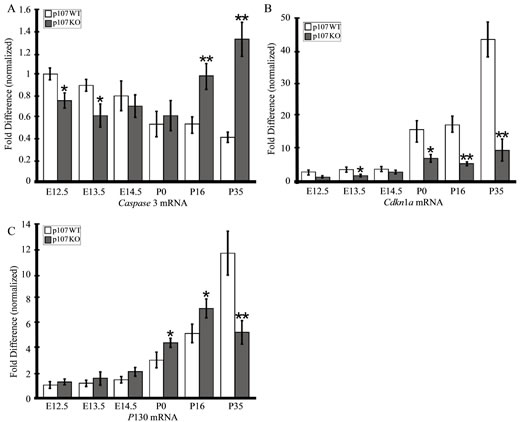
Figure 8. Apoptosis and compensation in the Rbl1/p107−/− OC. (A), (B) Upregulation of the apoptotic Caspase 3 mRNA in the postnatal OC is consistent with downregulation of the bona fide apoptotic inhibitor Cdkn1a, particularly in the late postnatal OC. (C) While changes in Rb1 expression levels were not found to be at statistically significant levels (data not shown), Rbl2/ p130 transcript levels were found to be elevated in the postmitotic OC and significantly upregulated up to P16, when apoptotic cells were detected in the OC. At P35, when the number of apoptotic cells increased considerably, Rbl2/p130 levels were significantly lower compared to the WT control animals. *p < 0.01; **p < 0.001.
temporal upregulation of Rbl2/p130 transcription.
3.7. Absence of Rbl1/p107 Causes Hearing Aabnormalities
To investigate the effects of loss of the Rbl1/p107 protein on cochlear function, ABRs and DPOAEs were examined in Rbl1/p107 null mice and compared to age-matched controls. At P30, neural thresholds derived from ABRs were uniformly elevated across the responsive frequency range; however, threshold elevations were highly variable across mutant individuals (Figure 9(A)). The most sensitive frequency region observed at P30 was a narrow band of frequencies centered on roughly 16 kHz, with ABR thresholds ranging from approximately 35 to 70 dB SPL in Rbl1/p107−/− mice compared to an average threshold of 26 ± 5.8 dB SPL observed for control animals. In addition, average thresholds for the response of Rbl1/p107−/− mice to click stimuli were elevated by approximately 31 dB relative to those of control mice. Response sensitivities for heterozygotes were indistinguishable from the WT group across the frequency range. Threshold estimates for WT mice dropped off at an average rate of 66 and −21 dB/octave above and below center frequency, respectively, and threshold changes with frequency were similar for both heterozygotes and homozygous null mice. Closer inspection of curves re-
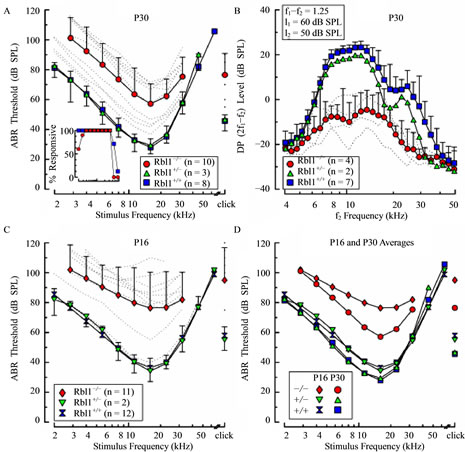
Figure 9. ABR thresholds and DPOAEs in Rbl1/p107−/− mice. (A), (C) Average ABR thresholds are shown as a function of stimulus frequency for homozygous (Rbl1/p107−/−), heterozygous (Rbl1/p107+/−), and WT mice (Rbl1/p107+/+) at P30 (A) and P16 (C). Thresholds of individual Rbl1/p107−/− mice are shown as dotted lines. To discern developmental trends, average thresholds for each genetic group are replotted in (D). Average DPOAE levels are shown as a function of f2 frequency for each genetic group at P30 in (B). Primary stimuli were varied with f2/f1 = 1.25, with f2 and f1 levels (l2 and l1, respectively) held constant at 50 and 60 dB SPL. Error bars represent 1 standard deviation and are shown in one direction only for clarity. Inset in (A) represents the percentage of animals at P30 in which ABRs could be elicited at the maximum output of the sound system as a function of stimulus frequency.
presenting individual mutant mice suggests the existence of two populations, a highand low-threshold group, divided somewhat arbitrarily by the mean threshold-frequency function. Thresholds of the high-threshold group were in the vicinity of 55 - 70 dB SPL for frequencies centered on 16 kHz, and roll-off rates were similar to those observed when whole population average values were considered. Threshold estimates representing the low-threshold group were more narrowly distributed, ranging between 35 and 45 dB at 16 kHz, and, like the high-threshold group, thresholds rolled off at approximately the same rate as the curve representing average values. It is notable that none of the Rbl1/p107−/− mice were as sensitive to tone burst stimuli as WT mice or mice that were heterozygous for the Rbl1/p107 null allele, regardless of frequency. Evidence that the physiological phenotype of Rbl1/p107−/− mice is a reflection of the operational status of sensory cells, and in particular OHCs, rather than neural components of the inner ear was acquired by comparing DPOAEs in WT and mutant mice. Across the responsive frequency range, average DP levels recorded from Rbl1/p107−/− mice at P30 were consistently smaller than those measured in representatives of WT and heterozygote cohorts (Figure 9(B)). Note that the data shown for the Rbl1/p107−/− animals reflect the average for the four individuals that had the lowest ABR thresholds. No responses from the mutant animals in the high-threshold group were obtained using the primary stimulus conditions indicated. These data suggest that abnormalities in the OHCs region resulting from deletion of the Rbl1/p107 gene contribute to the functional deficits observed in neural responses in homozygous mutant animals.
3.8. Rbl1/p107 Deficiency Delays Development of Cochlear Function
To determine whether developmental delays in cochlear function were associated with Rbl1/p107 deficiency, animals were studied at P16. At this age, when WT mice are nearly mature with regard to sensitivity, the majority of Rbl1/p107−/− mice exhibited elevated thresholds (Figure 9(C)). Thresholds in the most sensitive frequency range of Rbl1/p107−/− mice extended from approximately 75 to 95 dB SPL with the greatest variability in thresholds observed in response to mid-range and higher stimulus frequencies. Moreover, frequency-threshold curves at P16 were relatively flat when compared to the average curve representing homozygous Rbl1/p107−/− animals at P30. Interestingly, two Rbl1/p107−/− mice were as sensitive as the WT and heterozygous mice across the frequency range studied. Furthermore, one Rbl1/ p107−/− had intermediate thresholds with peak sensitivity of approximately 55 dB SPL at 16 kHz, and thresholdfrequency roll-off rates similar to those observed for control animals. Differences observed in average thresholds of Rbl1/p107−/− mice between P16 and P30 (Figure 9(D)) are consistent with the idea that loss of Rbl1/p107 results in developmental delays in cochlear function, which is also consistent with histologic and molecular data. Sensitivity to acoustic stimuli increased across the frequency range for Rbl1/p107−/− mice between P16 and P30, with the largest improvement (~20 dB) occurring in the most sensitive frequency range. Although thresholds also improved for both heterozygous and WT mice during the same time period, improvements were limited to a maximum of ~7 dB in response to only midand low-frequency stimuli (£16 kHz).
One clear feature of auditory system immaturity revealed by the ABR is the duration of response peaks, which tends to be longer in neonatal mice when compared to responses from more mature animals [40]. However, as shown in Figures 10(B) and (C) for representative examples of ABRs acquired from Rbl1/p107−/− mice at P16, the durations of wave I, as well as subsequent waves, were similar to those of age-matched controls (Figure 10(A)). This was observed for responses from mutant mice having relatively low thresholds (Figure 10(B)), as well as from those having high thresholds (Figure 10(C)), suggesting that elements associated with this response feature develop normally in mutant animals. Additional evidence that Rbl1/p107-deficient mice are developmentally delayed comes from data indicating that the percentage of homozygous mutant mice responsive to the lowest stimulus frequencies studied (2.0 - 2.8 kHz), as well as to 32 kHz, increased between P16 and P30 (Figure 9(A) inset and Figure 10(D)). At corresponding ages, all WT animals responded to tone bursts at these stimulus frequencies. However, even by P30, not all Rbl1/p107−/− mice responded in the low frequency range. Note that the number of mice responsive to the highest frequencies declined for both Rbl1/p107−/− and WT groups by P30, indicative of age-related hearing loss. Although indirect, if body weight is taken as an indicator of developmental state, the idea that development in the Rbl1/p107−/− mouse is delayed relative to WT cohorts is further supported by the observation that thresholds were high in individuals with low body weights, but improved (decreased) linearly as body weight increased in both P16 and P30 animals (Figures 10(E) and (F)). Although this trend was observed at both ages, the rate of improvement was greater in P16 animals than in P30 mice, as indicated by the steeper function representing the threshold-body weight relationship on P16.
To further pursue the question of maturity, response latencies and amplitudes associated with ABRs from Rbl1/p107−/− mice were considered, in the form of inputoutput (IO) curves, and compared with WT cohorts. It is well known that prolonged response latencies and dimi-
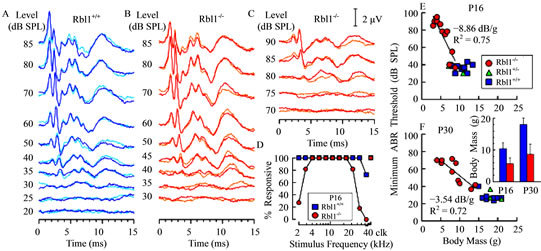
Figure 10. Representative examples of ABR waveforms obtained in response to 16 kHz tone pips at the indicated sound pressure levels are shown for a WT mouse (A), a homozygous mutant mouse having a relatively low threshold (B), and an Rbl1/p107−/− individual with a high threshold (C). Two overlapping replicates are shown for each stimulus level. The amplitude scale for (A)-(C) is indicated in (C). (D) The percentage of animals at P16 in which ABRs could be elicited at the maximum output of the sound system is shown as a function of stimulus frequency for both homozygous mutant and WT groups. ABR thresholds at the most sensitive frequency were correlated with body mass for Rbl1/p107−/− mice at both P16 (E) and P30 (F); a similar correlation was not observed for WT animals. Lines represent linear regressions fitted to the Rbl1/p107−/− data sets. Slopes and R2 of the fitted lines are indicated in each panel. Average body masses for the WT and Rbl1/p107−/− groups at each age studied are shown in the inset in (F). Error bars represent standard deviations.
nished response amplitudes are hallmarks of delayed de velopment, and both conditions were observed in some, but not all, Rbl1/p107−/− animals on P16 and P30 (Figure 11). As with sensitivity curves, a subset of IO curves representing mutant mice closely resembled WT IO curves, the short latency, nearly mature group, and a second group, the prolonged latency group, that was clearly segregated from the nearly mature group at both ages, regardless of stimulus type. The segregation of short and prolonged latency groups was most striking in P16 mice under higher frequency stimulus conditions (i.e., for responses to 22.6 and 11.3 kHz, as well as to clicks). Essentially the same was observed when considering response amplitude IO curves in P16 mice; that is, response amplitudes segregated into two groups; a largeamplitude, nearly mature group that extensively overlapped curves representing the WT group, and a small amplitude group representing those mice with clearly elevated thresholds. Among mutant mice at P30, segregation into two groups was less evident, particularly when considering higher frequency conditions (11.3 and 22.6 kHz), although separation was apparent in data representing responses to clicks and 5.7 kHz.
To determine whether response differences reported here are independent of one another or driven by a common immaturity, we plotted ABR wave I amplitudes against response latencies for both P16 and P30 age groups (Figure 12). The degree of overlap between WT and Rbl1/p107−/− mice in this analytical space is extensive. Large amplitude responses were associated with relatively short latencies and low amplitudes with prolonged latencies, regardless of the genotype under consideration. This finding suggests that differences in sensitivity separating WT from Rbl1/p107−/− mice account for most, if not the entire phenotypic variance in function observed in this investigation.
4. Discussion
During OC development, neurosensory progenitor cells exit the cell cycle between E13.5 and E14.5 and differentiate it [1]. This process, regulated by clonal expansion and/or hierarchical restrictions [30], results in the loss of multipotency. Our present data suggest that Rbl1/p107 participates in this process by negatively regulating proliferation while positively mediating differentiation, functional maturation, and survival genes of OC prosensory progenitor cells. Rbl1/p107 was found to regulate the number and self-renewal capacity of neural stem cells in the brain [41,42]. In contrast, neural stem cell numbers in embryonic Rb−/− did not differ from the WT control animals, implying that not all pRBs affect stem cell pool regulation [41].
Cells in postnatal Rbl1/p107−/− mice OC continue to
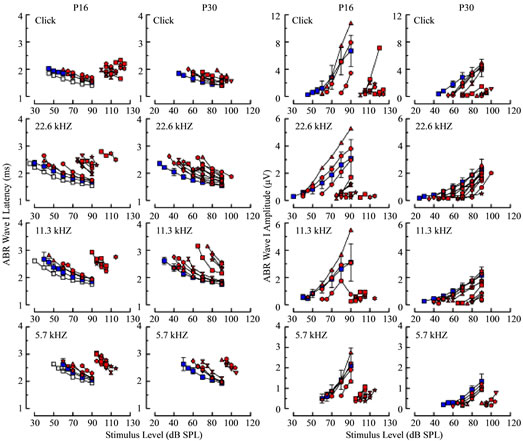
Figure 11. ABR wave I latencies (left columns) and amplitudes (right columns) are shown as a function of stimulus level for four stimulus conditions (rows) at P16 (first and third columns) and P30 (second and fourth columns). For the WT group, average latencies and amplitudes are shown (blue squares), along with standard deviations in each panel, and for the Rbl1/ p107−/− group, values measured from individual responses are shown in red, with different animals represented by different symbol shapes. Averages from the P30 WT group are replotted as gray squares for the corresponding stimulus conditions in the first and third columns to show more clearly age-related differences in the control groups.
divide past the proliferation brink, resulting in an overall increase in the number of HeC and DCs, which are considered potential therapeutic targets for HC regeneration [43]. As there are no definitive markers of proliferating OC prosensory cells, we investigated the developing OC of E12.5 Rbl1/p107−/− and WT mice by microarray analyses. Consistent with the notion that Rbl1/p107 regulates OC precursor cell expansion, E12.5 Rbl1/p107−/− OC showed significant upregulation of cell cycle-related genes. In contrast, downregulated genes included several TF, such as Neurod1, Pou4f3, and Pax3, which are expressed in committed prosensory cells and essential for postmitotic neurosensory cell differentiation [44]. In the embryonic OC, Rbl1/p107 may coordinate downregulation of mitotic and pro-apoptotic genes while allowing for the expression of genes necessary for prosensory cell commitment and differentiation [44]. Analyses of Rbl1/ p107−/− OC at P0, showing downregulation of Gata3, Atoh1 and Pou4f3 and the upregulation of genes associated with continued cell proliferation support our hypothesis.
The fact that HeC and DC numbers were proportionally increased compared to HCs is not surprising since lower absolute levels of Atoh1 and Pou4f3 would be expected to result in a relative decrease in differentiated HCs versus other cell types in the OC. This expression trend was still observed at P35, where downregulated genes included several crucial neurosensory cell differentiation markers involved in OC maintenance and homeostasis. Among them is the CDK inhibitor p27Kip1 (Cdkn1b), a cell cycle regulator and SC differentiation marker [45]. Under normal circumstances, Cdkn1b ex-
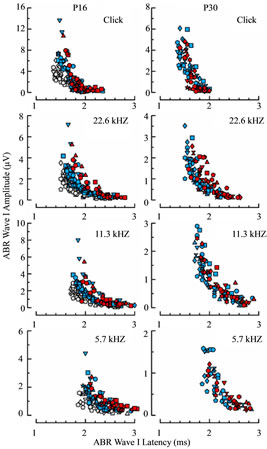
Figure 12. Relation between wave I latency and amplitude measured from ABRs acquired in animals at P16 (left column) and P30 (right column) in response to the same four stimulus conditions (rows) shown in Figure 11. Blue and red symbols represent measurements determined from WT and Rbl1/p107−/− animals, respectively. Values from the P30 WT mice are replotted for the corresponding stimulus conditions as gray symbols in the left column to compare age-related differences in the control groups.
pression is inversely correlated to the proliferative status of cells. Therefore, our findings on Cdknlb downregulation in the Rbl1/p107−/− inner ear sensory epithelia is consistent with the observation that Rbl1/p107-deficient OC cells are still actively cycling past the normal proliferation threshold. As expected from the unscheduled downregulation of important homeostatic and cell survival factors, Rbl1/p107−/− OC at P35 also showed an increase in the number of upregulated apoptotic genes.
Parallel to Rbl1/p107’s importance in maintaining and regulating neural precursor cells in the mammalian brain, the Notch-Hes-Hey-mediated network, required for selfrenewing stem cell proliferation and stem cell maintenance [26,42,46], was significantly enriched in Rbl1/ p107−/− OC. Furthermore, postnatal Rbl1/p107−/− OC expressed elevated levels of Notch1 and Hes1 transcripts and protein, suggesting greater activation of Notch-Hes signaling in the postmitotic OC. The Notch signaling pathway plays numerous roles during inner ear development [26], including the establishment of the inner ear prosensory domains, HC and SC differentiation, and OC patterning through “lateral inhibition” [25]. In the OC, we hypothesize that Rbl1/p107 regulates OC progenitor cell potency by repressing Notch1 and Hes1 expression, but not Hes5, whose expression was unaffected in the absence of Rbl1/p107. What supports this hypothesis is the evidence gathered from analyses of Rbl1/p107-deficient neural precursor cells, showing that Rbl1/p107 deficiency in Hes1−/− mice rescues the size of the neural precursor pool and differentiation defects [42]. Moreover, overrepresentation of potential E2F binding sites, including those found upstream of Notch1 and Hes1, and the significant changes in the expression of these genes reinforce our premise that Rbl1/p107 directly effects the Notch1- and Hes1-mediated cell-cell signaling.
Associations of Rbl1/p107 to neurosensory cell differentiation is supported by the observation that several key TFs, such as Prox1, Runx2, and C/ebp α, as well as positive regulators of HC-differentiation Atoh1 and the pRB-interacting MyoD1, were differentially affected through Rbl1/p107 loss. As an antagonist to bHLH signaling, Id proteins, members of the HLH family, are important negative regulators of differentiation in virtually all tissues, including the inner ear [31-33,47]. Mice lacking both Id1 and Id3 expressed tissue-specific bHLH factors, including Atoh1, earlier than WT control animals, triggering premature cell cycle exit and cell differentiation [47]. In Rbl1/p107−/−, Id1 and Id3, but not Id2, mRNAs were upregulated, particularly in the postmitotic OC, coinciding with significant downregulation of Atoh1.
Id2 is uniquely able to abolish the growth-suppressive activity of the pRb family [32,48]. Certain quiescent cells have low levels of ID2 complexed with Rbl2/p130/E2F4 and the HDAC component mSin3A, bound to the Myc promoter [49]. The levels of Rbl2/p130, E2f4, and Myc were significantly upregulated in Rbl1/p107−/− OC. The increased proliferation in Rbl1/p107−/− is reflected in the Myc increase, but just how Id2, E2f4, and Rbl2/p130 interactions influence Myc directly, or whether it reflects the compensatory ability of the remaining pocket proteins, remains to be tested. Indeed, Rbl2/p130 upregulation in Rbl1/p107−/− OC may have, in part, compensated for the loss of Rbl1/p107 and contributed to the functional variability observed between Rbl1/p107−/− animals. Compared to Rbl2/p130−/− animals [8], the physiological phenotype of Rbl1/p107−/− mice was noticeably more complex. In the absence of Rbl1/p107, development of cochlear function occurs at a significantly reduced rate relative to WT animals. The variability of response, clearly segregated into relatively mature and definitively immature groups, depicts functional immaturity in the Rbl1/p107−/− cochlea. The general lack of acoustic sensitivity observed in Rbl1/p107−/− mice at P16 and the wide range of sensitivity observed at P30, suggests that auditory function is developmentally delayed in Rbl1/p107−/− mice. In addition, the variable expression of apoptotic cells and possible compensatory influence of Rbl2/p130 may at least partially explain sensitivity differences observed in Rbl1/p107−/− animals, and suggests functional overlapping between the pRBs in the auditory system. Functional overlapping on the pRBs activity has been documented in a variety of other systems [21,23,39], somewhat complicating our understanding of their specific roles in critical cellular functions including cell differentiation and functional maturation.
Lack of apoptosis in Rbl1/p107−/− OC until later in postnatal maturation suggests that the role of Rbl1/p107 in cell survival is secondary to its importance in cell cycle control and differentiation. In this sense, Rbl1/p107’s role sharply contrasts with Rb1’s role in the OC [2-5]. Moreover, Rb1-deficient HCs are capable of retaining function and differentiated phenotypes despite increased proliferation [5]. Uncoupled proliferation, differentiation, and apoptosis in Rbl1/p107-deficient OC is demonstrated by the significant downregulation of many HC-differentiation markers and the upregulation of DNA synthesis and proliferation markers in the embryonic and early postnatal OC. Rb1-deficiency in the lens and CNS, as well as HC apoptosis after Cyclin-dependent kinase inhibitors (CKIs) suppression, has been shown to involve p53-dependent pathways [50,51]. In the CNS, Rb1-deficiency increased protein levels and DNA binding activity of p53, resulting in upregulation of p21Cip1 (Cdkn1a). While p53 levels were not significantly different between the WT and Rbl1/107−/− OC (data not shown), Caspase 3 and Cdkn1a were significantly upregulated and downregulated, respectively, in the postnatal OC. Although the mechanism underlying apoptosis in Rbl1/p107−/− OC is yet to be resolved, upregulation of cdk2 via degradation of Cdkn1a by Caspase 3 and upregulation of Cyclins A and E may play a role in this process, as previously reported [52].
In mammalian vertebrates cellular multipotency is lost following the initial development and maturation of the cochlear neurosensory epithelia. Our results support Rbl1/p107 role in both the initial cell differentiation program and in establishing functional maturation of auditory sensory cells. Based upon this premise, Rbl1/p107 becomes an attractive therapeutic target for reprograming SCs in the OC following HC loss. Just as uncommitted neural precursor cells in the adult brain depend on Rbl1/ p107 to retain multipotency [42], regulated Rbl1/p107 expression in the damaged cochlea is likely to initiate a preprogramed signaling cascade leading to the generation of new sensory HCs.
5. Acknowledgements
This work was funded in part by NIH/NIDCD 5R03DC- 9989, NIH/COBRE/NCRR P20 RR018788-06A, The State of Nebraska LB 692 (S. M. Rocha-Sanchez), and NIH/NCRR G20RR024001 (Creighton University Animal Research Facility). We thank Jason Peng, Achyata Shrestha, Taylor Mighell, and Michael Heinz for their invaluable technical assistance. The Confocal microscopic system was made available by the Nebraska Center for Cell Biology at Creighton University.
REFERENCES
- R. J. Ruben, “Development of the Inner Ear of the Mouse: A Radioautographic Study of Terminal Mitoses,” Acta Otolaryngologica, Vol. 220, No. 1, 1967, pp. 1-44.
- J. Mantela, Z. Jiang, J. Ylikoski, B. Fritzsch, E. Zacksenhaus and U. Pirvola, “The Retinoblastoma Gene Pathway Regulates the Postmitotic State of Hair Cells of the Mouse Inner Ear,” Development, Vol 132, No. 10, 2005, pp. 2377-2388. http://dx.doi.org/10.1242/dev.01834
- T. Weber, M. K. Corbett, L. M. Chow, M. B. Valentine, S. J. Baker and J. Zuo, “Rapid Cell-Cycle Reentry and Cell Death after Acute Inactivation of the Retinoblastoma Gene Product in Postnatal Cochlear Hair Cells,” Proceedings of the National Academy of Sciences USA, Vol. 105, No. 2, 2008, pp. 781-785. http://dx.doi.org/10.1073/pnas.0708061105
- C. Sage, M. Huang, K. Karimi, G. Gutierrez, M. A. Vollrath, D. S. Zhang, J. Garcia-Anoveros, P. W. Hinds, J. T. Corwin, D. P. Corey and Z. Y. Chen, “Proliferation of Functional Hair Cells in Vivo in the Absence of the Retinoblastoma Protein,” Science, Vol. 307, No. 5712, 2005, pp. 1114-1118. http://dx.doi.org/10.1126/science.1106642
- C. Sage, M. Huang, M. A. Vollrath, M. C. Brown, P. W. Hinds, D. P. Corey, D. E. Vetter and Z. Y Chen, “Essential Role of Retinoblastoma Protein in Mammalian Hair Cell Development and Hearing,” Proceedings of the National Academy of Sciences USA, Vol 103, No. 19, 2006, pp. 7345-7350. http://dx.doi.org/10.1073/pnas.0510631103
- S. M. Rocha-Sanchez and K. W. Beisel, “Pocket Proteins and Cell Cycle Regulation in Inner Ear Development,” International Journal of Developmental Biology, Vol. 51, No. 6-7, 2007, pp. 585-595. http://dx.doi.org/10.1387/ijdb.072387sr
- M. Huang, C. Sage, Y. Tang, S. G. Lee, M. Petrillo, P. W. Hinds and Z. Y. Chen, “Overlapping and Distinct pRb Pathways in the Mammalian Auditory and Vestibular Organs,” Cell Cycle, Vol. 10, No. 2, 2011, pp. 337-351. http://dx.doi.org/10.4161/cc.10.2.14640
- S. M. Rocha-Sanchez, L. R. Scheetz, M. Contreras, M. D. Weston, M. Korte, J. McGee and E. J. Walsh, “Mature Mice Lacking Rbl2/p130 Gene Have Supernumerary Inner Ear Hair Cells and Supporting Cells,” Journal of Neuroscience, Vol. 31, No. 24, 2011, pp. 8883-8893. http://dx.doi.org/10.1523/JNEUROSCI.5821-10.2011
- C. Giacinti and A. Giordano, “RB and Cell Cycle Progression,” Oncogene, Vol. 25, No. 38, 2006, pp. 5220-5227. http://dx.doi.org/10.1038/sj.onc.1209615
- M.-H. Lee, B. O. Williams, G. Mulligan, S. Mukai, R. T. Bronson, N. Dyson, E. Harlow and T. Jacks, “Targeted Disruption of p107: Functional Overlap between p107 and Rb,” Genes & Development, Vol. 10, No. 13, 1996, pp. 1621-1632. http://dx.doi.org/10.1101/gad.10.13.1621
- C. Stadelmann and H. Lassmann, “Detection of Apoptosis in Tissue Sections,” Cell and Tissue Research, Vol. 301, No. 1, 2000, pp. 19-31. http://dx.doi.org/10.1007/s004410000203
- R. A. Irizarry, L. Gautier, B. M. Bolstad and C. Miller Affy, “Methods for Affymetrix Oligonucleotide Arrays,” 2004. http://dx.doi.org/10.1007/0-387-21679-0_4
- G. W. Wright and R. M. Simon, “A Random Variance Model for Detection of Differential Gene Expression in Small Microarray Experiments,” Bioinformatics, Vol. 19, No. 18, 2003, pp. 2448-2455. http://dx.doi.org/10.1093/bioinformatics/btg345
- Y. Benjamini and Y. Hochberg, “Controlling the False Discovery Rate: A Practical and Powerful Approach to Multiple Testing,” Journal of the Royal Statistical Society: Series B (Statistical Methodology), Vol. 57, No. 1, 1995, pp. 289-300.
- I. Ulitsky, A. Maron-Katz, S. Shavit, D. Sagir, C. Linhart, R. Elkon, A. Tanay, R. Sharan, Y. Shiloh and R. Shamir, “Expander: From Expression Microarrays to Networks and Functions,” Nature Protocols, Vol. 5, No. 2, 2010, pp. 303-322. http://dx.doi.org/10.1038/nprot.2009.230
- H. Mi, A. Muruganujan and P. D. Thomas, “PANTHER in 2013: Modeling the Evolution of Gene Function, and Other Gene Attributes, in the Context of Phylogenetic Trees,” Nucleic Acids Research, Vol. 41, 2012, pp. D377- D386. http://dx.doi.org/10.1093/nar/gks1118
- C. F. Schaefer, K. Anthony, S. Krupa, J. Buchoff, M. Day, T. Hannay and K. H. Buetow, “PID: the Pathway Interaction Database,” Nucleic Acids Research, Vol. 37, 2009, pp. D674-D679. http://dx.doi.org/10.1093/nar/gkn653
- J. R. Managbanag, T. M. Witten, D. Bonchev, L. A. Fox, M. Tsuchiya, B. K. Kennedy and M. Kaeberlein, “Shortest-Path Network Analysis Is a Useful Approach toward Identifying Genetic Determinants of Longevity,” PLoS One, Vol. 3, No. 11, 2008, Article ID: e3802. http://dx.doi.org/10.1371/journal.pone.0003802
- D. Phippard, L. Lu, D. Lee, J. C. Saunders and E. B. Crenshaw, “Targeted Mutagenesis of the POU-Domain Gene Brn4/Pou3f4 Causes Developmental Defects in the Inner Ear,” Neuroscience, Vol. 19, No. 14, 1999, pp. 5980- 5989.
- F. J. Kubben, A. Peeters-Haesevoets, L. G. Engels, C. G. Baeten, B. Schutte, J. W. Arends, R. W. Stockbrugger and G. H. Blijham, “Proliferating Cell Nuclear Antigen (PCNA): A New Marker to Study Human Colonic Cell Proliferation,” Gut, Vol. 35, No. 4, 1994, pp. 530-535.
- X. Mayol and X. Grana, “pRB, p107 and p130 as Transcriptional Regulators: Role in Cell Growth and Differentiation,” Progress in Cell Cycle Research, Vol. 3, 1997, pp. 157-169. http://dx.doi.org/10.1007/978-1-4615-5371-7_13
- X. Grana, J. Garriga and X. Mayol, “Role of the Retinoblastoma Protein Family, pRB, p107 and p130 in the Negative Control of Cell Growth,” Oncogene, Vol. 17, No. 25, 1998, pp. 3365-3383. http://dx.doi.org/10.1038/sj.onc.1202575
- M. M. Lipinski and T. Jacks, “The Retinoblastoma Gene Family in Differentiation and Development,” Oncogene, Vol. 18, No. 55, 1999, pp. 7873-7882. http://dx.doi.org/10.1038/sj.onc.1203244
- J. Murata, K. Ikeda and H. Okano, “Notch Signaling and the Developing Inner Ear,” Advances in Experimental Medicine and Biology, Vol. 727, 2012, pp. 161-173. http://dx.doi.org/10.1007/978-1-4614-0899-4_12
- B. H. Hartman, T. A. Reh and O. Bermingham-McDonogh, “Notch Signaling Specifies Prosensory Domains via Lateral Induction in the Developing Mammalian Inner Ear,” Proceedings of the National Academy of Sciences USA, Vol. 107, No. 33, 2010, pp. 15792-15797. http://dx.doi.org/10.1073/pnas.1002827107
- J. Murata, T. Ohtsuka, A. Tokunaga, S. Nishiike, H. Inohara, H. Okano and R. Kageyama, “Notch-Hes1 Pathway Contributes to the Cochlear Prosensory Formation Potentially through the Transcriptional Down-Regulation of p27Kip1,” Journal of Neuroscience Research, Vol. 87, No. 16, 2009, pp. 3521-3534. http://dx.doi.org/10.1002/jnr.22169
- K. Mizutari, M. Fujioka, M. Hosoya, N. Bramhall, H. J. Okano, H. Okano and A. S. Edge, “Notch Inhibition Induces Cochlear Hair Cell Regeneration and Recovery of Hearing after Acoustic Trauma,” Neuron, Vol. 77, No. 1, 2013, pp. 58-69. http://dx.doi.org/10.1016/j.neuron.2012.10.032
- N. A. Bermingham, B. A. Hassan, S. D. Price, M. A. Vollrath, N. Ben-Arie, R. A. Eatock, H. J. Bellen, A. Lysakowski and H. Y. Zoghbi, “Math1: An Essential Gene for the Generation of Inner Ear Hair Cells,” Science, Vol. 284, No. 5421, 1999, pp. 1837-1841. http://dx.doi.org/10.1126/science.284.5421.1837
- J. M. Jones, M. Montcouquiol, A. Dabdoub, C. Woods and M. W. Kelley, “Inhibitors of Differentiation and DNA Binding (Ids) Regulate Math1 and Hair Cell Formation during the Development of the Organ of Corti,” Journal of Neuroscience, Vol. 26, No. 2, 2006, pp. 550-558. http://dx.doi.org/10.1523/JNEUROSCI.3859-05.2006
- B. Fritzsch, D. F. Eberl and K. W. Beisel, “The Role of bHLH Genes in Ear Development and Evolution: Revisiting a 10-Year-Old Hypothesis,” Cellular and Molecular Life Sciences, Vol. 67, No. 18, 2010, pp. 3089-3099. http://dx.doi.org/10.1007/s00018-010-0403-x
- M. Ozeki, E. P. Schlentz and J. Lin, “Characterization of Inhibitor of Differentiation (Id3) Gene Expression in the Developing Cochlear Tissue of Rats,” Acta Otolaryngologica, Vol. 125, No. 3, 2005, pp. 244-249. http://dx.doi.org/10.1080/00016480510027105
- A. Lasorella, A. Iavarone and M. A. Israel, “Id2 Specifically Alters Regulation of the Cell Cycle by Tumor Suppressor Proteins,” Molecular and Cellular Biology, Vol. 16, No. 6, 1996, pp. 2570-2578.
- Z. Zebedee and E. Hara, “Id Proteins in Cell Cycle Control and Cellular Senescence,” Oncogene, Vol. 20, No. 58, 2001, pp. 8317-8325. http://dx.doi.org/10.1038/sj.onc.1205092
- Y. Yokota and S. Mori, “Role of Id Family Proteins in Growth Control,” Journal of Cellular Physiology, Vol. 190, No. 1, 2002, pp. 21-28. http://dx.doi.org/10.1002/jcp.10042
- Q. L. Ying, J. Nichols, I. Chambers and A. Smith, “BMP Induction of Id Proteins Suppresses Differentiation and Sustains Embryonic Stem Cell Self-Renewal in Collaboration with STAT3,” Cell, Vol. 115, No. 3, 2003, pp. 281- 292. http://dx.doi.org/10.1016/S0092-8674(03)00847-X
- D. L. Burkhart, S. E. Wirt, A. F. Zmoos, M. S. Kareta and J. Sage, “Tandem E2F Binding Sites in the Promoter of the p107 Cell Cycle Regulator Control p107 Expression and Its Cellular Functions,” PLoS Genet, Vol. 6, 2010, Article ID: e1001003. http://dx.doi.org/10.1371/journal.pgen.1001003
- M. A. Parker, D. A. Corliss, B. Gray, J. K. Anderson, R. P. Bobbin, E. Y. Snyder and D. A. Cotanche, “Neural Stem Cells Injected into the Sound-Damaged Cochlea Migrate throughout the Cochlea and Express Markers of Hair Cells, Supporting Cells, and Spiral Ganglion Cells,” Hearing Research, Vol. 232, No. 1-2, 2007, pp. 29-43. http://dx.doi.org/10.1016/j.heares.2007.06.007
- D. Cobrinik, M. H. Lee, G. Hannon, G. Mulligan, R. T. Bronson, N. Dyson, E. Harlow, D. Beach, R. A. Weinberg and T. Jacks, “Shared Role of the pRB-Related p130 and p107 Proteins in Limb Development,” Genes & Development, Vol. 10, No. 13, 1996, pp. 1633-1644. http://dx.doi.org/10.1101/gad.10.13.1633
- J. H. Dannenberg, L. Schuijff, M. Dekker, M. van der Valk and H. te Riele, “Tissue-Specific Tumor Suppressor Activity of Retinoblastoma Gene Homologs p107 and p130,” Genes & Development, Vol, 18, No. 23, 2004, pp. 2952-2962. http://dx.doi.org/10.1101/gad.322004
- L. Song, J. McGee and E. J. Walsh, “Frequencyand Level-Dependent Changes in Auditory Brainstem Responses (ABRS) in Developing Mice,” Journal of the Acoustical Society of America, Vol. 119, No. 4, 2006, pp. 2242-2257. http://dx.doi.org/10.1121/1.2180533
- J. L. Vanderluit, K. L. Ferguson, V. Nikoletopoulou, M M. Parker, V. Ruzhynsky, T. Alexson, S. M. McNamara, D. S. Park, M. Rudnicki and R. S. Slack, “p107 Regulates Neural Precursor Cells in the Mammalian Brain,” Journal of Cell Biology, Vol. 166, No. 6, 2004, pp. 853-863. http://dx.doi.org/10.1083/jcb.200703176
- J. L. Vanderluit, C. A. Wylie, K. A. McClellan, N. Ghanem, A. Fortin, S. Callaghan, J. G. MacLaurin, D. S. Park and R. S. Slack, “The Retinoblastoma Family Member p107 Regulates the Rate of Progenitor Commitment to a Neuronal Fate,” Journal of Cell Biology, Vol. 178, No. 1, 2007, pp. 129-139. http://dx.doi.org/10.1083/jcb.200403156
- A. K. Groves, “The Challenge of Hair Cell Regeneration,” Experimental Biology and Medicine, Vol. 235, No. 4, 2010, pp. 434-446. http://dx.doi.org/10.1258/ebm.2009.009281
- B. Fritzsch, K. W. Beisel and L. A. Hansen, “The Molecular Basis of Neurosensory Cell Formation in Ear Development: A Blueprint for Hair Cell and Sensory Neuron Regeneration?” Bioessays, Vol. 28, No. 12, 2006, pp. 1181-1193. http://dx.doi.org/10.1002/bies.20502
- P. Chen and N. Segil, “p27(Kip1) Links Cell Proliferation to Morphogenesis in the Developing Organ of Corti,” Development, Vol. 126, No. 8, 1999, pp. 1581-1590.
- T. Tateya, I. Imayoshi, I. Tateya, J. Ito and R. Kageyama, “Cooperative Functions of Hes/Hey Genes in Auditory Hair Cell and Supporting Cell Development,” Developmental Biology, Vol. 352, No. 2, 2011, pp. 329-340. http://dx.doi.org/10.1016/j.ydbio.2011.01.038
- D. Lyden, A. Z. Young, D. Zagzag, W. Yan, W. Gerald, R. O’Reilly, B. L. Bader, R. O. Hynes, Y. Zhuang, K. Manova and R. Benezra, “Id1 and Id3 Are Required for Neurogenesis, Angiogenesis and Vascularization of Tumour Xenografts,” Nature, Vol. 401, No. 6754, 1999, pp. 670-677. http://dx.doi.org/10.1038/44334
- A. Iavarone, P. Garg, A. Lasorella, J. Hsu and M. A. Israel, “The Helix-Loop-Helix Protein Id-2 Enhances Cell Proliferation and Binds to the Retinoblastoma Protein,” Genes & Development, Vol. 8, No. 11, 1994, pp. 1270- 1284. http://dx.doi.org/10.1101/gad.8.11.1270
- J. L. Rodriguez, J. Sandoval, G. Serviddio, J. Sastre, M. Morante, M. G. Perrelli, M. L. Martinez-Chantar, J. Vina, J. R. Vina, J. M. Mato, M. A. Avila, L. Franco, G. LopezRodas and L. Torres, “Id2 Leaves the Chromatin of the E2F4-p130-Controlled c-myc Promoter during Hepatocyte Priming for Liver Regeneration,” Biochemical Journal, Vol. 398, No. 3, 2006, pp. 431-437. http://dx.doi.org/10.1042/BJ20060380
- S. D. Morgenbesser, B. O. Williams, T. Jacks and R. A. Depinho, “p53-Dependent Apoptosis Produced by Rb-Deficiency in the Developing Mouse Lens,” Nature, Vol. 371, No. 6492, 1994, pp. 72-74. http://dx.doi.org/10.1038/371072a0
- H. Laine, M. Sulg, A. Kirjavainen and U. Pirvola, “Cell Cycle Regulation in the Inner Ear Sensory Epithelia: Role of Cyclin D1 and Cyclin-Dependent Kinase Inhibitors,” Developmental Biology, Vol. 337, No.1, 2010, pp. 134- 146. http://dx.doi.org/10.1016/j.ydbio.2009.10.027
- B. Levkau, H. Koyama, E. W. Raines, B. E. Clurman, B. Herren, K. Orth, J. M. Roberts and R. Ross, “Cleavage of p21Cip1/Waf1 and p27Kip1 Mediates Apoptosis in Endothelial Cells through Activation of Cdk2: Role of a Caspase Cascade,” Molecular Cell, Vol. 1, No. 4, 1998, pp. 553-563. http://dx.doi.org/10.1016/S1097-2765(00)80055-6