Journal of Data Analysis and Information Processing
Vol.2 No.1(2014), Article ID:43377,8 pages DOI:10.4236/jdaip.2014.21005
An Innovative Approach to Mitigate Vehicular Emission through Roadside Greeneries: A Case Study on Arterial Roads of Dhaka City
Department of Urban and Regional Planning, Bangladesh University of Engineering and Technology, Dhaka, Bangladesh
Email: *mnnneema@yahoo.com
Copyright © 2014 Meher Nigar Neema, Jinat Jahan. This is an open access article distributed under the Creative Commons Attribution License, which permits unrestricted use, distribution, and reproduction in any medium, provided the original work is properly cited. In accordance of the Creative Commons Attribution License all Copyrights © 2014 are reserved for SCIRP and the owner of the intellectual property Meher Nigar Neema, Jinat Jahan. All Copyright © 2014 are guarded by law and by SCIRP as a guardian.
Received December 20, 2013; revised January 19, 2014; accepted February 9, 2014
KEYWORDS
Vehicular Emission; Roadside Greeneries; Carbon Dioxide; Emission Mitigation; Healthy and Livable City
ABSTRACT
With the surge of human population, the need for transportation of goods and people also concomitantly increases, resulting in urban air pollution through emission from motorized traffic especially in developing countries. The extent of environmental pollution in an urban setting is significantly influenced by the pollutants of vehicular fuel combustion. Many effective measures are required in cities to sequester carbon thereby helping to reduce automobile pollution. Roadside greeneries can serve as ecological elements which reduce the concentration of pollutants from vehicular emissions by their direct involvement in absorbing vehicular emitted carbon. In this context, in this study an attempt has been taken to assess contribution of roadside greeneries in absorbing vehicular carbon dioxide emission. A case study has been conducted on arterial roads of mega city Dhaka to quantify the vehicular carbon emission and correlate it with roadside trees to absorb the emitted carbon dioxide. It is noted that in Dhaka city, carbon dioxide is accounted for more than ninety percent of air pollution. To achieve our goals, two busiest arterial roads (namely Mirpur Road and Rokeya Shoroni Road) were taken into account to quantify vehicular carbon emission as well as assess carbon absorption by roadside greeneries. Carbon absorption by different sizes of trees has been quantified using the amount of woody biomass. In addition, absorption by grass-shrubs-herbs has been quantified by the area they cover. The results thus obtained show that indeed the road with more side greeneries absorbs more vehicular emitted carbon dioxide. It is therefore evident that plantation of more roadside trees is an effective measure of reducing air pollution and consequently turning a city to become healthier and more suitable for living.
1. Introduction
The need for the transportation of people and goods increased with the increase of human population thus correspondingly increasing traffic volumes. Though the vehicular emission control technology improved, but due to rapid growth of vehicular ownership and increased average trip length, unhealthy air quality in urbanized areas has been created. In Dhaka city, the apparently achieved environmental benefit due to conversion of vehicles to Compressed Natural Gas (CNG) from petrol/diesel is getting minimized [1]. In 2012, a London-based weekly “The Economist” has announced Dhaka as the second worst city with an air pollution scenario through vehicular emission despite changeover to CNG driven vehicles [2]. Because of vigorous growth of cars, introduction of unpermitted older diesel-driven fleet of buses and minibuses, the pollution level has increased again [1] & [3]. Diesel run trucks are the major polluters in the city at night time [3]. The environmental benefit for introduction of CNG shall be nullified by 2018 [1]. In an urban setting, most of the pollution is directly produced because of high traffic and house-heating [4]. Traffic emissions are known to be responsible for a considerable share of urban air pollution, such as Nitrogen dioxide (NO2), Carbon dioxide (CO2) [5]. In Dhaka city, the major air pollutant CO2 is accounted for more than 90 percent of air pollution. About 80 percent of people are suffering from air pollution related diseases whereas this rate is only 18 percent in the rural areas [6]. The life of these city people is at hazard due to this air pollution caused by vehicular emission. The concentration of surrounding pollution is influenced by the pollutants of vehicular emission [7,8]. The air pollution concentrations are dependent on the formation and destruction of pollutants through chemical and physical reactions, the intensity and duration of emissions, the absorption of pollutants by urban vegetation, and meteorological factors [9-11]. It has been reported that vegetation buffers along roads reduce the concentration of pollutants from vehicular emissions and also reduce noise pollution in nearby lands [12]. Roadside trees are important ecological elements of cities as they sequester carbon and help to reduce automobile pollution [13]. Urban trees are good friends to prevent or reduce the increase of CO2 atmospheric concentration [4]. Trees remove carbon from the atmosphere through photosynthesis by extracting carbon dioxide from the air, separating the carbon atom from the oxygen atoms, and returning oxygen to the atmosphere. By doing this, trees store a great amount of carbon in their structures [14]. Some researchers have studied on vehicular emissions and air pollution throughout the world [3,6,15,16]. In a research, Li and Lan have made an assessment that the nearer the park location is to the traffic environment, the higher is the absorption of Pb, Cd, and S [17]. However, no systematic study has been conducted yet to qualitatively and quantitatively assess the extent of mitigation level of vehicular emission through roadside greeneries.
In this context, an attempt has been made to conduct a quantitative study to assess the extent of vehicular emission mitigation by the existing roadside greeneries. The present study has been undertaken for particular road sections of two arterial roads of Dhaka city. The road section from Technical Morh (crossing) to Shyamoli Square signal of Mirpur Road and Rokeya Shoroni has been considered for the study (Figure 1). They are the major arterial roads and the busiest roads in Dhaka which contribute a lot of vehicular pollution to the air. For this study, among all other types of vehicular emitted pollutant, only CO2 has been considered for detailed analysis. This study quantifies both the vehicular emission from this road’s passing vehicles and the mitigation of that emission by the roadside trees. Finally, this study compares the emission rate and mitigation rate and shows whether roadside trees are adequate to mitigate the total pollution generated from vehicles. The implication of the research from planning aspect is that, it can help policy makers and planners to plan for more optimized urban greeneries thus leading to a quality urban environment.
2. Existing Condition of Greeneries and Vehicular Pollution in Dhaka City
2.1. Greeneries in Dhaka City
The Dhaka city corporation area covers 300.97 sq. km. with a population of 9,254,473 in 2011 [18]. Dhaka is an expanding city with an average increase rate of 4.24% per year and by the year 2020 it would be the third largest megacity in the world [19]. Between 1990 and 2005, the city population doubled from 6 to 12 million and Dhaka extended fast between 1960 and 2005 [20-23]. The UN predicts this city will be a home to more than 20 million people by 2025 [20]. The pressure of ever increasing population in Dhaka city has put immense force in land use trend and many open spaces and vegetation areas have been grabbed by various housing areas [24]. Such rapid depletion of vegetation coverage in recent decades might result adverse environmental condition in Dhaka and its surrounding areas. Vegetation coverage is one of the most important factors for sustaining life and the living environment for rapid growing cities, like Dhaka [25]. When the scenario of overall vegetation coverage of city indicates rapid degradation then it can be easily assumed the condition of roadside green is very poor. Most of the roads of Dhaka city do not have defined area for tree plantation. Trees in the roads, paved paths in commercial and residential areas vary from place to place within the city. Highly busy areas are mostly treeless. But newly developed planned residential area or commercial premises are greener than the other parts of city [26]. Some tree plantation program focuses on planting shrubs and ornamental small trees on median. More over with rapid growth of the city, there is no space along the road side for planting trees. Most of the trees are located within the boundary of adjacent land. Large size trees are rarely visible in roads of Dhaka (Figure 2). According to Nowak and Heisler 2010, large, long lived and evergreen healthy tree can improve the air quality in any kind of urban area [27]. The large and healthy trees can remove 60 to 70 times more air pollutant than small trees because of their proportionately greater leaf surface area [4]. The green resources in Dhaka are besieged by a number of limitations like exceptional mode of urban development, rapid increase of urban population, transformation of green and open spaces into other types of land use, lack of proper planning, implementation and management restrictions as well [26].
2.2. Vehicular Pollution in Dhaka City
The air quality of Dhaka is deteriorating due to activities
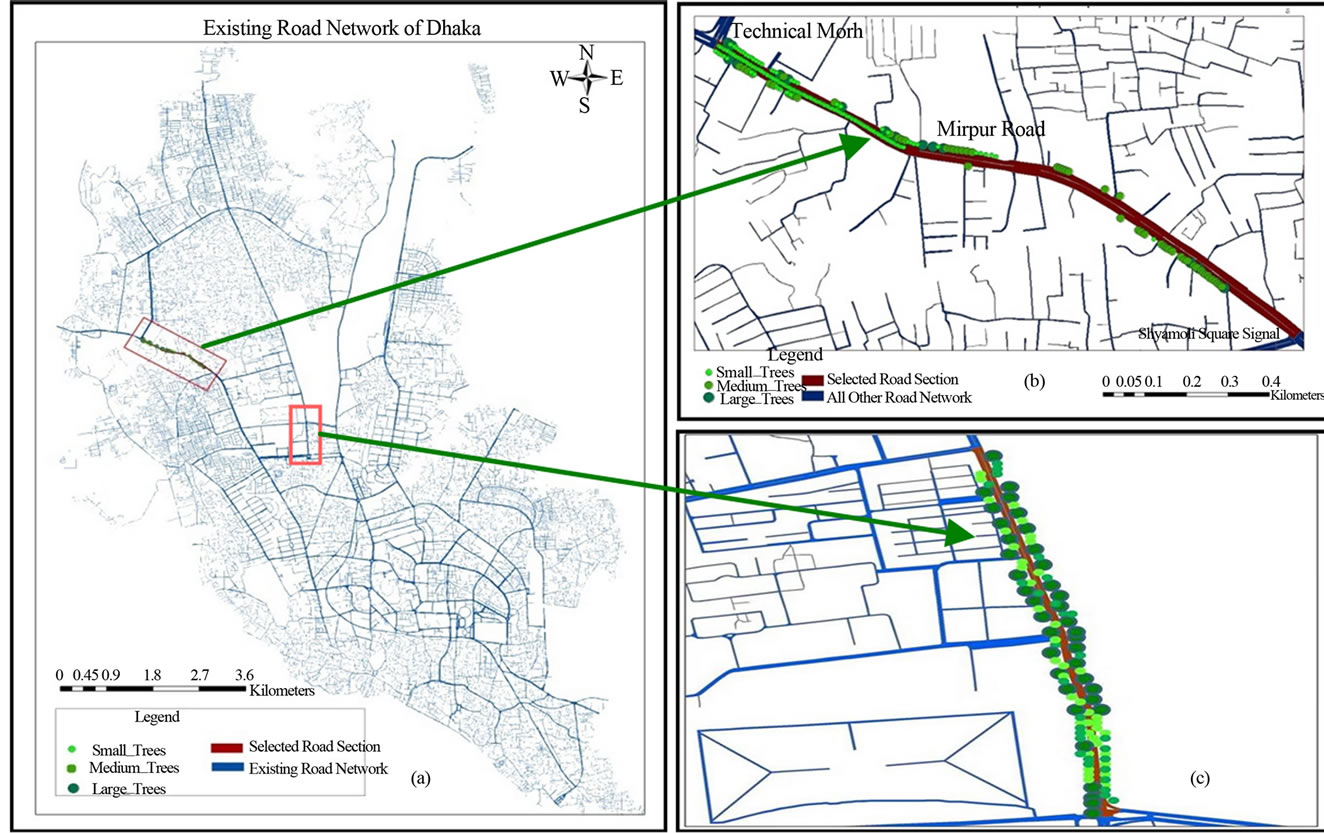
Figure 1. (a) Existing road network of Dhaka; (b) Mirpur Road; and (c) Rokeya Shoroni.
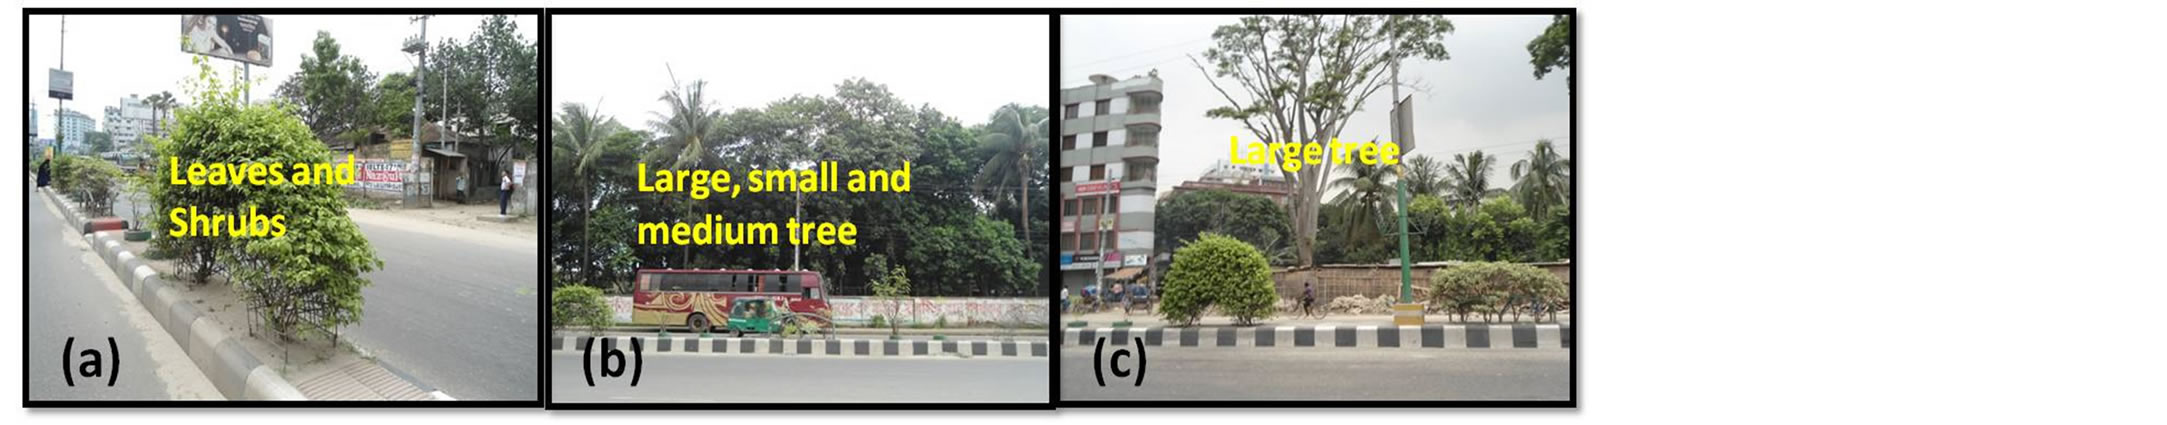
Figure 2. (a) Leaves and shrubs on the median of the selected road sections; (b) Large, medium and small trees along the selected road sections within adjacent property line; and (c) A large tree beside the selected road sections.
such as growth of settlements, industries, brickfields, motor vehicles etc. Uncontrolled motor vehicles emissions give rise to pollution. In a small area, high levels of emission of air pollutants exceed the rate of pollutant dilution and dispersal process. In the city poor maintenance together with poor fuel quality, congestion and poor transport infrastructure worsen the vehicular air pollution. The gasoline driven vehicles contribute more to oxides of carbon and hydro carbon pollution. A study show that in 2004 that about 66.5% CO was emitted by cars, 37.5% NOx and 38.8% SO2 by diesel driven buses in Dhaka [28].
3. Method and Calculation Process
To perform this study, traffic volume survey was conducted. Peak hour traffic volume survey was carried out from Technical crossing to Shyamoli Square Signal of Mirpur Road and for Rokeya Shoroni Road. The Peak hour in Dhaka city started from 8:00 am in the morning and continues till 10:00 am which include office and school hours. Different types of vehicles run on different fuel type. The commonly used fuels for vehicles are petrol, diesel and Compressed Natural Gas (CNG). The fuel types of vehicles were enlisted in the checklist by asking the vehicle drivers. Information on greeneries along both road sides and median was noted from field observation. Road side greeneries include trees of different sizes, shrubs, herbs and grass. Trees were categorized into small, medium and large sizes based on the measurements given in [29]. In the research, scientists classified the size of trees by diameter at breast height (DBH), i.e., measuring tree diameter 4.5 feet (1.37 m) above the ground. Sizes of trees based on DBH are presented in Table 1. Diameter of trees have been measured during field survey and noted in the checklist. Number of different sizes of trees along particular roads has also been noted in that checklist. The area of footpath, roadside wall or median covered by grass, shrubs and herbs at particular sections of selected roads have been measured and noted in checklist. After collection of data from primary source through checklist survey, data has been processed through qualitative and quantitative techniques. Traffic volume survey data, information of roadside greeneries for particular road sections have been recorded and processed in ArcGIS 10 interface.
4. Results and Discussions
4.1. Vehicular Emission
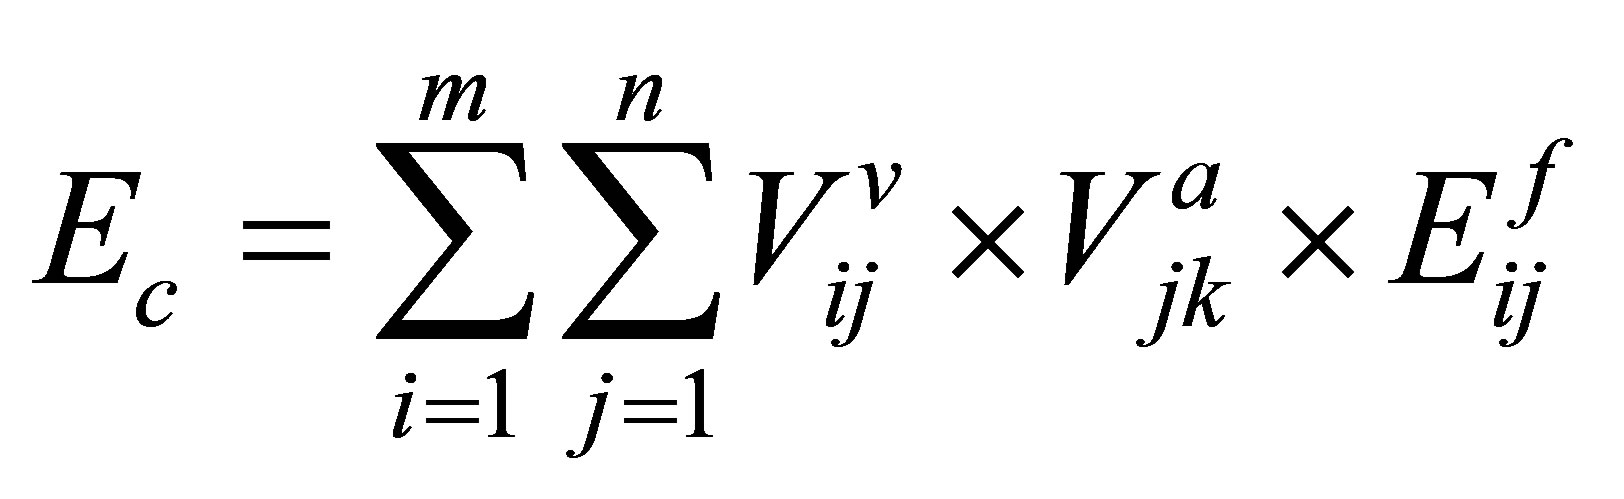
From the traffic volume it has been observed Compressed Natural Gas (CNG) driven cars share the highest of total traffic volume. This number is followed by the CNG driven buses. Figure 3(a) shows the feature of traffic volume in the selected road sections. The volume of cars is the highest number. Traffic volume is higher in Mirpur Road than the Rokeya Shoroni Road. Total emission of carbon dioxide by a specific type of vehicle can be derived by multiplying the emission factor with the number of that type of vehicle derived from volume survey and the vehicle kilometer traveled for that particular mode. Vehicular emission of particular road section has been determined using traffic volume plying on that road section. To calculate the total vehicular emission using traffic volume from a road, Equation (1) was used. Total vehicular carbon emission [30]
 (1)
(1)
where, Vv is the volume of vehicles, Va is the activity of vehicles per day or vehicle kilometers travelled (VKT) per day, Ef is the emission factors, i, j, m and n denotes vehicle types, fuel types, the number of vehicle types and the number of fuel types respectively. To view the vehi-
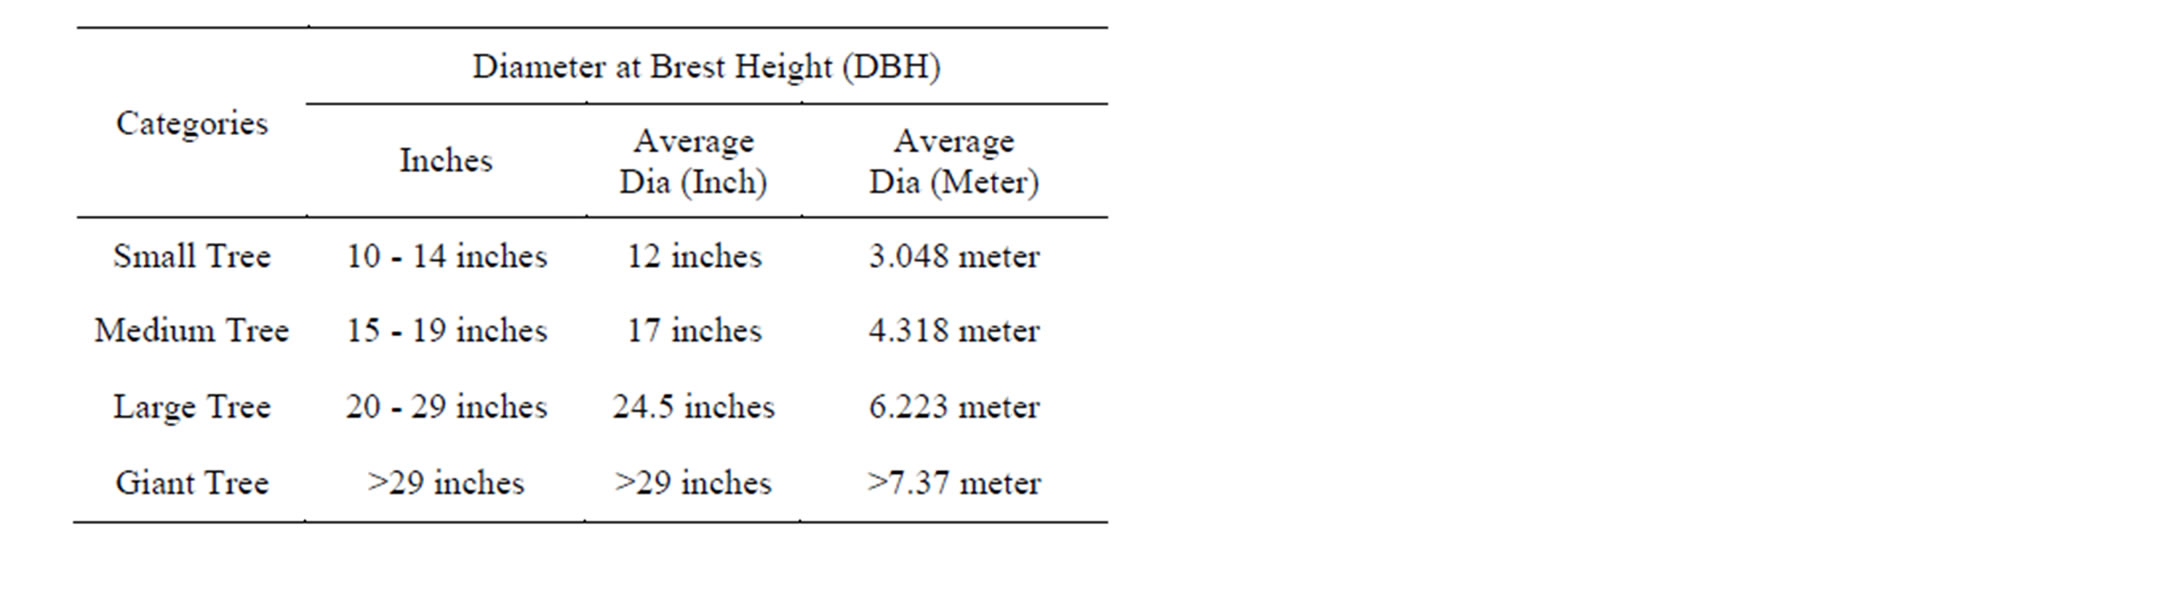
Table 1. Sizes of trees based on Diameter at Breast Height (DBH) [29].
cular volume and emission of carbon from them together a vehicle emission matrix (Table 2) has been developed. It provides a view of the condition of carbon dioxide emission by different types of vehicles driven by different types of fuels. About 25.65125546 tons of carbon dioxide is being emitted during peak hour in the selected section of Mirpur road and 19.04256876472 is being emitted during peak hour in Rokeya Shoroni Road. The output of the calculations shows that largest amount of carbon dioxide emitted from CNG driven buses in both of the roads. The amount is large because the daily activity i.e. Vehicle Kilometers Travelled by these buses are the highest (275.68 km/day) because their coverage is of long distance and they make multiple travels daily. This amount of emission is followed by diesel driven buses. Amount of emitted carbon dioxide by different types of vehicle run with different types of fuel has been shown in Figure 3(c) and (d).
4.2. Emission Mitigation by Roadside Greeneries
Roadside trees are in the close proximity to the source of such vehicular emissions. They absorb and serve as an important component in reducing such vehicle emitted carbon [13]. Along the selected road section there are large, medium and small trees. Most of the trees are located within the boundary of adjacent property. Number of trees is higher in Rokeya Shoroni than in Mirpur Road. Along the selected road section of Mirpur Road, there are 147 small trees, 54 medium trees and 15 large trees of different species. On the other hand, there are 546 small trees, 156 medium trees and 103 large trees of different species along the Rokeya Shoroni Road. Most importantly 3 giant sized trees are also located along this road. It has been depicted in Figure 3(b).
Carbon sequestration by trees has been calculated using their basal area and standing woody biomass. Tree Basal Area (ba) is the cross-sectional area (over the bark) at breast height (1.3 metres or 4.5 feet above the ground) measured in square metres (m2). Tree basal area can be also be used to estimate tree volumes [31]. Biomass is the total mass of living plant organic material, and it is proportional to volume and basal area at the stand level, and diameter and height at the individual plant level [32]. The Equations (2)-(5) [13] used for estimating carbon mitigation by trees.
Basal area (m2) of tree
 (2)
(2)
Standing woody biomass (ton/ha)
 (3)
(3)
Carbon sequestration
Figure 3. (a) Number of different types of vehicles in Mipur Road and Rokeya Shoroni Road; (b) Number of different sizes of trees in Mirpur Road and Rokeya Shoroni; (c) Amount of vehicle emitted CO2 in Mirpur Road; and (d) Amount of vehicle emitted CO2 in Rokeya Shoroni Road.
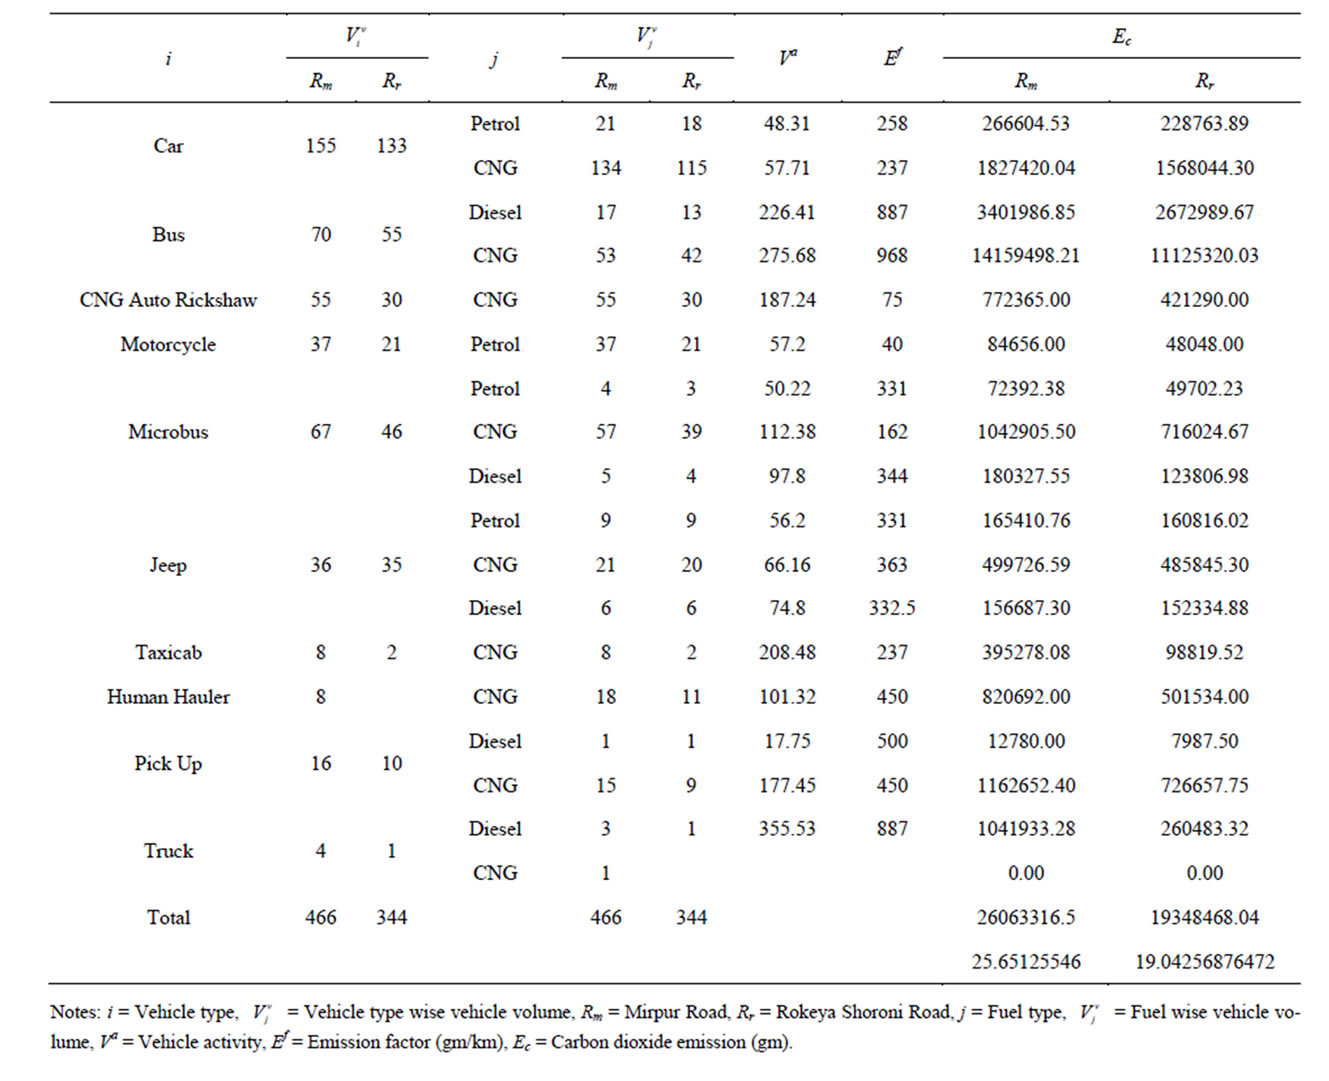
Table 2. Vehicle emission matrix for section of Mirpur Road and Rokeya Shoroni Road.
 (4)
(4)
And for carbon mitigation by roadside grass/leaves/ shrubs/herbs, following formula was used:
Carbon mitigation by grass/shrubs/herbs
 (5)
(5)
where, Ec stands for carbon emission (ton), Ga stands for area covered by grass, leaves, shrubs, herbs,  stands for carbon mitigation by grass and GBH stands for Girth at Breast Height. The total amount of carbon mitigation by roadside trees and grass, shrubs, herbs were then converted into ton/km. For instance, in the selected section of Mirpur Road, 15 large trees have been found with an average GBH of 6.223 meter. Total basal area of large trees in the selected road section is 4502.81 sq. meter. The standing woody biomass has been calculated. Carbon sequestrated by these trees has been calculated in ton/ha unit. For comparing it with the per kilometer vehicular emissions the unit is then converted into ton/km by dividing the ton/ha unit with road width. The average width of selected road is about 30 meters. Total carbon sequestered by large trees in the selected road section is 0.000516 ton/km. Similar calculation has been done for medium and small sized trees of the road. On the other hand carbon sequestration by the shrubs, herbs over the median has been calculated following the equation for carbon sequestration by grass, shrubs and herbs. Per ha grass, shrubs, herbs can mitigate 1 ha CO2. To convert the unit from ton/ha it has been divided by the width of median to obtain ton/km unit. In the particular section the features of roadside tree and grass, shrubs, herbs are presented in Table 3.
Trees and shrubs along Mirpur Road can mitigate only 0.00262899357113933 ton/km CO2, where as the total vehicular emission of CO2 along this road is 25.65125546
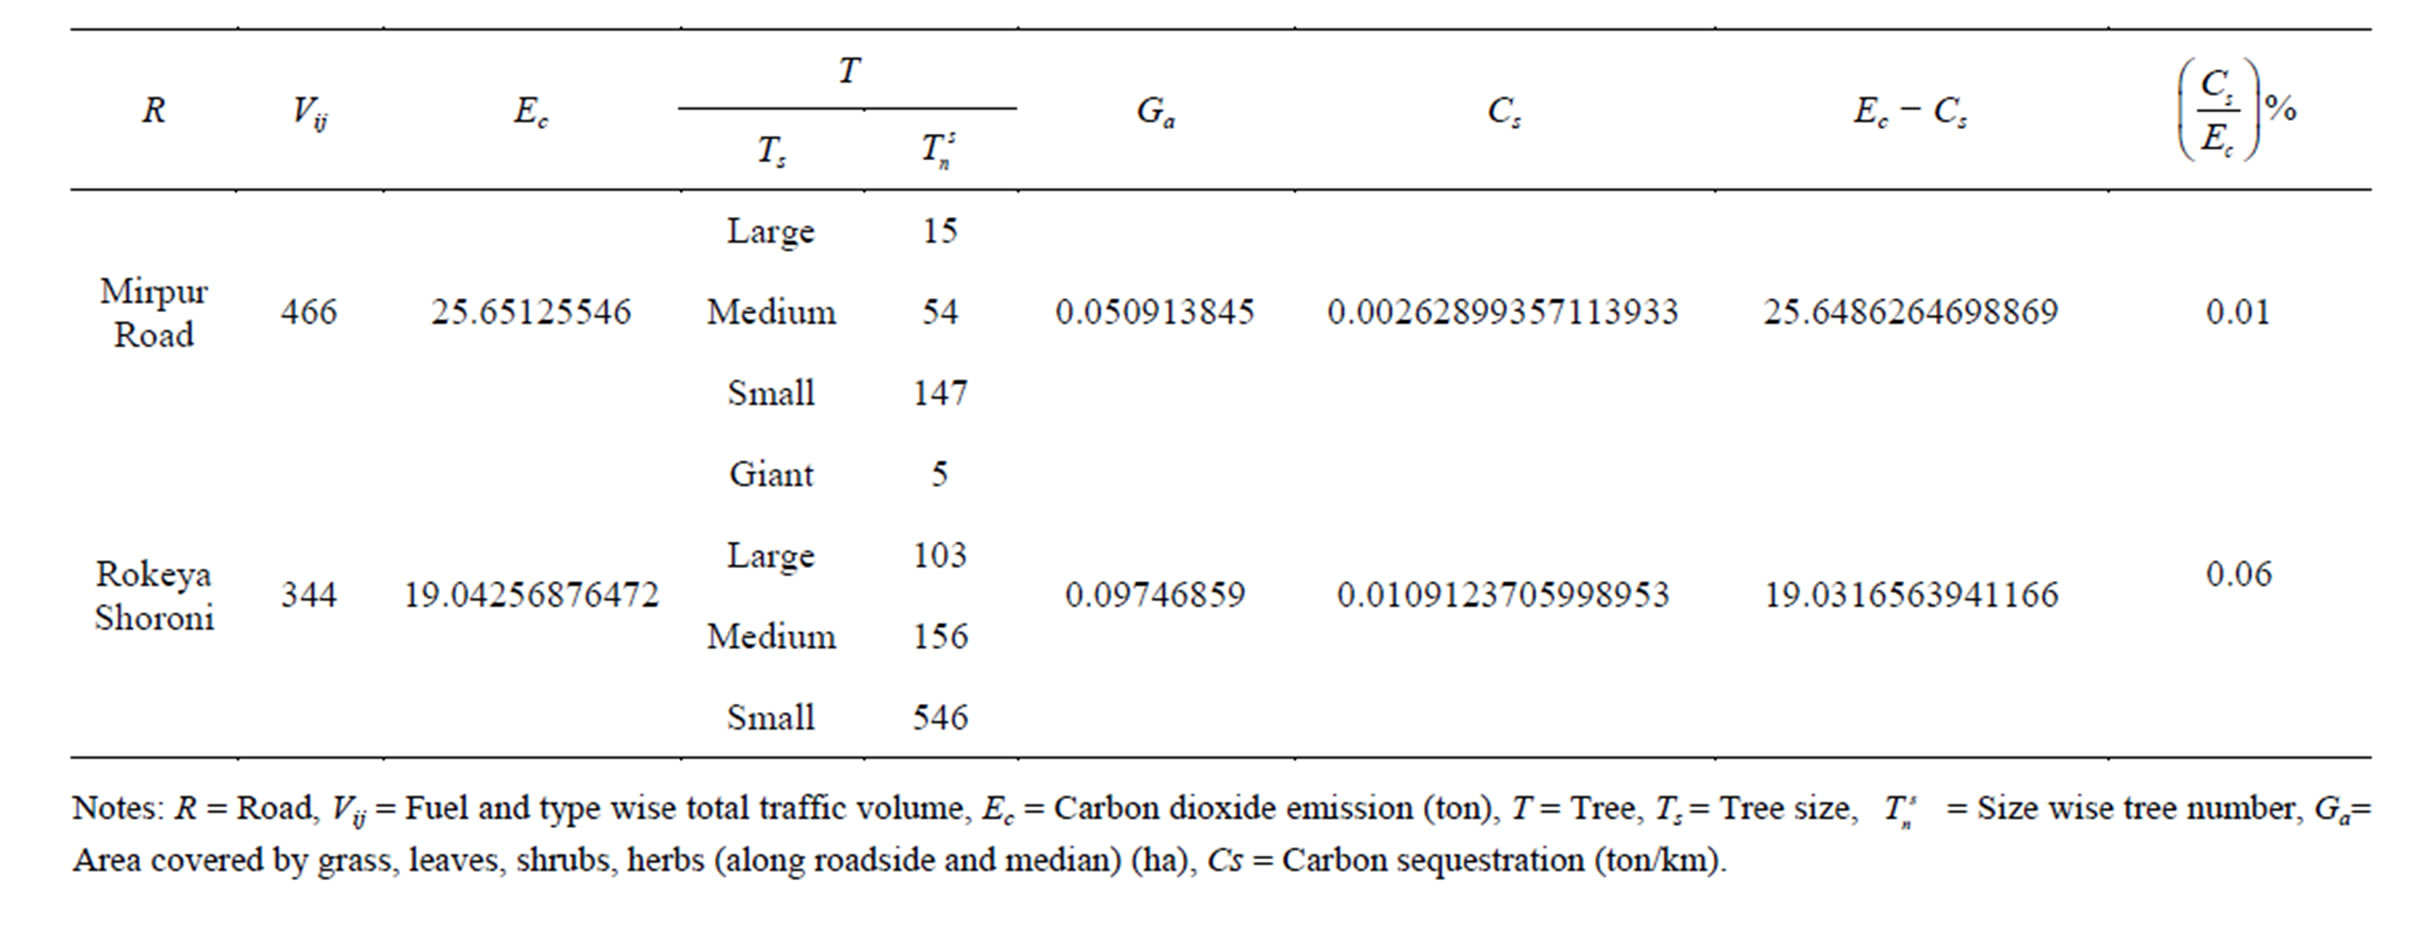
Table 3. Carbon absorption by roadside greeneries along Mirpur Road and Rokeya Shoroni.
ton. Only 0.01% of vehicle emitted carbon is being mitigated by the roadside trees. On the other hand, Rokeya Shoroni Road with large number of trees and high coverage of greeneries can mitigate 0.0109123705998953 ton/km CO2 which is higher than in Mirpur Road. And vehicle emitted CO2 along this road is 19.04256876472 ton which is less than that in Mirpur Road because of lower traffic volume. About 0.06% of vehicle emitted carbon is being mitigated by road side greeneries along Rokeya Shoroni Road. The comparison of CO2 emission by vehicles and mitigation by trees along the selected major roads indicates that carbon mitigation amount is almost negligible with respect to vehicular CO2 emission. Most importantly, the amount of vehicle emitted CO2 mitigation is higher in Rokeya Shoroni Road than that in the Mirpur Road because of presence of higher number of trees and vegetation areas covered along the Rokeya Shoroni Road. It is therefore evident that existence of more roadside trees is an effective measure of reducing air pollution and consequently turning a city to become healthier and more suitable for living.
The major findings of the study are summarized below:
1) Total traffic volume of Mirpur Road is 466 and Rokeya Shoroni Road is 344 vehicles.
2) This volume of traffic emits about 25.65125546 ton CO2 in Mirpur Road and is 19.04256876472 ton CO2 in Rokeya Shoroni Road. Highest amount of carbon is being emitted by CNG driven buses. The amount is large because the vehicle kilometers travelled by these buses is the highest (275.68 km/day).
3) In the selected section of Mirpur Road there are 15 large trees, 54 medium trees and 147 small trees. The area covered by shrubs, herbs, and grass on median of selected road section is about 0.05 hacter. Along Rokeya Shoroni Road there are 103 large trees, 156 medium trees and 546 small trees. Special feature of this road is that there are 3 Giant trees. The area covered by shrubs, herbs, and grass on median of selected road section is about 0.097 hacter.
4) Total Carbon mitigation by vegetation is 0.00262899357113933 ton/km along Mirpur Road and 0.0109123705998953 ton/km CO2 along Rokeya Shoroni Road. The difference between total carbon dioxide emission by vehicles and total carbon mitigation by roadside vegetation is about 25.6486264698869 in Mirpur Road and 19.0316563941166 in Rokeya Shoroni Road.
5) Existing roadside vegetation can absorb only 0.01% and 0.06% of vehicle emitted carbon in Mirpur Road and Rokeya Shoroni Road respectively.
5. Concluding Remarks
To ensure better urban air quality and to reduce the effect of vehicular emitted carbon, increasing tree plantation activities need to be promoted along the roads of Dhaka. On the other hand, it is important to reduce the fossil fuel emission to prevent larger carbon storage scope in urban air. Moreover traffic volume can be reduced applying many regulations. In Dhaka city, there is a need to increase roadside plantation to retrieve the effect of vehicular emitted carbon.
REFERENCES
- S. H. Tanim, T. A. U. Sadik and R. Rahman, “A Comparative Study between CNG and Petrol/Diesel Driven Vehicles of Dhaka,” Undergraduate Thesis, Bangladesh University of Engineering and Technology, Dhaka, 2011.
- S. Khan, “Arresting Decline of a Worst Livable City,” The Financial Express, Bangladesh, 2012.
- M. M. Rana, A. Mahmood and R. K. Saha, “Quarterly Report on Vehicular Emission Testing,” Clean Air & Sustainable Environment Project, Department of Environment, Dhaka, 2011.
- E. G. McPherson, “Benefit-Based Tree Valuation,” Arboriculture & Urban Forestry, Vol. 33, No. 1, 2007, pp. 1- 11.
- Y. Kim and S. Lee, “GIS Based Urban Air Quality Model: The Case of NO2,” 12th WTCR, Lisbon, 11-15 July 2010.
- A. S. Haq, “Estimation of Vehicle Induced Emissions of Selected Urban Areas in Dhaka City,” Proceedings of the International Conference on Mechanical Engineering 2009 (ICME2009), Dhaka, 26-28 December 2009.
- R. G. Derwent and O. Hertel, “Transformation of Air Pollutants,” In: J. Fenger, O. Hertel and F. Palmgren, Eds., Urban Air Pollution: European Aspects, Kluwer Academic Publishers, Dordrecht, Boston, 1998, pp. 137-159. http://dx.doi.org/10.1007/978-94-015-9080-8_8
- R. M. Harrison, “Pollution: Causes, Effects and Control,” 4th Edition, Royal Society of Chemistry, Cambridge, 2001. http://dx.doi.org/10.1039/9781847551719
- J. H. Seinfeld and S. N. Pandis, “Atmospheric Chemistry and Physics: From Air Pollution to Climate Change,” 2nd Edition, John Wiley & Sons, Inc., New York, 2006.
- M. Takahashi, A. Higaki, M. Nohno, M. Kamada, Y. Okamura and K. Matsui, “Differential Assimilation of Nitrogen Dioxide by 70 Taxa of Roadside Trees at an Urban Pollution Level,” Chemosphere, Vol. 61, No. 5, 2005, pp. 633-639. http://dx.doi.org/10.1016/j.chemosphere.2005.03.033
- World Health Organization, “WHO Air Quality Guidelines for Particulate Matter, Ozone, Nitrogen Dioxide and Sulfur Dioxide, Global Update 2005, Summary of Risk Assessment,” WHO Press, Geneva, 2006.
- T. Trammel and T. Sluss, “The Importance of Roadside Vegetation and the Need for a Vegetation Management Plan in the Commonwealth of Kentucky,” Kentucky Conservation Committee, 2013.
- G. S. Kiran and S. Kinnary, “Carbon Sequestration by Urban Trees on Roadsides of Vadodara City,” International Journal of Engineering Science and Technology, Vol. 3, No. 4, 2011, pp. 3066-3070.
- F. Ferrini and A. Finni, “Sustainable Management Techniques for Trees in the Urban Areas,” Journal of Biodiversity and Ecological Sciences, Vol. 1, No. 1, 2011.
- T. Afrin, M. A. Ali, S. M. Rahman and Z. Wadud, “Development of a Grid-Based Emission Inventory and a Source-Receptor Model for Dhaka City,” The US EPA’s International Emissions Inventory Conference, Hyatt Regency in Tampa, Florida, 2012.
- S. Randall, B. Sivertsen, N. Uddin, S. Biswas, P. Schneider, V. T. Dam, G. Saroar and M. Rana, “Ambient Air Pollution Screening Study in Dhaka,” Bangladesh Air Pollution Management (BAPMAN) Project, 2011.
- H. E. Li, B. T. Li and S. F. Lan, “Responses of the Urban Roadside Trees to Traffic Environment,” International Journal of Environmental Technology and Management, Vol. 12, No. 1, 2010, pp. 16-26. http://dx.doi.org/10.1504/IJETM.2010.029958
- “Greater Dhaka Area,” 2013. http://en.wikipedia.org/wiki/Greater_Dhaka_Area
- World Bank, “Dhaka, Improving Living Conditions for the Urban Poor,” The World Bank Office, Dhaka, 2007.
- E. German and S. Pyne, “Dhaka: Fastest Growing Megacity in the World,” 2010. http://www.globalpost.com/dispatch/asia/100831/bangladesh-megacities-part-one
- M. A. Taleb, “Comparative Study of Urban Area Extension and Flood Risk in Dhaka City of Bangladesh,” Global Journal of Human Social Science, Geography & Environmental GeoSciences, Vol. 12, No. 11, 2012, pp. 37-40.
- A. M. Chowdhury and S. Faruqui, “Physical Growth of Dhaka City,” In: S. U. Ahmed, Ed., Dhaka, Past, Present and Future, The Asiatic Society of Bangladesh, Dhaka, 1989, pp. 43-61.
- N. Islam, “Dhaka from City to Megacity: Perspectives on People, Places, Planning and Development Issues,” Urban Studies Program, Dhaka, 1996.
- M. S. I. Bhuiyan, “Reduction of Open Space in Urban Planning: A Case Study of Osmani Udyan,” Thesis, BRAC University, Dhaka, 2011.
- A. A. Mamun, A. Mahmood and M. Rahman, “Identification and Monitoring the Change of Land Use Pattern Using Remote Sensing and GIS: A Case Study of Dhaka City,” IOSR Journal of Mechanical and Civil Engineering (IOSR-JMCE), Vol. 6, No. 2, 2013, pp. 20-28.
- M. Rahman, “Preserving Green Spaces in Dhaka City,” The Daily Star, Dhaka, 2009.
- M. N. A. Ansari, “Opportunities and Challenges of Urban and Peri-Urban Forestry and Greening in Bangladesh: Dhaka City as a Case,” Master Thesis, Swedish University of Agricultural Sciences (SLU), Alnarp, 2008.
- D. J. Nowak and G. M. Heisler, “Air Quality Effects of Urban Trees and Parks,” Research Series, National Recreation and Park Association, 2010.
- A. Nahian, “Degraded Ecological Environment of Dhaka City and Its Management,” Educarnival Pedia, 2012.
- Ecoplexity: Teaching Ecological Complexity, “Protocol: Measuring Tree Diameter, Class Size, and Average Species Diameter,” 2013. http://ecoplexity.org/node/236?page=0,0
- Z. Wadud and T. Khan, “CNG Conversion of Motor Vehicle in Dhaka: Valuation of Co-Benefits,” TRB Annual Meeting, 2011. http://docs.trb.org/prp/11-2764.pdf
- “Tree Basal Area,” 2013. http://www.farmforestline.com/pages/6.3_tree_basal.html
- S. Magnussen, “Modeling for Estimation and Monitoring,” National Forest Assessment, 2004.
NOTES
*Corresponding author.