International Journal of Geosciences
Vol.5 No.5(2014), Article ID:45490,13 pages DOI:10.4236/ijg.2014.55049
Morphometric Analysis of Drainage Basins in the Western Arabian Peninsula Using Multivariate Statistics
Ali P. Yunus1, Takashi Oguchi1,2, Yuichi S. Hayakawa2,3*
1Department of Natural Environmental Studies, Graduate School of Frontier Sciences, The University of Tokyo, Kashiwanoha, Kashiwa, Japan
2Center for Spatial Information Science, The University of Tokyo, Kashiwanoha, Kashiwa, Japan
3Department of Socio-Cultural Environmental Studies, Graduate School of Frontier Sciences, The University of Tokyo, Kashiwanoha, Kashiwa, Japan
Email: yunusp@csis.u-tokyo.ac.jp, oguchi@csis.u-tokyo.ac.jp, *hayakawa@csis.u-tokyo.ac.jp
Copyright © 2014 by authors and Scientific Research Publishing Inc.
This work is licensed under the Creative Commons Attribution International License (CC BY).
http://creativecommons.org/licenses/by/4.0/


Received 10 February 2014; revised 8 March 2014; accepted 7 April 2014
ABSTRACT
The uplift of the Arabian Shield and the opening of the Red Sea led to the development of steep drainage systems in the Western Arabian Peninsula. Although the Peninsula has been studied from a geological perspective, in relation to oil production, plate tectonics and eolian systems such as sand dunes, the steep mountainous drainage basins have received much less attention. This paper aims to assess the characteristics and development of 36 drainage basins in the Western Arabian Peninsula, using a digital elevation model (DEM), principal component analysis (PCA), and hierarchical cluster analysis (CA). Three major principal components (PC1 to PC3) are found to explain 73% of total variance. CA divided the basins into two or four groups. The division by CA strongly reflects PC1, showing that the two analyses give comparable results. PC1 strongly reflects basin dimensions and drainage texture, and their positive correlations indicate the significant effect of basin relief and slope on mass wasting and limited stream incision in small basins under an arid climate. PC2 mainly reflects the effect of bedrock geology, suggesting that volcanic rocks tend to produce more elongated and less eroded immature basins than crystalline rocks do. PC3 mainly reflects the basin relief and slope and the length of each stream segment, which may also reflect the effect of mass wasting on stream development.
Keywords:Arabian Peninsula, Drainage Basin, Digital Elevation Model, Morphometry, Principal Component Analysis, Cluster Analysis

1. Introduction
The Arabian Peninsula has a very long geological history, extending back to the Precambrian. The Tertiary Red Sea-Gulf of the Suez rift system is a prime example of active continental rifting and breakup [1] [2] . The rift underwent uplift and mountain building in the Western Arabian Peninsula, and the resultant mountains have been subject to erosion to form steep drainage basins. The peninsula has been much studied from the point of view of petroleum geology [3] [4] , geological structures [5] [6] , eolian landforms [7] [8] and plate tectonics [9] [10] . However, the geomorphologies of the steep drainage basins in the peninsula and the fluvial processes active there have received much less attention, to date [11] . Geomorphological studies in the region have mostly been carried out by petroleum geologists whose main interest is not the geomorphology itself [12] . Although some researchers, such as Al-Sayari and Zötl [13] , Davison et al. [14] , Sen [15] , and Subyani et al. [16] , have studied the regional geomorphology and hydrogeology of the Arabian Peninsula, a full scientific understanding of landforms there is still lacking.
Quantitative morphometric analysis of drainage basins was begun in the middle of the 20th century, based on manual analyses of printed topographic maps [17] -[21] . The advent of geographic information systems (GIS) allowed the digital extraction of morphometric parameters from digital elevation models (DEMs), for the quantitative characterization of landforms [22] [23] . Such geomorphic analyses are conducted using geomorphometric indices. For example, the hypsometric integral (HI) of various river basins has been analyzed and linked to lithological resistance and tectonic uplift [24] [25] . Various morphometric parameters can be derived from drainage basins, and as such it is often difficult to ascertain which are the most effective for geomorphological reasoning. Statistical analysis aids in reducing this complexity in drainage basin research [26] [27] , using a wide variety of pattern recognition operations, such as factor analysis, principal component analysis, cluster analysis, and discriminant analysis [28] . A systematic classification of large rivers based on their hydrosedimentary components was successfully conducted using multivariate statistics [29] [30] ; however, such studies on steep river basins have thus far been limited. Although Subyani et al. [16] applied multivariate techniques to the geomorphology of steep basins in the Arabian Peninsula, they investigated only ten basins, which places a limit on the statistical significance of the work. In addition, their paper is predominantly technical, with limited discussion regarding the geomorphological implications of the results.
In this paper, we present geomorphological quantification of comparisons between 36 basins in the mountainous terrain of the Western Arabian Peninsula. We examine 21 DEM-derived morphometric parameters, and conduct multivariate statistical analyses to classify the basins and discuss the potential factors affecting drainage-basin form and development. We also examine the influence of bedrock geology on various landforms.
2. Study Area
The study area, comprising the Western Arabian Peninsula, corresponds to the western part of the Arabian Plate. The plate has undergone a series of uplift events since the Mesozoic, with episodes of rotational tectonic movement, collision and subduction [10] . The northern part of the plate has been moving in a northwest direction at a rate of approximately 20 mm/yr, whereas the southern part is moving more slowly and is subject to weak to moderate seismic activities [11] . The Arabian Peninsula consists of Precambrian basement overlain by Tertiary and older volcanics to the west, and marine and continental sediments to the east [31] . The Arabian shield is a region of Precambrian-age metamorphosed sedimentary and volcanic rocks intruded by younger granites and gneisses [11] , and which has been divided into various major tectonostratigraphic terrains, suture zones, fault zones and post accretionary basins [5] [6] . The 36 drainage basins chosen for this study are major basins, each with an area of more than 500 km2; they are located in the Midyan, Hijaz and Asir terrains within the shield, and within an area of Tertiary volcanics in the Yemen region (Figure 1). Around 75% of the basins are located in the shield. All basins drain toward the west or southwest, except for the southernmost basin (#1), which drains toward the south. The maximum altitude of the study area is 3658 m in basin #4. The steep topography of the basins reflects the uplift that has occurred along the Red Sea. For comparison, the ten basins studied by Subyani et al. [16] are located in the Hijaz and Jeddah terrains.
From north to south, the Arabian Peninsula exhibits relatively large climatic variations in terms of temperature, but is consistently arid, except in the southwest. The annual average rainfall for Saudi Arabia is 93.5 mm [32] and that for Yemen is 492 mm [33] . Thus, the basins studied here have only intermittent water flow, which is mostly restricted to the periods during and directly after occasional heavy precipitation events.
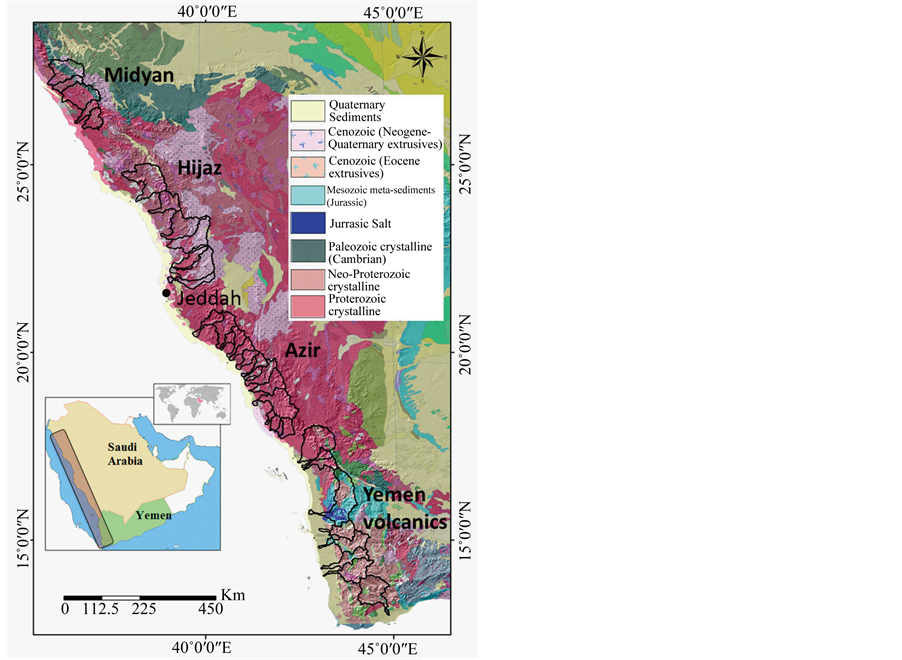
Figure 1. Location of the study area and outline of the 36 basins studied here. Basins are numbered sequentially from 1 in the south to 36 in the north of the study area. A geological map is underlain as background image (1:5,000,000 International Geological Map of the Middle East). Major lithological types that fall within the study area are shown in the legend.
3. Materials and Methods
With the free availability of the digital elevation models (DEMs) from the Shuttle Radar Topographic Mission (SRTM) and the Advanced Spaceborne Thermal Emission and Reflection Radiometer (ASTER), cost effective solutions for morphological studies including watershed delineation and stream network parameter extraction can now be performed using automated procedures. Although both the SRTM and ASTER DEMs suffer from local artifacts, they have strong similarities [34] [35] , and artifacts in the ASTER GDEM v2 are less for open or bare lands than forested areas [36] . Considering the study area consists mostly of bare land under an arid climate, and the ASTER GDEM has a higher spatial resolution (30 m) than the SRTM DEM (90 m), we choose the ASTER GDEM v2 to derive the morphometric parameters. The DEM is constructed from along-track stereo pairs and has −0.20 m average vertical accuracy, when compared to ~18,000 absolute geodetic references over the Conterminous US (CONUS), and an accuracy of 17 m at 95% confidence [36] . The watersheds and stream networks of the 36 basins were delineated from the GDEM (Figure 1 and Figure 2) using the ArcHydro tool in ArcGIS (ESRI, Redlands, USA). For this, a constant threshold contribution area of 0.45 km2 was chosen, based on visual comparisons with the 1 m-resolution World Imagery Map provided by Microsoft’s Bing Maps. The stream networks were then ordered using Strahler’s method [18] .
Twenty-one morphometric parameters were obtained from the DEM for all 36 basins. These include several basic morphometric parameters: the basin area (A), basin perimeter (P), basin length (Lb), total stream length (Lu), and total number of streams (Nu). The remaining parameters, which are partly derived from the basic parameters, are mean stream length (Ls), average length of first order streams (L1), ratio of average lengths of first

Figure 2. Example of the delineation of basin boundary and its stream networks based on Strahler’s rule, for Basin 1.
to second order streams (R12), bifurcation ratio (Rb), stream frequency (Fs), first order stream frequency (Fs1), ratio of first order stream number to perimeter (RP1), drainage density (Dd), maintenance coefficient (Mc), circularity ratio (C), elongation ratio (Re), form factor (Ff), relief ratio (Rr), relative relief (Rl), hypsometric integral (HI), and ruggedness number (Rn). The definitions of each parameter are shown in Table 1. Statistical analyses were performed using the MYSTAT and STATISTICA software. Multivariate analyses such as principal component analysis (PCA), canonical correspondence analysis (CCA), redundancy analysis (RDA), cluster analysis (CA) and discriminant function analysis (DFA) have often been applied to geoscientific studies. One of the main advantages of these techniques is the ability to analyse large and complex datasets containing many variables and spatial units. Among these, we perform PCA and CA because they are most basic and thus have been used intensively and successfully in various environmental and geoscientific studies [40] [41] . These two techniques are simple and enable the identification of structures within a data set, and reveal relationships between data components, so that important information can be retained, while noise is discarded.
Principal Component Analysis is mainly used in geomorphology for data reduction [42] [43] , and in many cases only a few principal components are needed to describe the essential data characteristics [44] . PCA calculates the correlation matrix, the principal component loading matrix and respective Eigen values to explain the structure of the parameters. We employ PCA here to examine the structural relationships of the 21 morphometric parameters and to classify the basins using the obtained component values.
In previous studies, CA has been used for grouping geomorphological units, such as drainage basins, based on morphology [30] [45] . The results of the CA in this study are shown in the dendrogram, whose horizontal axis corresponds to the linkage distance. Among the available approaches, we chose the Euclidean (geometric) distance method because it utilizes more information about the cluster contents and has previously been successfully applied to the grouping of drainage basins [30] . We applied CA to the objective classification of the 36 ba

Table 1. Description and symbols for morphological parameters used in this study.
sins, based on the values of the 21 parameters.
4. Results
Table 2 summarizes the minimums, maximums, means, and standard deviations of the 21 morphometric parameters for each of the 36 basins. Further, the correlation matrix of the 21 morphometric parameters is shown in Table 3. This indicates that strong correlations (R = 0.8 - 0.9) exist between some parameters that represent similar geomorphological characteristics: 1) A, Lb, and Nu; 2) Fs, Dd and Mc; and 3) C, Re and Ff. Good correlations (R = 0.7 - 0.8) exist between 1) P and HI, and 2) Ff, Re and C. Moderately well correlated parameters (R = 0.5 - 0.7) include 1) Re and Dd, and 2) HI and A. We conducted principal component analysis considering these correlations.
4.1. Principal Component Analysis
From the 21 parameters, five principal components (PCs) were detected with eigenvalues greater than one (Table 4); these components account for around 87% of the total variance. Upon varimax rotation, the cumulative total variance remained the same, so we considered the original PCA loadings. All the parameters are well represented by these five PCs (Table 4). However, the contributions of the 4th and 5th components (PC4 and PC5) are smaller than those of the 1st to 3rd (PC1 to PC3). In addition, with PC4 and PC5, no parameter shows a loading value greater than 0.6., we therefore focus primarily on the first three components.
4.1.1. PC1
Around 39% of the variance of the 21 parameters is described by PC1. The factor loadings indicate that PC1 represents those parameters that are related to the dimensions of drainage basins, such as A, P, Nu, Lu, and Lb,
Table 2. Min, Max, Mean and Standard Deviation of 21 morphometric variables of the 36 drainage basins.
Table 3. Pearson correlation coefficient matrix for the 21 parameters (bold correlations are significant at p < 0.050).
and to the drainage texture, as defined by Fs, Fs1, RP1, Dd, and Mc (Table 4). The sign of PC1 across the peninsula is mapped in Figure 3(a). Negative PC1 scores correspond to areal components with lower values, and to coarser drainage texture; thus small A, Dd, Fs1, Fs Mc, Lb, and a relatively small Nu. Such negative scores are mostly confined to the central part of the study area, particularly the Asir terrain, which extends from Yemen to the northern Jeddah region with altitudes greater than 3000 m. In contrast, a positive PC1 score indicates fine drainage textures and large areal extents. Most of the basins located in the Hijaz and Midyan terrains are associated with positive PC1 scores (Figure 3(a)), having large A, high Dd, high Fs and Fs1, and large Lb. The drainage basins located in the Yemen Cenozoic volcanic terrain also tend to have positive PC1 scores. Overall, larger basins have positive PC1 scores (Figure 3(a)).
4.1.2. PC2
PC2, which explains around 21% of the total variance, represents parameters HI, C, Re and Ff (Table 4), which reflect the general shape of a basin. Positive PC2 scores often correspond to low HI, while negative scores indicate high HI. Positive PC2 scores also represent nearly circular basins, according to the values of C, Re and Ff, whereas negative scores reflect more elongated basins. Those basins with positive PC2 scores tend to be located in the southern Asir, northern Hijaz, and Midyan terrains (Figure 3(b)). In contrast, negative PC2 scores are
Table 4. Loadings of each morphometric parameter for the first five components of the PCA.
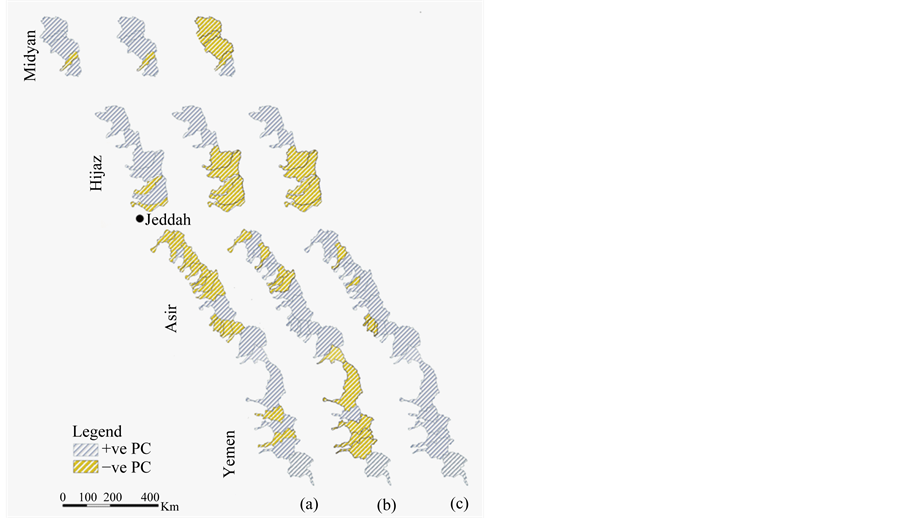
Figure 3. Maps showing the spatial distributions of: (a) PC1 scores, (b) PC2 scores, and (c) PC3 scores of basins within the study area.
found in the Yemen, northern Asir and southern Hijaz regions (Figure 3(b)).
4.1.3. PC3
PC3 explains 13% of the total variance, and represent variances in Ls, L1, Rr, Rl, and Rn (Table 4). This component therefore represents relief components, where basins with high relief and shorter streams have positive PC3 scores, and negative scores indicate low relief and longer streams. The spatial variation in PC3 scores is plotted in Figure 3(c). The PC3 scores tend to be positive in the Asir and Yemen terrains, while most of the basins located in the Hijaz and Midyan regions have negative PC3 scores.
4.2. Cluster Analysis and Relation with PCA From the dendrogram obtained from cluster analysis (Figure 4), two major clusters, A and B, with 24 and 12 basins respectively, may be identified. Cluster A is subdivided into Clusters I and II, with 17 and 7 basins, respectively. Cluster B can also be subdivided into Clusters III and IV, with 9 and 3 basins, respectively. The rela-
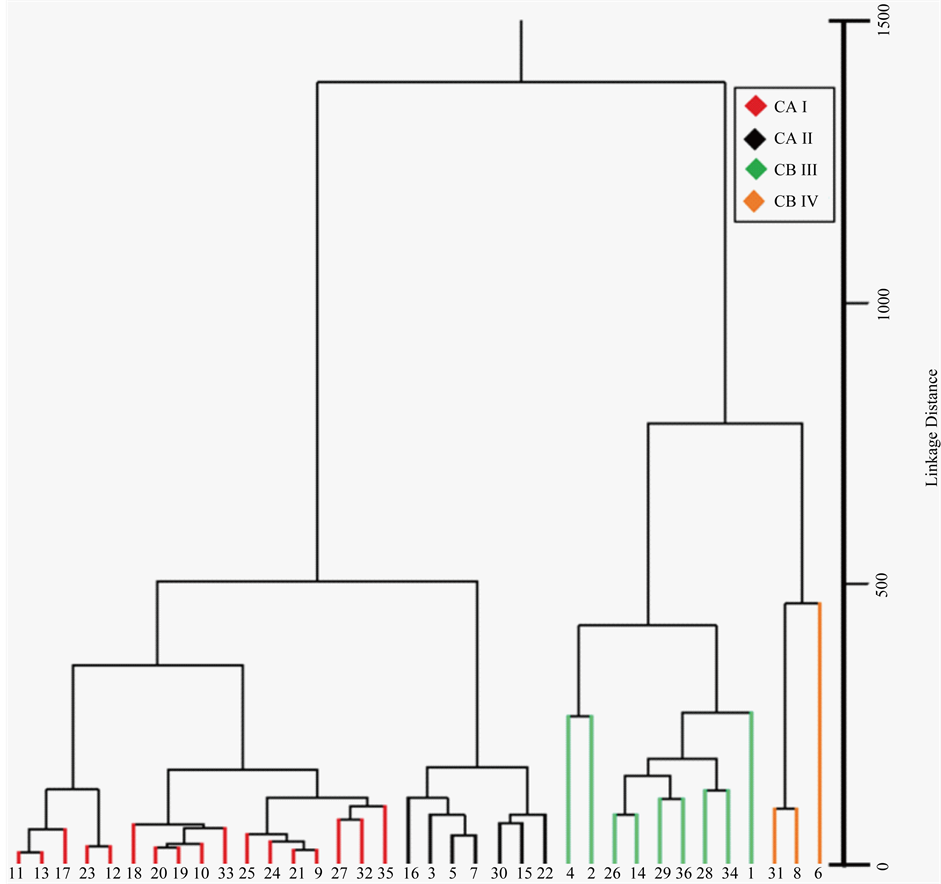
Figure 4. Dendrogram obtained by CA for the 36 drainage basins in the Western Arabian Peninsula. The Y-axis indicates the relative similarity of different cluster groups; the smaller the linkage distance, the greater the similarity between basins or clusters.
tionships between the clusters and the PCA scores (Figure 5) show that the clusters well correspond to the values of PC1. In general, the PC1 scores of basins in each of the clusters tend to increase in the following order: I, II, III and IV. Correlations between the clusters and the PC2 or PC3 scores are less clear. However, clusters II and IV have consistently positive PC3 scores, while clusters I and III are characterized by a wider range of PC3 scores, including some negative values.
5. Discussion
The importance of PC1 in classifying the drainage basins is made clear by the following two observations: 1) the component explains around 40% of the total variance of the morphometric parameters; and 2) it corresponds well to the classification of basins using CA. PC1 represents the basin dimensions and drainage texture, and they are positively correlated (Table 4), such that larger basins tend to have finer textures, giving larger values of Dd. It is well known that the relief ratio or basin slope generally tends to decrease with increasing basin size [46] [47] , which also holds true for this study area (Table 3). Previous studies have also related Dd to the relative relief or slope of a terrain [48] [49] , and both positive and negative correlations have been observed, depending on the dominant hillslope processes [47] [50] . In the study area, the drainage texture parameters, such as Dd, have negative correlations with relief and slope parameters Rr and Rl (Table 3), indicating that mass wasting on steeper slopes is responsible for a reduced Dd. Indeed, steep areas in the study area are typically characterized by the occurrence of frequent landslides [51] [52] . Therefore, the marked correlation between basin dimensions and drainage texture, as depicted in the main structure of PC1, seem to reflect the effects of relief and slope of a terrain.
It is clear that the effect of relief and slope is not the sole factor determining the main structure of PC1, because PC3, a component theoretically independent of PC1, more directly represents the relief and slope parameters. In other words, the effects of these parameters are not well reflected in PC1, and so there must be other mechanisms controlling the positive correlations between basin dimension and drainage texture. One possible factor may be the hydrological characteristics of drainage basins, which are related to climate. In an arid climate, the production of marked channelization with large and relatively frequent flow requires a large upstream area.
If such channelization occurs along the trunk stream, it leads to channelization along tributaries due to a fall in the local base level; this brings about positive correlations between basin dimensions and drainage texture. Our observations from the 1 m-resolution imagery of the study area provided by Bing Maps reveal that, in the trunk streams of large drainage basins, lateral erosion has been occurring, resulting in the streams cutting into the valley-side slopes. This also leads to a fall in the local base level for the tributaries, more accelerated channelization, and a finer drainage texture. In contrast, such lateral erosion is limited in smaller basins.
Subyani et al. [16] also conducted PCA for ten basins in the Hijaz terrain, and the PC1 found in that study is similar to ours, in that it represents basin dimensions and drainage density. However, they described these para-
 (a) (b)
Figure 5. Principal component analysis loading plots for basin clusters. (a) PC1-PC2, and (b) PC1-PC3 axis.
meters simply as “major morphometric parameters”, and did not consider the relationships between basin dimensions, drainage texture, relief and slope parameters, and hydrological characteristics. This study has therefore not only confirmed the preliminary observations made by Subyani et al. [16] from a smaller data set, but has also provided a geomorphological interpretation of the most important principal component.
PC2 represents the general shape of the basins, in terms of circularity and standardized hypsometry. PC2 is theoretically independent of PC1, and this is supported by the different parameters represented by the two components: basin dimensions such as area and basin shape such as circularity may be regarded as independent. One significant aspect of PC2 is its correlation with geology. Figure 6 shows the scores of PC1 to PC3 for each drainage basin according to the two major lithological types: crystalline rocks and volcanic rocks. From this, it can be seen that PC1 and PC3 are basically unrelated to geology. In contrast, PC2 clearly correlates with geology, in that the PC2 values for basins underlain by crystalline rocks tend to be positive, while those for volcanic rocks tend to be negative. This observation indicates that, although lithology is not included as a parameter in the PCA, its effect on the general shape of river basins is reflected in a PC. Generally, those basins underlain by volcanic rocks are more elongated, and less eroded in terms of hypsometry. This agrees with observations made by Davison et al. [14] and Vincent [11] that the flood basaltic rocks in Yemen act as cap rocks and prevent erosion, whereas in the Asir terrain, crystalline rocks are associated with very steep rivers incised into high mountains. The correlation between lithology and basin elongation in part of our study area was also indicated by Subyani et al. [16] . However, in their analysis, the parameter relating to basin circularity was not regarded as a major parameter of any PC. Their PC2 is more related to basin slope and relief, and they did not discuss the effects of geology on their PCs. In statistical analyses of geomorphological units such as drainage basins, lithology is usually represented as a categorical variable, because its quantification as a continuous variable, including a representative index for rock strength or weathering vulnerability, is difficult. Therefore, PCA and CA usually do not incorporate geological parameters. However, if geological differences are considered along with the results from PCA and CA, it may be possible to discuss the potential lithological influence on landforms, as demonstrated in this study.
PC3 reflects relief components and the length of each stream segment. In this area, steeper basins tend to have shorter stream segments. This corresponds to the negative correlation between Dd and relief and slope, as noted above. Although PC3 explains a smaller percentage of the total variance than PC2, it better explains the secondary level variation observed in the CA result, as noted in Section 4.2. Although both PCA and CA can be used to classify river basins, giving similar results in this study area as far as the most important component (PC1) is concerned, they also represent somewhat different features and processes, such as hydrological conditions that may affect formation of the first-order streams with different channel-head areas, or more frequent confluences, despite similar total stream lengths.
Where PCA has been previously applied to drainage basin parameters, those parameters that represent basin dimensions were not included, to focus on the standardized parameters [29] [42] . This approach is in line with the common use of standardized parameters, such as Dd and HI, and may be effective in avoiding complications in analyses and discussion. However, as indicated in our study, the absolute basin size does influence the standardized parameters of drainage texture in some cases, and may therefore be essential in classifying drainage
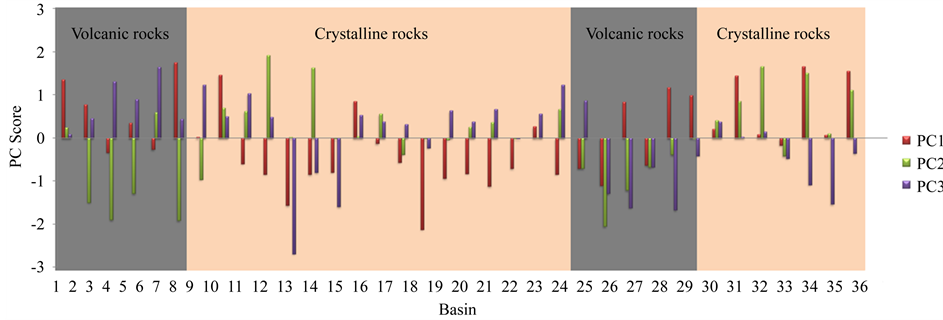
Figure 6. Scores of PC1, PC2, and PC3 for each drainage basin according to the two major lithology types in the study area.
basins. Thus, it will be important to include parameters that represent absolute basin size in statistical analyses of drainage basins, at least in the early stages of analysis. Following this, it will be possible to focus on the standardized parameters only if the effect of absolute basin size is found to be minor.
6. Conclusion
We have conducted a morphometric study to analyze and classify the 36 drainage basins in the western Arabian Peninsula. PCA and CA were applied to 21 morphometric parameters derived from a DEM. We found that the three major principal components can be interpreted in relation to drainage basin development through fluvial and hillslope erosion, under the influence of geology. The result of the drainage basin classification from CA is consistent with the results of PCA. Compared with previous drainage basin analyses using PCA, this study has used a greater number of drainage basins and morphometric parameters to obtain a statistically more significant result and to include the possible effects of absolute basin dimensions on geomorphic processes. We have also suggested the importance of considering geology when interpreting the results of PCA and CA generated only from morphometric parameters, because geology and landforms are often related. Some of our results appear to be unique to arid regions; for example, the influence of basin size on erosion may be less significant in humid regions because even small basins can generate sufficient flow to produce marked fluvial erosion. Further studies into drainage basins in varying environmental conditions are necessary to address such issues.
References
- Cochran, J.R. (1983) A Model for Development of Red Sea. AAPG Bulletin, 67, 41-69. http://dx.doi.org/10.1306/03B5ACBE-16D1-11D7-8645000102C1865D
- Bosworth, W., Huchon, P. and McClay, K. (2005) The Red Sea and Gulf of Aden Basins. Journal of African Earth Sciences, 43, 334-378. http://dx.doi.org/10.1016/j.jafrearsci.2005.07.020
- McGillivray, J. and Husseini, M. (1992) The Paleozoic Petroleum Geology of Central Arabia. AAPG Bulletin, 76, 1473-1490.
- Cole, G., Abu-Ali, M., Aoudeh, S., Carrigan, W., Chen, H., Colling, E., Gwathney, W., Al-Hajji, A. and Halpern, H. (1994) Organic Geochemistry of the Paleozoic Petroleum System of Saudi Arabia. Energy & Fuels, 8, 1425-1442. http://dx.doi.org/10.1021/ef00048a034
- Johnson, P.R. and Woldehaimanot, B. (2003) Development of the Arabian-Nubian Shield: Perspectives on Accretion and Deformation in the Northern East African Orogen and the Assembly of Gondwana. Geological Society, London, Special Publications, 206, 289-325. http://dx.doi.org/10.1144/GSL.SP.2003.206.01.15
- Nehlig, P., Genna, A. and Asfirane, F. (2002) A Review of the Pan-African Evolution of the Arabian Shield. Geoarabia-Manama, 7, 103-124.
- Fryberger, S.G., Al-Sari, A.M., Clisham, T.J., Rizvi, S.A. and Al-Hinai, K.G. (1984) Wind Sedimentation in the Jafurah Sand Sea, Saudi Arabia. Sedimentology, 31, 413-431. http://dx.doi.org/10.1111/j.1365-3091.1984.tb00869.x
- Sagga, A. (1993) Roundness of Sand Grains of Longitudinal Dunes in Saudi Arabia. Sedimentary Geology, 87, 63-68. http://dx.doi.org/10.1016/0037-0738(93)90036-5
- Brown, G.F. (1972) Tectonic Map of the Arabian Peninsula1: 4,000,000. US Geological Survey.
- Stern, R.J. and Johnson, P. (2010) Continental Lithosphere of the Arabian Plate: A Geologic, Petrologic, and Geophysical Synthesis. Earth-Science Reviews, 101, 29-67. http://dx.doi.org/10.1016/j.earscirev.2010.01.002
- Vincent, P. (2008) Saudi Arabia: An Environmental Overview. Taylor and Francis, London. http://dx.doi.org/10.1201/9780203030882
- Fourniguet, J., Alabouvette, B., Kluyver, H., Ledru, P. and Robelin, C. (1985) Evolution of Western and Central Saudi Arabia during Late Tertiary and Quaternary. A Bibliographic Review. Open-File Report BRGM-OF-05-10. Ministry of Petroleum and Mineral Resources, Jiddah.
- Al Sayari, S.S. and Zotl, J.G. (1978) Quaternary Period in Saudi Arabia 1. Sedimentological, Hydrogeological, Hydrochemical, Geomorphological, and Climatological Investigations in Central and Eastern Saudi Arabia. Springer Verlag, Vienna. http://dx.doi.org/10.1007/978-3-7091-8494-3
- Davison, I., Tatnell, M., Owen, L., Jenkins, G. and Baker, J. (1998) Tectonic Geomorphology and Rates of Crustal Processes along the Red Sea Margin, North-West Yemen. In: Sedimentation and Tectonics in Rift Basins Red Sea: -Gulf of Aden, Springer, 595-612. http://dx.doi.org/10.1007/978-94-011-4930-3_32
- Sen, Z. (2008) Wadi Hydrology. CRC Press, Boca Raton. http://dx.doi.org/10.1201/9781420061550
- Subyani, A.M., Qari, M.H. and Matsah, M.I. (2012) Digital Elevation Model and Multivariate Statistical Analysis of Morphometric Parameters of Some Wadis, Western Saudi Arabia. Arabian Journal of Geosciences, 5, 147-157. http://dx.doi.org/10.1007/s12517-010-0149-7
- Horton, R.E. (1945) Erosional Development of Streams and Their Drainage Basins; Hydrophysical Approach to Quantitative Morphology. Geological Society of America Bulletin, 56, 275-370. http://dx.doi.org/10.1130/0016-7606(1945)56%5B275:EDOSAT%5D2.0.CO;2
- Strahler, A.N. (1952) Hypsometric (Area-Altitude) Analysis of Erosional Topography. Geological Society of America Bulletin, 63, 1117-1142. http://dx.doi.org/10.1130/0016-7606(1952)63%5B1117:HAAOET%5D2.0.CO;2
- Morisawa, M.E. (1962) Quantitative Geomorphology of Some Watersheds in the Appalachian Plateau. Geological Society of America Bulletin, 73, 1025-1046. http://dx.doi.org/10.1130/0016-7606(1962)73%5B1025:QGOSWI%5D2.0.CO;2
- Schumm, S.A. (1956) Evolution of Drainage Systems and Slopes in Badlands at Perth Amboy, New Jersey. Geological Society of America Bulletin, 67, 597-646. http://dx.doi.org/10.1130/0016-7606(1956)67%5B597:EODSAS%5D2.0.CO;2
- Strahler, A.N. (1964) Quantitative Geomorphology of Drainage Basin and Channel Networks. In: Chow, V.T., Ed., Handbook of Applied Hydrology, McGraw-Hill, New York, 439-476.
- Burrough, P.A., McDonnell, R., Burrough, P.A. and McDonnell, R. (1998) Principles of Geographical Information Systems. Oxford University Press, Oxford.
- Wilson, J.P. and Gallant, J.C. (2000) Digital Terrain Analysis. In: Wilson, J.P. and Gallant, J.C., Eds., Terrain Analysis: Principles and Applications, John Wiley & Sons, New York, 1-27.
- Chen, Y., Sung, Q. and Cheng, K. (2003) Along-Strike Variations of Morphotectonic Features in the Western Foothills of Taiwan: Tectonic Implications Based on Stream-Gradient and Hypsometric Analysis. Geomorphology, 56, 109-137. http://dx.doi.org/10.1016/S0169-555X(03)00059-X
- Walcott, R.C. and Summerfield, M. (2008) Scale Dependence of Hypsometric Integrals: An Analysis of Southeast African Basins. Geomorphology, 96, 174-186. http://dx.doi.org/10.1016/j.geomorph.2007.08.001
- Frissell, C.A., Liss, W.J., Warren, C.E. and Hurley, M.D. (1986) A Hierarchical Framework for Stream Habitat Classification: Viewing Streams in a Watershed Context. Environmental Management, 10, 199-214. http://dx.doi.org/10.1007/BF01867358
- Bengraı̈ne, K. and Marhaba, T.F. (2003) Using Principal Component Analysis to Monitor Spatial and Temporal Changes in Water Quality. Journal of Hazardous Materials, 100, 179-195. http://dx.doi.org/10.1016/S0304-3894(03)00104-3
- Adams, M. (1998) The Principles of Multivariate Data Analysis. In: Ashurt, P.R. and Dennis, M.J., Eds., Analytical Methods of Food Authentication, Blackie Academic & Professional, London, 308.
- Miller, J.R., Ritter, D.F. and Kochel, R.C. (1990) Morphometric Assessment of Lithologic Controls on Drainage Basin Evolution in the Crawford Upland, South-Central Indiana. American Journal of Science, 290, 569-599. http://dx.doi.org/10.2475/ajs.290.5.569
- Raux, J., Copard, Y., Laignel, B., Fournier, M. and Masseï, N. (2011) Classification of Worldwide Drainage Basins through the Multivariate Analysis of Variables Controlling Their Hydrosedimentary Response. Global and Planetary Change, 76, 117-127. http://dx.doi.org/10.1016/j.gloplacha.2010.12.005
- Reches, Z. and Schubert, G. (1987) Models of Post-Miocene Deformation of the Arabian Plate. Tectonics, 6, 707-725. http://dx.doi.org/10.1029/TC006i006p00707
- Almazroui, M., Nazrul Islam, M., Athar, H., Jones, P. and Rahman, M.A. (2012) Recent Climate Change in the Arabian Peninsula: Annual Rainfall and Temperature Analysis of Saudi Arabia for 1978-2009. International Journal of Climatology, 32, 953-966. http://dx.doi.org/10.1002/joc.3446
- Rappold, G.D. (2005) Precipitation Analysis and Agricultural Water Availability in the Southern Highlands of Yemen. Hydrological Processes, 19, 2437-2449. http://dx.doi.org/10.1002/hyp.5894
- Frey, H. and Paul, F. (2012) On the Suitability of the SRTM DEM and ASTER GDEM for the Compilation of Topographic Parameters in Glacier Inventories. International Journal of Applied Earth Observation and Geoinformation, 18, 480-490. http://dx.doi.org/10.1016/j.jag.2011.09.020
- Li, P., Shi, C., Li, Z., Muller, J., Drummond, J., Li, X., Li, T., Li, Y. and Liu, J. (2012) Evaluation of ASTER GDEM VER2 Using GPS Measurements and SRTM VER4.1 in China. In: XXII Congress of International Society of Photogrammetry, Remote Sensing and Spatial Information Sciences, 25 August-1 September 2012, Melbourne, 181-186. http://dx.doi.org/10.5194/isprsannals-I-4-181-2012
- Tachikawa, T., Kaku, M., Iwasaki, A., Gesch, D., Oimoen, M., Zhang, Z., Danielson, J., Krieger, T., Curtis, B. and Haase, J. (2011) ASTER Global Digital Elevation Model Version 2—Summary of Validation Results. https://lpdaacaster.cr.usgs.gov/GDEM/Summary_GDEM2_validation_report_final.pdf
- Horton, R.E. (1932) Drainage-Basin Characteristics. Transactions, American Geophysical Union, 13, 350-361. http://dx.doi.org/10.1029/TR013i001p00350
- Sarangi, A., Madramootoo, C. and Enright, M.P. (2003) Development of User Interface in ArcGIS for Estimation of Watershed Geomorphology. The Canadian Society for Engineering in Agricultural, Food and Biological Sytsems, Paper No. 03-120.
- Miller, V.C. (1953) A Quantitative Geomorphic Study of Drainage Basin Charecteristics in the Clinch Mountain Area. Columbia University, Department of Geology, Virginea and Tennessee Technical Report, No. 3, Contract N6 ONR, 271-300.
- Aruga, R., Gastaldi, D., Negro, G. and Ostacoli, G. (1995) Pollution of a River Basin and Its Evolution with Time Studied by Multivariate Statistical Analysis. Analytica Chimica Acta, 310, 15-25. http://dx.doi.org/10.1016/0003-2670(95)00101-5
- Fournier, M., Massei, N., Mahler, B., Bakalowicz, M. and Dupont, J. (2008) Application of Multivariate Analysis to Suspended Matter Particle Size Distribution in a Karst Aquifer. Hydrological Processes, 22, 2337-2345. http://dx.doi.org/10.1002/hyp.6828
- Singh, P., Kumar, V., Purohit, R., Kothari, M. and Dashora, P. (2009) Application of Principal Component Analysis in Grouping Geomorphic Parameters for Hydrologic Modeling. Water Resources Management, 23, 325-339. http://dx.doi.org/10.1007/s11269-008-9277-1
- Prima, O.D.A. and Yoshida, T. (2010) Characterization of Volcanic Geomorphology and Geology by Slope and Topographic Openness. Geomorphology, 118, 22-32. http://dx.doi.org/10.1016/j.geomorph.2009.12.005
- Alberto, W.D., Marı́a del Pilar, D., Marı́a Valeria, A., Fabiana, P.S., Cecilia, H.A. and Marı́a de los Ángeles, B. (2001) Pattern Recognition Techniques for the Evaluation of Spatial and Temporal Variations an Water Quality. A Case Study: Suquı́a River Basin (Córdoba-Argentina). Water Research, 35, 2881-2894. http://dx.doi.org/10.1016/S0043-1354(00)00592-3
- de Andrade, E.M., Palácio, H.A.Q., Souza, I.H., de Oliveira Leão, R.A. and Guerreiro, M.J. (2008) Land Use Effects in Groundwater Composition of an Alluvial Aquifer (Trussu River, Brazil) by Multivariate Techniques. Environmental Research, 106, 170-177. http://dx.doi.org/10.1016/j.envres.2007.10.008
- Oguchi, T. and Ohmori, H. (1994) Analysis of Relationships among Alluvial-Fan Area, Source Basin Area, Basin Slope and Sediment Yield. Zeitschrift Fur Geomorphologie, 38, 405-420.
- Tucker, G.E. and Bras, R.L. (1998) Hillslope Processes, Drainage Density and Landscape Morphology. Water Resources Research, 34, 2751-2764. http://dx.doi.org/10.1029/98WR01474
- Montgomery, D.R. and Dietrich, W.E. (1992) Channel Initiation and the Problem of Landscape Scale. Science, 255, 826-830. http://dx.doi.org/10.1126/science.255.5046.826
- Oguchi, T. (1997) Drainage Density and Relative Relief in Humid Steep Mountains with Frequent Slope Failure. Earth Surface Processes and Landforms, 22, 107-120. http://dx.doi.org/10.1002/(SICI)1096-9837(199702)22:2%3C107::AID-ESP680%3E3.3.CO;2-L
- Talling, P.J. and Sowter, M.J. (1999) Drainage Density on Progressively Tilted Surfaces with Different Gradients, Wheeler Ridge, California. Earth Surface Processes and Landforms, 24, 809-824. http://dx.doi.org/10.1002/(SICI)1096-9837(199908)24:9%3C809::AID-ESP13%3E3.0.CO;2-R
- Youssef, A.M., Maerz, N.H. and Al-Otaibi, A.A. (2012) Stability of Rock Slopes along Raidah Escarpment Road, Asir Area, Kingdom of Saudi Arabia. Journal of Geography & Geology, 4, 2. http://dx.doi.org/10.5539/jgg.v4n2p48
- Alharbi, T., Sultan, M., Sefry, S., El Kadiri, R., Ahmed, M., Chase, R., Milewski, A., Abdullah, M., Emil, M. and Chounaird, K. (2013) An Assessment of Landslide Distribution in the Faifa Area, Saudi Arabia, Using Remote Sensing and GIS Techniques. Natural Hazards and Earth System Sciences Discussions, 1, 6685-6717. http://dx.doi.org/10.5194/nhessd-1-6685-2013
NOTES

*Corresponding author.