International Journal of Geosciences
Vol.5 No.2(2014), Article ID:43173,8 pages DOI:10.4236/ijg.2014.52018
Characterization and Evaluation of Natural Resources for Land Use Diversification Planning: A Case Study in a Block of Meghalaya Using RS & GIS Technique
Pratibha T. Das1, H. Suchitra Devi1, S. Sudhakar1, Mammi Rently21North Eastern Space Applications Centre, Department of Space, Government of India, Umiam, India
2District & Local Research Station & Laboratories, Shillong, India
Email: thakuriapratibha@rediffmail.com
Copyright © 2014 Pratibha T. Das et al. This is an open access article distributed under the Creative Commons Attribution License, which permits unrestricted use, distribution, and reproduction in any medium, provided the original work is properly cited. In accordance of the Creative Commons Attribution License all Copyrights © 2014 are reserved for SCIRP and the owner of the intellectual property Pratibha T. Das et al. All Copyright © 2014 are guarded by law and by SCIRP as a guardian.
Received November 27, 2013; revised December 26, 2013; accepted January 25, 2014
Keywords:Land Resources; Land Evaluation; Alternate Land Use; Remote Sensing; GIS
ABSTRACT
Characterization and evaluation of land resources of Mawryngkneng block was carried out using IRS-P6 LISS III and LISS-IV data. Five major physiographic units namely structural hills, denudational hills, plateau and intermontane valley were identified. Visual interpretation of satellite data indicated that 32.2% of the total geographical area (TGA) is under dense forest followed by wastelands (28.8%), open forest (16.1%), cultivated area (13.6%), built up area (8.2%) and water body (0.9%). Ten soil series were tentatively identified and the soils belonged to 2 orders (Ultisols and Alfisols), 3 sub orders (Udult, Udalf and Humult), 6 great groups, 8 sub groups. The soils are moderately acidic, deep to very deep and texture varies from sandy clay loam to clay. The soils are very rich in organic carbon. The availability of nitrogen is medium to high and phosphorus availability is low to medium whereas potassium availability is low in the entire study area. The soils were grouped into land capability class II & III and the soils were moderately to marginally suitable for orange and marginally suitable for pine apple. An action plan with suggested land use and interventions has been prepared by using all land resource information generated under the study. The action plan includes areas for afforestation, intensive cultivation in the existing cropped areas with soil conservation measures like mulching, zero tillage etc. and orange and pine apple plantation in open scrub lands which are cultivable wastelands. This might help the farmers and the planner in better management of land resources for sustained productivity.
1. Introduction
Throughout human history, increasing population growth and changing dietary patterns have resulted in more and more land moving from forest or grasslands into agricultural lands. Demand for food is increasing as populations grow and gain wealth to purchase more varied and resource-intensive diets. There is increased competition for land, water, energy, and other inputs into food production [1]. Increase in population, changes in dietary habits associated with increase in income, decline in per capita land area, and decline in per capita availability of renewable fresh water aggravated by excessive withdrawal of ground water are the compelling reasons for intensification of agriculture [2]. Intensive agriculture is the cultivation of land where there are very high inputs of labour, fertilizers, pesticides, herbicides, and fungicides to obtain the maximum output. This involves the use of mechanical ploughing, chemical fertilizers, plant growth regulators and/or pesticides. It is associated with the increasing use of agricultural mechanization, which has enabled a substantial increase in production. But it also dramatically increases deforestation and conversion of grassland to agriculture, soil degradation by increasing soil erosion, compaction, crusting and water logging, salinisation, alkalisation, acidification, soil pollution and nutrient depletion, reduction of organic matter content in the soil and poisoning water with agricultural chemicals. This leads to low soil productivity and managing such soil is a formidable challenge to ensure productivity, profitability and national food security on sustainable basis. Sustained food security calls for increasing the crop production by maintaining the productivity of existing crop lands, preventing degradation of fertile lands and bringing erstwhile degraded lands under plough. The importance of sustainable utilisation of natural resources has been widely recognized for which information on the nature, extent spatial distribution and temporal behavior of land resources is a pre-requisite. Space borne remote sensing can effectively fulfill this role as it is proven tool for fast and accurate appraisal of natural resources [3]. The information thus generated can be put in a Geographic Information System (GIS) that aids planners in decision-making as well as in scientific management of land resources.
Soil characterization is basically an inference process based on Jenny’s model [4]. According to this model climate, parent material, relief or topography, vegetation and time are the soil forming factors that influence on soil characteristics. The climate acting over parent material for pedogenic time on different physiographic unit is the most dominant factor responsible for development of different types of soil to support different vegetation. Vegetation types are also one active factor which greatly influences soil formation by adding organic matter, providing pores for translocation and accumulation of minerals and clay. During soil development many morphological, physical, chemical, biochemical and, macro and microbiological reactions and processes occur simultaneously as also interactively in soils. These reaction and processes that affect the properties of soils and its development are in turn influenced by several natural factors viz., climate, organism, parent material and modified to a great extend by the relief features. The surface configuration is the chief factor in soil development and close relation exists between soils and their morphological setting [5]. Since the productive potential of the soils is limited by intrinsic characteristics, understanding of the soils as influenced by landscape features is of great significance. The spatial information technologies viz. Remote sensing (RS), Geographic Information System (GIS) and Global Positioning System (GPS) have made it possible to characterize the soil forming factors and infer soil boundaries based on field survey, soil sample analysis image characteristics. The application of satellite remote sensing data products for small and medium scale soil mapping is widely accepted, but they have not been used for large scale soil mapping due to coarse resolution of satellite data [6]. With advances in terms of spatial, spectral and radiometric resolutions of the sensors, studies have been initiated to characterize soils at large scale through physiography-land use-soil relationship [6- 11].
The land use planning involves making knowledgeable decisions about land use and the environment. Soil information is a vital component in the planning process, reflecting directly upon land-use suitability. The land evaluation system of FAO (1983) was based on land qualities as related to individual crops that was used to develop the crop requirements based on experiences in tropical areas [12]. This land evaluation system for land use was earlier adopted to derive land suitability map in Seoni district, Madhya Pradesh [13]. Computer program, which includes decision support systems (models) and Geographic Information Systems (GIS) has contributed to the speed and efficiency of overall planning process. Quick and efficient access to large amount of information was enabled by GIS, exhibiting relationships, patterns, and trends that are useful in combining soil survey information to monitor land use changes [14]. Soil survey database could be used to estimate soil characteristics based on known relationship to other soil physical and chemical properties and also to improve fertilizer recommendations on the basis of soil test values [15]. Of late, advanced land evaluation techniques have been found useful in addressing soil fertility constraints and management problems in the areas of low productivity [16]. In some of such areas that are inhabited by tribal farming communities crop failures were experienced frequently due to traditional agricultural practices. These areas should be given priorities for improved crop planning and agricultural development. The land resources can be better managed through systematic soil characterization and evaluating their potentials and limitations with appropriate interventions. Keeping in view above, an attempt has been made to characterize and evaluate the land resources of Mawryngkneng Community and Rural Development Block of East Khasi hills district of Meghalaya using Resourcesat-I data and GIS.
2. Materials and Methods
2.1. Study Area
Mawryngkneng Community and Rural Development Block is one of the oldest block lies in the East Khasi Hills District of Meghalaya between 25˚32'05''N to 25˚38'20''N latitude and 91˚50'00''E to 92˚10'00''E logitude. The total study area is approximately 310.6 sq·km. The area is covered by Survey of India Toposheet 78 O/14 and 83 C/2 on 1:50,000 scale (Figure 1). The geology of the study area comprises mostly of 1) Shillong Group of rocks-quartzite, phyllite, conglomerate 2) Arehan gneiss complex 3) Granite rocks and tertiary sediments consisting mainly of sandstone, limestone, silts
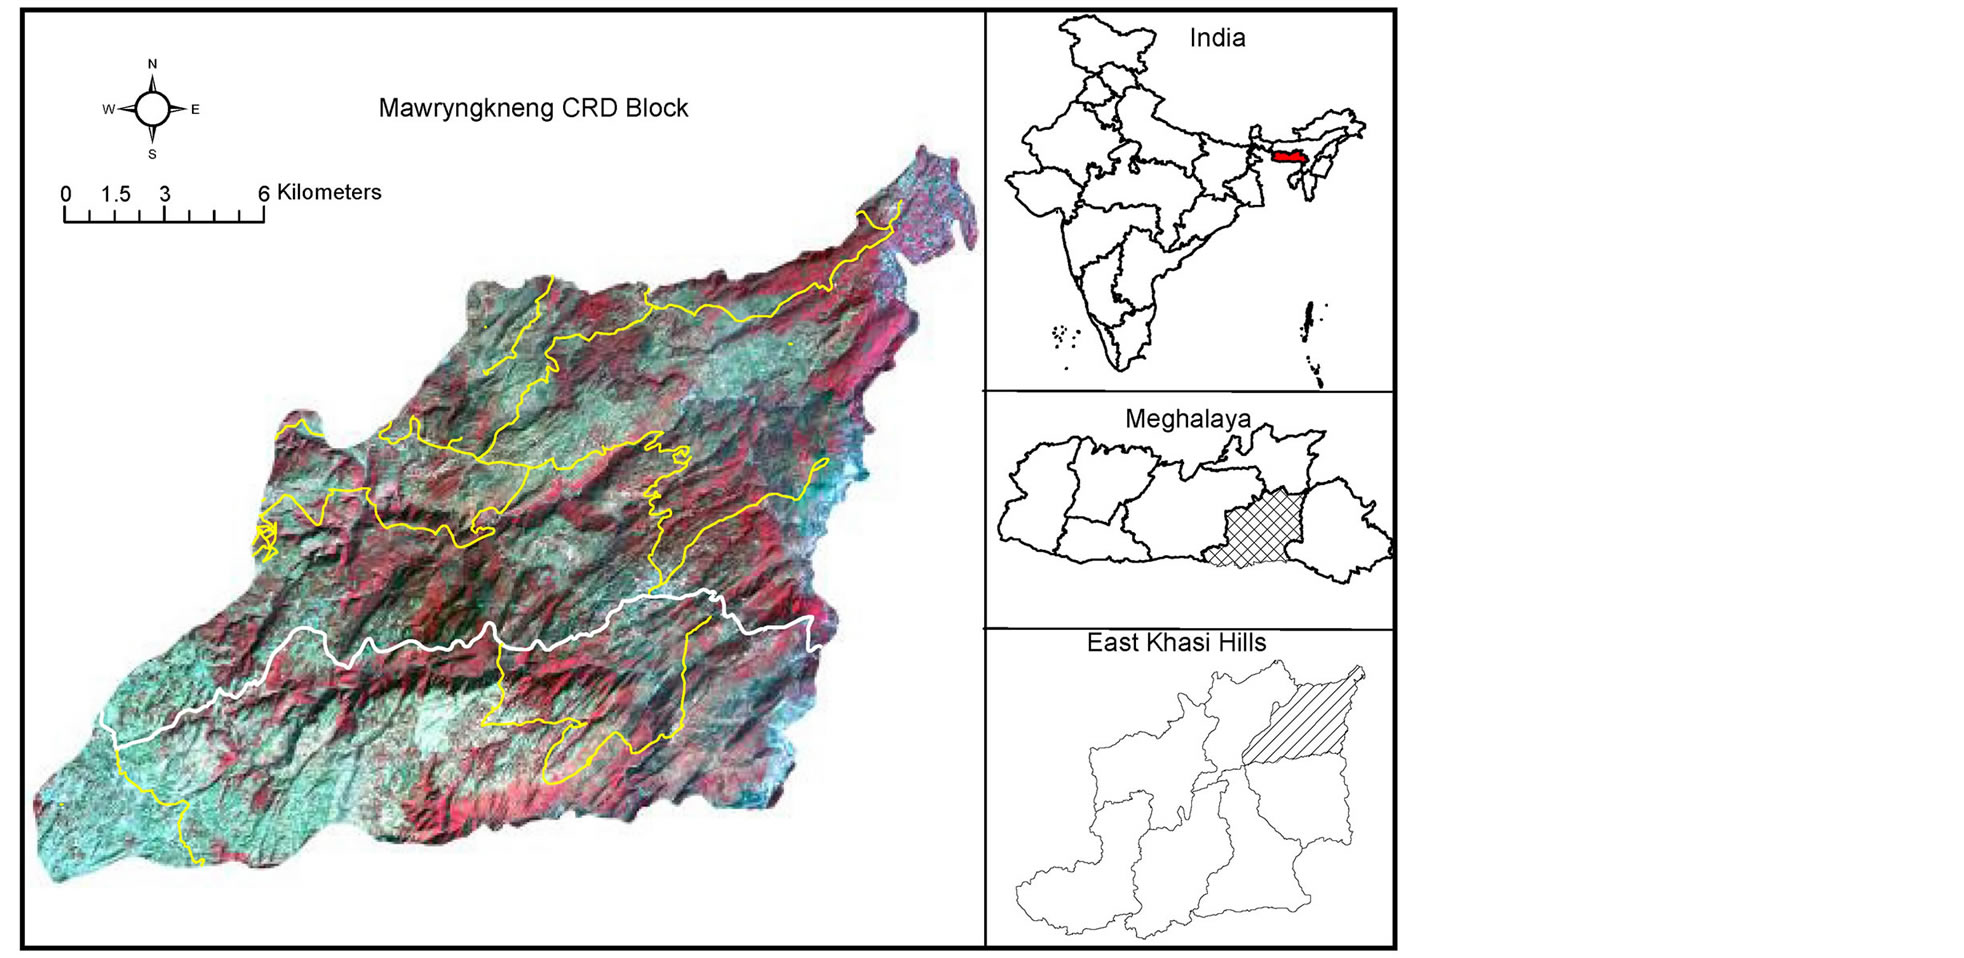
Figure 1. Location of the study area.
stone, shale and pebbles, clays, conglomerates. These sedimentary rocks are in complex form. Physiographically, the area is mostly characterized by Structural Hills, Denudational Hills and Valley associated with nearly level to moderately steeply sloping lands. The study area is sparsely populated with a total population of 50,035. The habitation is restricted mostly to village settlements and very few homesteads. Out of the total household of 8751 families, the male population is 47% and the female account for 52.8%. The manpower resource is derived from the age group of 14 to 50 years of both male and female gender. The average size of the family is 8 out of which 49.66% of the population is literate. Agriculture is the main occupation of the people. The general standard of living of the people is poor to medium. There are several educational institutions within the area from Primary to High School standard. There are several registered growers of potato and retailers of chemical fertilizers. The National Highway 44 runs through a part of the study area, and hence the farmers can easily market their products. 70% of the villages are connected with kutcha motorable roads.
The study area represents the typical sub-tropical northeastern region. Mild summer and cold winter characterize it. The mean summer temperature is 22˚C and mean winter temperature is 3˚C. The average annual rainfall of the area is 2087 mm with more than 80% occur during the period from April to October and qualify for thermic and udic soil temperature and soil moisture regimes, respectively. The study area entirely covered by natural vegetation comprises Pine (Pinus khasiana) in the higher elevation and tree species such as Schima vallichi, Phyllanthus emblica, etc. are in the lower elevation, scrubs interspersed with grasses and rock out crops. Cultivation is done on the valley fields as well as on the upland. Bun Cultivation is unique system of cultivation followed here where the gentle slope up to 15 percent are used for cultivation of crops like potatoes, cabbage, cauliflower and tomatoes in ridges along the slopes. The cultivation sites on the hill slopes are permanent. In bun cultivation farmers covers the branches of trees and grasses with soil and then burn them inside the ridges made along the slope [17]. Farmyard Manure and chemical fertilizers are then added to it. Agriculture is the main source of livelihood of the people in the study area. The main crops grown are Lowland/Wet Paddy, Upland paddy, tomatoes, potatoes (twice in a year) peas, maize, cabbage, cauliflower, carrot, radish, sweet potato, ginger and tea plantations in few pockets are also found. The cropping season of the major crops are as given in Table 1.
2.2. Satellite and Ancillary Data
Digital data of IRS -P6 (Resourcesat-1) LISS III sensor of October, 2011 (Spatial resolution of 23.5 m) and LISS-IV sensor (Spatial resolution of 5.8 m) of February, 2012 was used to prepare physiography, lithology and land use land cover map. Digital Elevation Model generated from Cartosat-I image was used to derive slope information.
2.3. Methodology
The methodology followed for extraction of information from satellite data is essentially of standard visual interpretation based on tone, texture, shape and size [18]. The slope map was derived from Digital Elevation Model generated under SISDIP project for Meghalaya at North
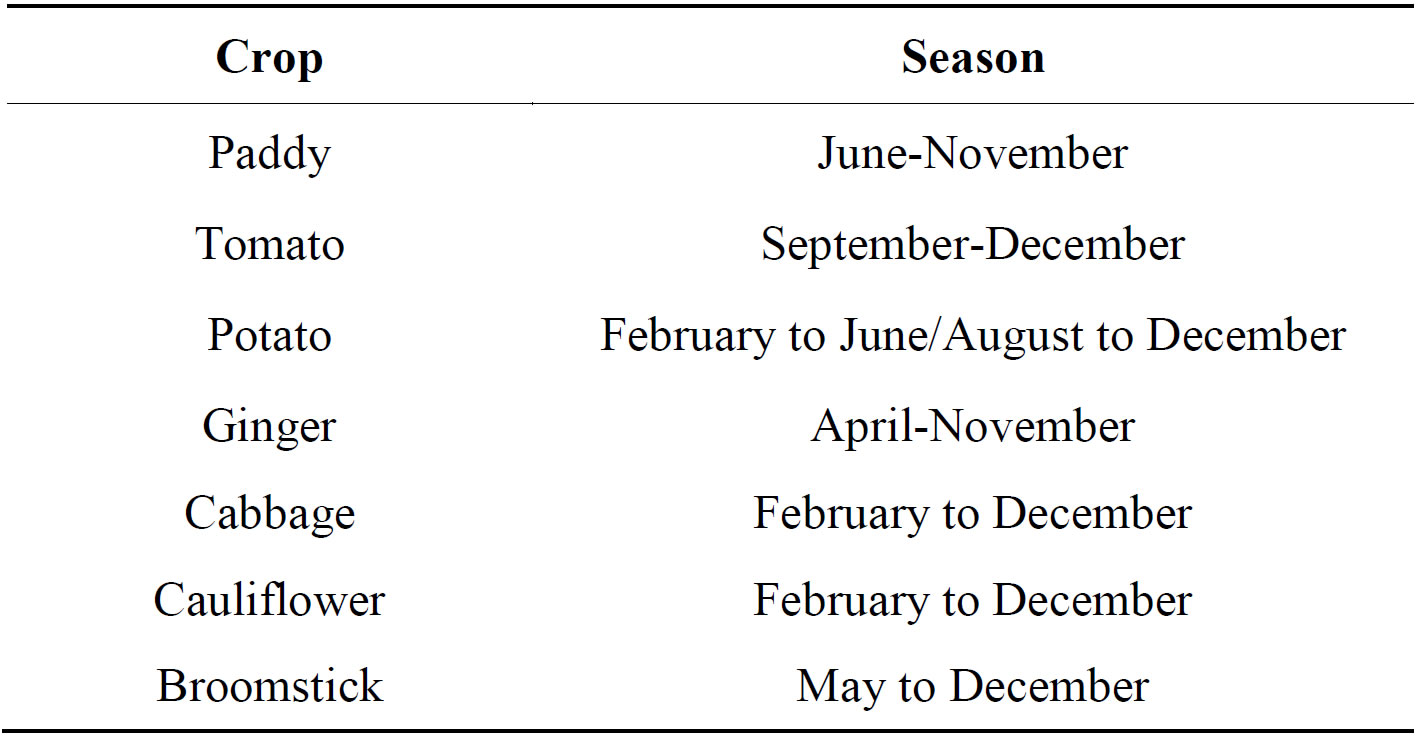
Table 1.Major crops grown and the season of cultivation.
Eastern Space Applications Centre (NESAC). Soil profiles were studied based on variations in physiographic unit, geology (lithology), land use land cover and slope map. Each map represents the factors which influence soil formation. All theses maps were transferred to GIS environment and overlaid and used as base map for field survey and soil sample collection. Based on variations of these factors, 12 sites have been selected for detailed morphological study of the soils. Soil profiles were exposed and studied the morphological characteristics of each soil profile in detail and recorded in a standard format following the soil survey manual [19] and guidelines for soil profile descriptions [20]. Soil site information was also recorded. Horizon wise soils were collected analyzed for physical and chemical properties (Table 1) to incorporate the results with field observations and the soils were classified taxonomically following Keys to soil Taxonomy (2006). The soil boundary was delineated based on the boundary inferred by combination of different layers representing soil forming factors that were used in the base map. The polygons representing similar physiographic unit, parent material, slope and vegetation cover was put under same soil type which is confirmed by image characteristics and field survey. Different kind of soil can be expected if there is any change of these factors [21]. The soil map was used for land evaluation. The soils were grouped under different land capability sub-classes [22]. Soil fertility maps were generated by interpolation. For this study composite surface soil samples were collected from 40 locations. The soil samples were analyzed for pH, organic carbon, available nitrogen, phosphorus and potash and NI value were calculated. A point layer was generated in ArcMap 10 software by entering latitude longitude value of sampling sites recorded in Global Positioning System (GPS) and entered NI value as attribute of the layer. Then by kriging interpolation, different maps for pH, organic carbon, available nitrogen, phosphorus and potash were generated. The maps were classified based on NI value. Soil fertilizer recommendation map was generated for major crops growing by farmers based on status of soil fertility. Based on land use land cover, soil site suitability for different crops and soil fertility status, an alternate land use action plan was suggested for the study area. ArcGIS 10.0 software has been used for visual interpretation of images, attribute database generation and its linking to maps, interpolation, GIS analysis and preparation of various thematic maps.
3. Results and Discussion
3.1. Land Use Land Cover
The land use land cover identified from the satellite image are forest, wasteland with scrub and barren rocky area, cultivated, built up and water body (Figure 2). The forest area covers 150 Sq∙Km (48.4% of TGA) which includes notified forest (0.2% of TGA) and community/ private forest (48.2% of TGA). Wasteland occupies 89.9 Sq∙km (28.8% of TGA) that includes scrubland (25.4% of TGA) and barren rocky area (3.4% of TGA). The cultivated area is mostly rain fed crop covers 42.45 Sq∙Km (13.6% of TGA). Built up and water body covers an area of 25.7 Sq∙Km (8.2% of TGA) and 284 ha respectively. The present land use land cover map was compared with LULC map prepared under NRC LULC 50 K project at NESAC using LISS III image of 2005-2006. It is observed that there is change in land use in about 1243.95 ha area. The major change observed is in forest cover which is reduced and 78.5 ha new built up areas has come up. Due to deforestation 1165.5 ha forest land is converted to wastelands with scrub and 48.3 ha area are converted to built up. It is also observed that 21.6 ha agriculture land is converted to built up.
3.2. Slope
The slope map derived from Carto DEM (10 m) shows seven slope classes (Figure 2) viz. nearly level to level (0% - 1%), very gently sloping (1% - 3%), gently sloping (3% - 8%) moderately sloping (8% - 15%), moderately steep sloping (15% - 30%), Steeply sloping (30% - 45%) & very steeply sloping (>45%). Major area is under moderately steep sloping to very steeply sloping land (62.5% of TGA) supporting forest and wastelands. Nearly level to moderately sloping lands cover 37.5% area of TGA where traditional agriculture i.e. bun cultivation is mostly practiced in 42.45 Sq∙Km area.
3.3. Physiography
Based on interpretation of satellite image which is supported by toposheets and ground truth data, five major physiographic units namely structural hills, denudational hills, plateau and intermontane valley were identified (Figure 2). It is observed from the study that the most dominant physiographic unit of the study area is Hogback type structural hills that occupy 271.5 Sq∙Km (87.4% of TGA). The 2nd most dominant physiographic unit is Massive type denudation hills that cover 20 Sq. Km area (6.4% of TGA) which are found in the eastern and western part of the study area (Figure 2). Upper plateau area (3% of TGA) is spreading in the North West part of the block. Intermontane valley covers an area of 7.8 Sq∙Km (2.5% of TGA).
3.4. Soil Map
The soil map was prepared by visual interpretation of the remote sensing data followed by extensive ground truth (field survey) to study soil profile, analysis of soil samples, classification of soil and delineation of soil boundary by establishing correlation of soil with landscape, physiography, slope and land use land cover [22]. Ten soil series were tentatively identified and mapped as soil series and their association (Figure 2).
The soils of the study area belongs to 2 orders, 3 sub orders, 6 great groups, 8 sub groups (Table 2). Ultisols is the most dominant soil type that covers 162 Sq∙Km (52% of TGA) and Alfisols covers 148 Sq∙Km (48% of TGA). Udalf is the most dominant sub order that occupy 148 Sq∙Km followed by Humult and Udult covers 43.4% and 8.8% area of TGA respectively. Soils are deep to very deep and soil texture varies from sandy clay loam to clay.
Land capability classification is an interpretative grouping of soil mapping units mainly based on inherent soil characteristics, external land features and environmental factors that limit the use of land for agriculture, pasture, or other uses on a sustained basis [20]. The soils of the study area were grouped into 2 capability classes (i.e. II & III) and 2 sub classes. Subclasses were assigned on the basis of kind of predominant hazard, limitation or conservation problem. The study indicates that about 57.3% areas have got land capability sub-class IIt because of gently sloping to moderately slope with slight to moderate erosion and excessive drainage that reduces the choice of crops. About 132.8 Sq∙Km. (42.8% of TGA) area is found under capability class III with limitations of moderate sloping associated with moderate erosion and excessive drainage which make this land moderately cultivable that requires careful selection of crops adapted to slope with soil conservation measures.
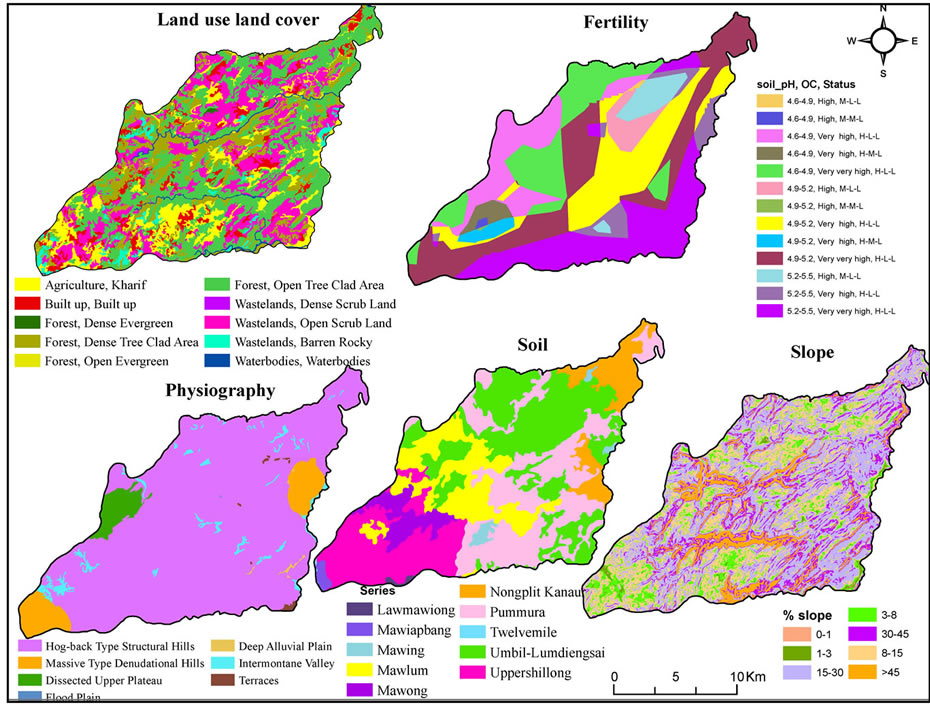
Figure 2. Characterization of land use land cover, slope, physiography, soil and soil fertility.
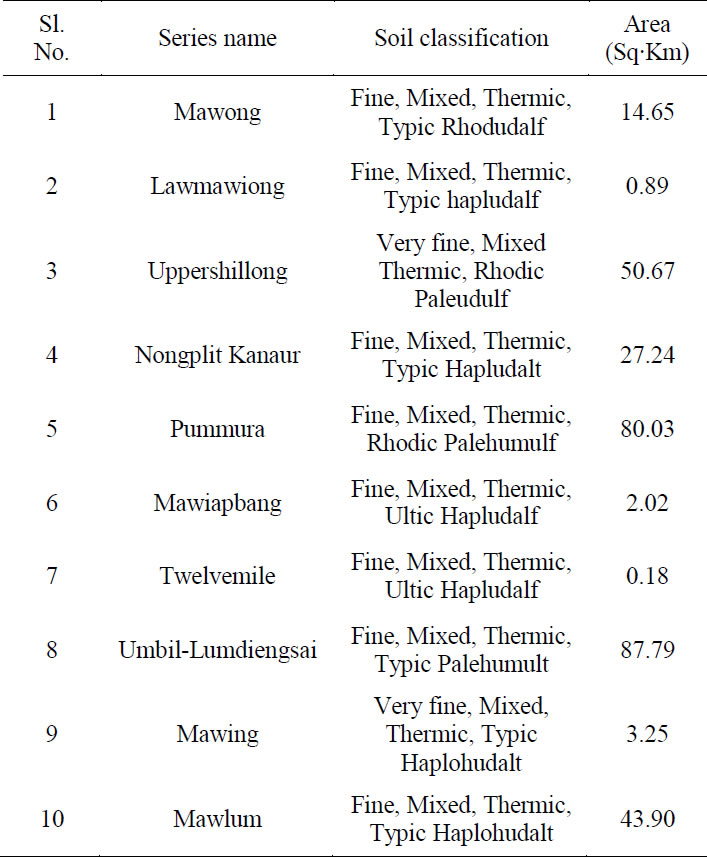
Table 2. Area under different soil series.
3.5. Soil Fertility Mapping
The soil fertility map was prepared by interpolating locations of surface soil sample collection sites. The sample analysis results were linked to point layer and map was generated using the ArcGIS software contains result on soil pH, organic carbon, available N, P, K. The availability of N, P, K and organic carbon were grouped into three fertility classes based on level of acceptance of critical limits. The soil of the block is moderately acidic (4.6 - 5.5) in reaction which is again classified into 3 classes based on pH value (Figure 2).
The soil of the study area contains high percent of organic carbon (Figure 2) which is again classified into 3 classes namely very very high (2.87% - 3%), very high (2.74% - 2.87%) and high (2.61% - 2.74%). From the organic carbon status map it is observed that 56.8% area of TGA is having very very high organic carbon followed by very high (35.8% of TGA) and high (7.3% of TGA) organic carbon which is a indication of medium to high availability nitrogen for crops. The availability of phosphorus in the soil is low to medium that covers 96.8% and 3.2% area of TGA respectively (Figure 2). Potassium availability of the soils of the entire study area is low (Figure 2) which is further classified into 3 classes as extremely low (11% of TGA), very low (29.6% of TGA) and low that covers 184.8 Sq∙Km area (59.5% of TGA). Based on the availability of NPK status a fertilizer recommendation map was prepared for potato, tomato, cabbage, cauliflower, Ginger which is the major crops grown in the study area.
3.6. Suitability of Soils for Crops
The suitability of soils for orange (Figure 3) indicates that 81% of the soils of the study area moderately and marginally suitable with limitation of topography (t) and fertility (f). The soils which are not suitable for orange is associated with the limitation of topography (moderately steep to very steep slope). The suitability of soils for pineapple (Figure 3) indicates that 95% of soils of the study area are marginally suitable with severe limitation of topography (slope and erosion) and in some areas fertility (soil pH). The remaining 5% area is not suitable because of very steep slopes.
3.7. Suggested Action Plan
The action plan map for the block has been prepared by integrating the land use/land cover, soil map, soil fertility map, fertilizer recommendation map and soil site suitability map of orange and pine apple and a composite land unit (CLU) map was prepared. The CLU map was reclassified based on interventions or suggested land use. The action plan includes areas for afforestation, intensive cultivation, in the existing cropped areas with soil conservation measures like mulching, zero tillage etc. and orange and pine apple plantation in open scrub lands which are cultivable wastelands. Afforestation is suggested in 99.28 Sq∙Km area that includes the open evergreen forest, open tree clad areas and dense scrub lands with climatically adapted fast growing tree species including multipurpose/high energy bio-fuel plants with soil conservation measures like contour bunding, gully plugging and continuous contour trenches should be opened for checking run off and soil erosion (Shweta et al. 2010). Existing agricultural areas (41.4 Sq∙Km) are suggested for intensive cultivation of potato, tomato, Ginger, Cabbage and Cauliflower. Orange and pine apple plantation is suggested in the wastelands with open scrub (76.6 Sq∙Km). Based on suitability of soils of open scrubland for orange and pine apple, 44.9 Sq∙Km area is suggested for orange plantation because these areas are moderately to marginally suitable for orange but not suitable for pine apple, 9.2 Sq∙Km area for pine apple because orange is not suitable for these areas. Since 21.9 Sq∙Km. area is suitable for both orange and pine apple these areas are suggested either for orange or for pineapple. The remaining areas (i.e. 2 Sq∙Km) which are not suitable for orange and pineapple are suggested for afforestation (Figure 3).
4. Conclusion
The visual interpretation of remote sensing data has faci-
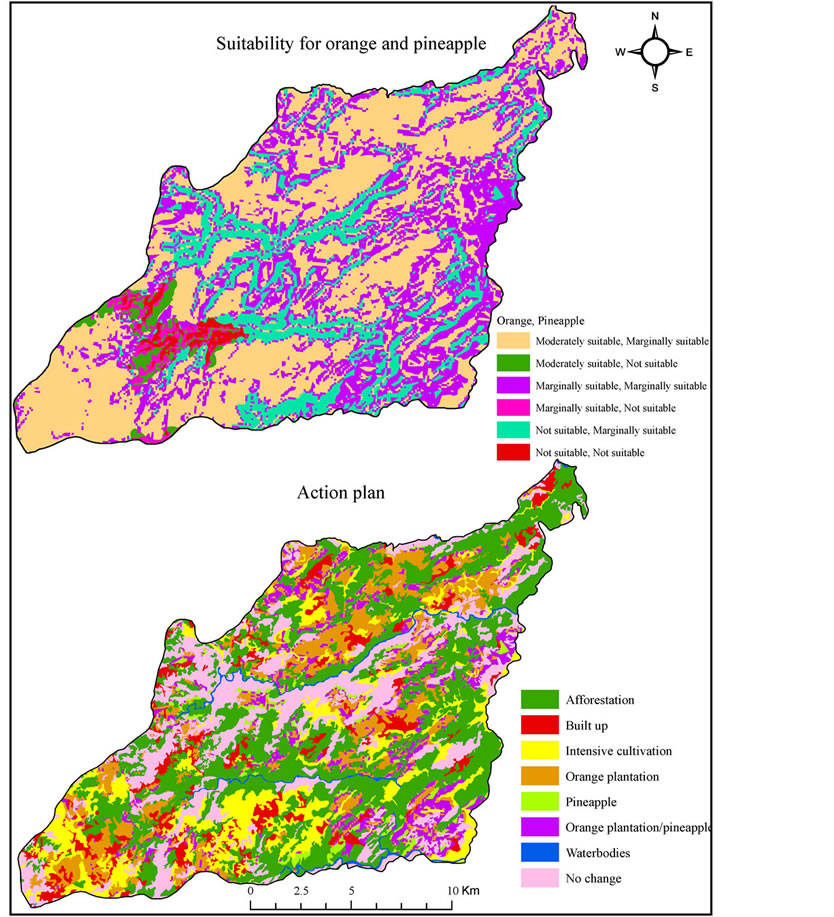
Figure 3. Land evaluation maps depicting suitability for orange and pine apple.
litated the characterization of the study area in terms of land use, land cover, physiography, slope and soils with less time, cost and labour. The GIS technique helps in generating soil fertility map by interpolating soil analysis data of different locations, land evaluation and suggesting alternate land use plan along with fertilizer recommendation map. The study reveals that Hog-back type structural hills are the most dominant physiographic unit of the study followed by massive type denudation hills, upper plateau and Intermontane valley. Forest is the most dominant land cover of the block followed by wastelands and agriculture. The soils of the study area are moderately acidic, deep to very deep and texture varies from sandy clay loam to clay. The soils are very reach in organic carbon and nitrogen availability to plant is medium to high. The availability of phosphorus in the soil is low to medium and potassium availability of the soils of the entire study area is low. The different maps generated will serve as guide for technicians and farmers on the effective management of their farms by using the right kind and amount of fertilizers. The soils of the study area were grouped into land capability class II & III and the soils are moderately to marginally suitable for orange and marginally suitable for pine apple. Based on soil properties, site characteristics, land use/land cover, soil fertility status and soil site suitability for orange and pine apple alternate land use has been suggested. Open forest and wastelands with dense scrub are suggested for plantation with multipurpose and fast growing climatically adopted tree species. Intensive cultivation of major crops of the study area is suggested in existing agriculture area with good soil and water conservation practices. Orange and pine apple plantation is suggested in the wastelands with open scrub. The suggested land use and interventions based on natural resource inventory will help in land resource management in the study area.
REFERENCES
[1] T. Garnett, M. C. Appleby, A. Balmford, I. J. Bateman, T. G. Benton, P. Bloomer, B. Burlingame, M. Dawkins, L. Dolan, D. Fraser, M. Herrero, I. Hoffmann, P. Smith, P. K. Toulmin, C. Thornton, S. J. Vermeulen and H. C. J. Godfray, “Sustainable Intensification in Agriculture: Premises and Policies,” Science, Vol. 341, No. 6141, 2013, pp. 33-34. http://dx.doi.org/10.1126/science.1234485
[2] R. Lal, “Soils and India’s Food Security,” Journal of the Indian Society of Soil Science, Vol. 56, 2008, pp. 129- 138.
[3] National Remote Sensing Agency, “In Manual: Nationwide Mapping of Land Degradation Using Multi-Temporal Satellite Data,” 2007.
[4] H. Jenny, “Factors of Soil Formation,” McGraw Hill Publisher, New York, 1941.
[5] R. L. Wright, “An Evaluation of Soil Variability over Single Bedrock Type in Part of Southeast Spain,” Catena, Vol. 27, No. 1, 1996, pp. 1-24. http://dx.doi.org/10.1016/0341-8162(96)00004-5
[6] R. Srivastava and R. K. Saxena, “Technique of Large Scale Soil Mapping in Basaltic Terrain Using Satellite Remote Sensing Data,” International Journal of Remote Sensing, Vol. 25, 2004, pp. 679-688.
[7] M. Kudrat, A. K. Sinha and M. L. Manchandra, “Multilevel Soil Mapping Using IRS IC WiFS, LISS III and Pan Data,” Indian Space Research Organisation, Bangalore. 2000.
[8] A. E. Shukla, J. Prasad, M. S. S. Nagaraju, R. Srivastava and D. L. Kauraw, “Use of Remote Sensing in Characterisation and Management of Dhamni Micro-Watershed of Chandrapur District of Maharastra,” Journal of Indian Society of Remote Sensing, Vol. 58, 2009, pp. 64-69.
[9] B. P. Girish, M. S. S. Nagaraju, J. Prasad and R. Srivastava, “Characterization, Evaluation and Mapping of Land Resources in Lendi Watershed, Chandrapur District of Maharastra Using Remote Sensing and GIS,” Journal of the Indian Society of Soil Sciences, Vol. 58, 2010, pp. 442-448.
[10] T. Das. Pratibha, “Study of the Soils of Deepor Beel Catchment in Relation to Soil Forming Factors Using Remote Sensing and GIS,” Indian Journal of Soil Conservation, Vol. 38, No. 2, 2010, pp. 94-100.
[11] R. B. Rashmi, R. Srivastava, M. S. S. Nagaraju and J. Prasad, “Characterization and Evaluation of Land Resources for Watershed Management in Vidabha Region of Maharastra Using RS & GIS,” Journal of the Indian Society of Soil Science, Vol. 60, No. 4, 2012, pp. 261-268.
[12] C. Sys, V. Ranst, J. Debaveye and F. Beernaert, “Land Evaluation Part III, Crop Requirements,” Agricultural Publication No. 7, ITC Ghent, 2008.
[13] S. V. Bobade, B. P. Bhaskar, M. S. Gaikawd, P. Raja, S. S. Gaikwad, S. G. Anantwar, S. V. Patil, S. R. Singh and A. K. Maji, “A GIS Based Land Use Suitability Assessment in Seoni District, Madhya Pradesh, India,” Tropical Ecology, Vol. 51, No. 1, 2010, pp. 41-54.
[14] H. M. Stout and B. D. Lee, “Land Use Planning Exercise Using Geographic Information System and Digital Soil Survey,” Journal of Natural Resource Life Science & Education, Vol. 33, 2004, pp. 11-15.
[15] Y. S. Seok, S. D. Hong and J. H. Ahn, “Soil Fertility Evaluation by Application of Geographic Information System for Tobacco Fields,” Journal of Korean Society of Soil Science and Fertilizer, Vol. 21, 1999, pp. 36-48.
[16] S. D. Hong and H. T. Park, “Soil Fertility Evaluation with Adoption of Soil Map Data Base for Tobacco Fields,” Journal of Korean Society of Soil Science and Fertilizer, Vol. 32, 1999, pp. 95-108.
[17] Anon, “In Project Report: Soil Fertility Mapping of Mawryngkneng Community and Rural Development Block,” 2010, pp. 12-16.
[18] T. M. Lillisand and R. W. Keifer, “Remote Sensing and Image Interpretation,” John Wiley, Singapore, 2004.
[19] IARI, “Soil Survey Manual,” All India Soil and Land Use Survey, IARI, New Delhi, 1970.
[20] FAO, “FAO Guidelines for Soil Profile Description,” Rome, 1977.
[21] SLUSI, “Annual Report,” IARI, New Delhi, 2008.
[22] Klingebiel and Montgomery, “Land Capability Classification, USDA Handbook,” US Government Pr. Office, Washington DC, 1966, 21 p.