Journal of Minerals and Materials Characterization and Engineering
Vol.1 No.2(2013), Article ID:29195,6 pages DOI:10.4236/jmmce.2013.12010
Corrosion Behavior of Cu-Zn-Ni Shape Memory Alloys
1Department of Mechanical Engineering, Dr. Ambedkar Institute of Technology, Bangalore, India
2Department of Mechanical Engineering, Siddaganga Institute of Technology, Tumkur, India
Email: ssiitm@yahoo.co.in
Received November 5, 2012; revised January 12, 2013; accepted February 16, 2013
Keywords: Shape Memory Alloys; Shape Memory Effect; Corrosion
ABSTRACT
Four shape memory alloys of Cu-Zn-Ni, in the range of 35 - 55 wt% of Cu, 43 - 60 wt% Zn and 2 - 9 wt% Ni, were prepared by ingot metallurgy route in an induction furnace under an inert atmosphere. The shape memory effect was tested by bend test. The alloys were further tested for its corrosion behavior in fresh water, Hank’s solution and sea water. From the results it was observed that the alloys exhibit high corrosion resistance in fresh water when compared to Hank’s solution and sea water. And it was also observed that the alloys exhibit better corrosion resistance in Hank’s solution than in sea water.
1. Introduction
During the last decade smart materials and structures have received increasing attention because of their high scientific and technological significance. Shape memory alloys are the most important branch from the smart and/or intelligence materials [1]. The term “Shape memory alloys” (SMAs) refers to that group of metallic materials that have the ability to return to some previously defined shape or size when subjected to appropriate thermal cycle. Among the many alloy systems which exhibit Shape Memory Effect (SME), Ni-Ti, Cu-Al-Ni and Cu-Zn-Al SMAs have been studied extensively [2,3] and are commercially exploited. The Ni-Ti SMAs, in particular, are used extensively in many engineering and biomedical applications. Some of the disadvantages that these alloys suffer from are low transformation temperatures, difficulty in production and processing, and high cost. Most of the copper-based shape memory alloys are easy to produce and process and are also less expensive when compared to Ni-Ti shape memory alloys. However, Cu-Al-Ni and Cu-Zn-Al shape memory alloys in the polycrystalline state are brittle and cannot, therefore, be easily worked due to the high degree of order and high elastic anisotropy of the parent β-phase (austenite) [4].
In practical applications, as the alloys are exposed to different corrosion media for a longer period of time they are prone to corrosion and pitting. Therefore study of corrosion potential and pitting potential of the alloys are necessary before they are put into biomedical and industrial applications. From literature it was observed that corrosion rate of austenite was more than martensite (quenched) in Cu-Al-Ni SMAs. It was also observed that the current density for sample in austenitic structure is much greater than for martensitic structure. This demonstrates that shape memory alloys have more corrosion resistance than tradition alloys due to hyper elastic behavior of polycrystalline structure [5]. It is also reported that ordering in SMAs caused by phase transformation has an effect on the corrosion behavior of Cu-Al-Ni shape memory alloys. Nickel containing copper based alloys also finds extensive applications in orthodontics, including metallic brackets, archwires, bands, springs and ligature wires. For most materials, a rough surface promotes corrosion. Since SMAs find a wide application in the marine, aerospace applications and it is also used in the medical application like Stents, these are the most effective components for treating heart coronary diseases, so it becomes necessary that the shape memory alloys be biocompatible to the environment in which it is being used, so it is important to evaluate the corrosion behavior of the SMAs and also to improve the corrosion resistance of the alloy [6]. Cu-Zn-Ni shape memory alloys are another class of alloy system which exhibit shape memory effect and there is lack of literature available on the corrosion behavior of Cu-Zn-Ni shape memory alloys. Hence this paper deals with the corrosion behavior of the Cu-Zn-Ni SMAs indicated in Table 1.
2. Experimental Procedure
2.1. Alloy Preparation
Pure copper, zinc and nickel were taken in right quantities and melted together in an induction furnace under an inert argon atmosphere as shown in Figure 1. The molten alloy was poured into a cast iron mould of dimensions 50 mm × 100 mm × 3 mm and allowed to solidify. The ingots were then homogenized at 800˚C in the β-phase for 6 h under an argon atmosphere. The homogenized alloys were hot rolled at 800˚C to a thickness of 1 mm. The hot rolled samples were again homogenized for 30 min at 800˚C and step quenched into a hot water bath (100˚C), followed by quenching into water at room temperature (30˚C). Step quenching was used to avoid quench cracks and the pinning of martensites by excess quenched in vacancies retained on quenching from a high temperature. Optical Microscope was used to study the microstructure of the alloys.
2.2. Corrosion Test Procedure
The prepared shape memory alloy was cut into flat rectangular shape of dimension 20 mm × 20 mm × 1 mm were used for corrosion test. These specimens were finely polished using emery papers and then polished with Al2O3 powder. First the micrographs of the polished surfaces were imaged using the optical microscope before subjecting them to corrosion studies. Depending on the main applications of SMAs, three corrosion media i.e. fresh water, sea water and Hanks solution (simulates the body solution) were selected for the study. Sea water was
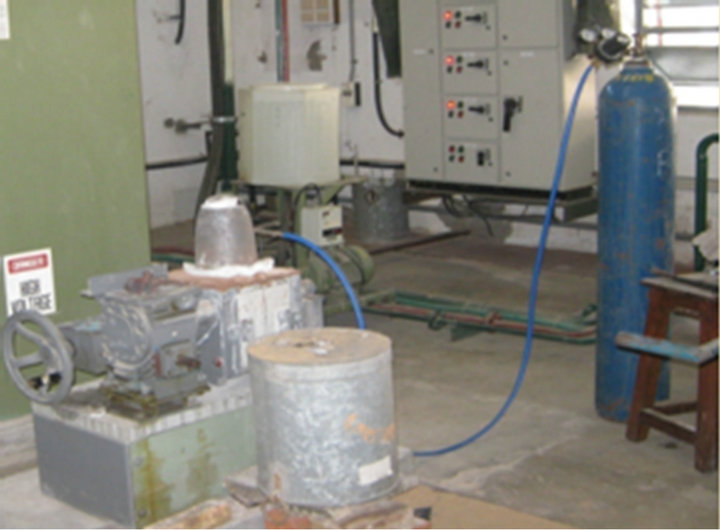
Figure 1. Alloy preparation setup consisting of induction furnace and argon cylinder.
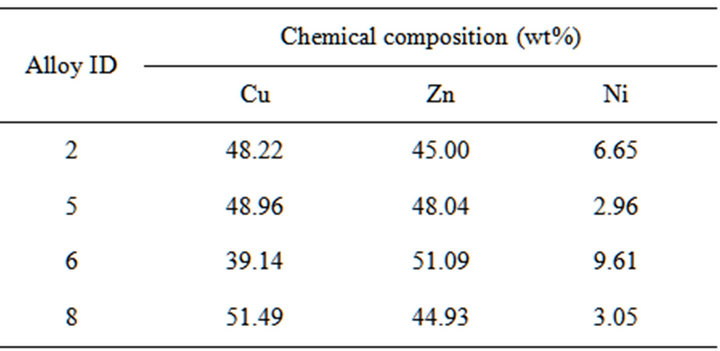
Table 1. Chemical composition of Cu-Zn-Ni alloys.
prepared as per ASTM D 1141-98 (Reapproved 2003) and the Hanks solution was prepared as per the literature [7]. A three-electrode electrochemical cell was used as a polarization test cell. Standard calomel electrode was used as a reference electrode and graphite as a counter electrode. Potentio-dynamic polarization measurements were performed on a Princeton Applied Research Potentiostat at a scan rate of 5 mV/min. The samples were kept in solution for 15 min before polarization for stabilization. A cyclic polarization scan was conducted for the alloys from −700 to +1000 mV (versus OCP).
2.3. Preparation of Substitute Ocean Water
Ocean water was prepared in the laboratory as per ASTM D 1141-98 (Reapproved, 2003). Three stock solutions were prepared as indicated below in Table 2 and then mixed as per required proportions to make 2.5 liters of ocean water.
Note: The addition of AgNO3 to the above solution was made by dissolving 0.049 g of AgNO3 in water and diluting it to 1 Liters. 10 ml of this solution was added to Stock Solution No. 3 before diluting it to 2.5 liters.
2.5 liters of substitute ocean water was prepared by dissolving 61.335 g of sodium chloride and 10.235 g of anhydrous sodium sulfate in 2 liters of water. 200 ml of Stock Solution No. 1 was slowly added with vigorous stirring and then 25 ml of Stock Solution No. 2 was added to it and stirred. It was diluted to 2.5 liters and the pH was adjusted to 8.2 using a few milliliters of 0.1 N sodium hydroxide solutions.
Note: The solution was prepared and the pH was adjusted immediately prior to use.
2.4. Preparation of Hanks Solution
Table 3 gives the salts used in the preparation of Hank’s Solution. The following salts were dissolved in 1 liter of distilled water. The pH was maintained at 7.2 at a temperature of 37˚C [7,8].
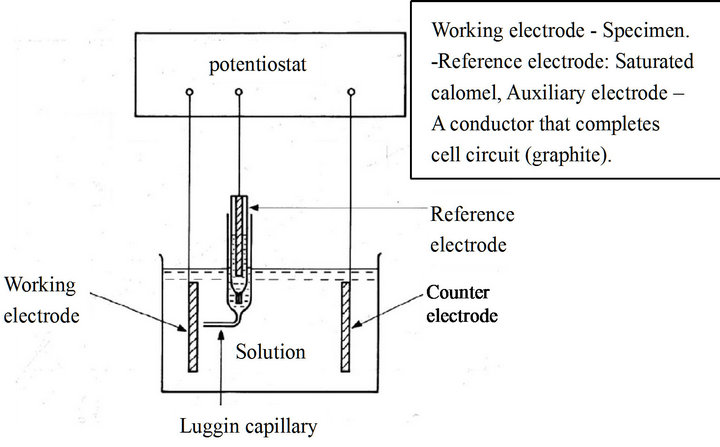
The solution simulates the body solution and was used for the corrosion studies of the alloys. The schematic diagram of the setup and photographs of the setup are shown in Figures 2(a) and (b). The standard test cell requires 150 ml of test solution. The sample was then placed in the cell and the electrodes were kept in their respective positions as shown in Figure 2(a) the area of exposure of the sample to the electrolyte solution is 0.16 cm2. The reference electrode and counter electrode were placed in their respective holders and connected to the potentiostat. A saturated calomel electrode was used as the reference electrode and a graphite electrode as the counter electrode during the test. The process of corrosion and its measurement is controlled by the software (Princeton Applied Research 352 SoftCorrTM III Corro-
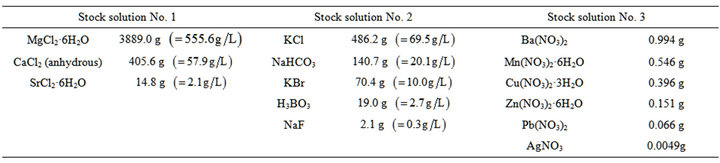
Table 2. Preparation of substitute ocean water.
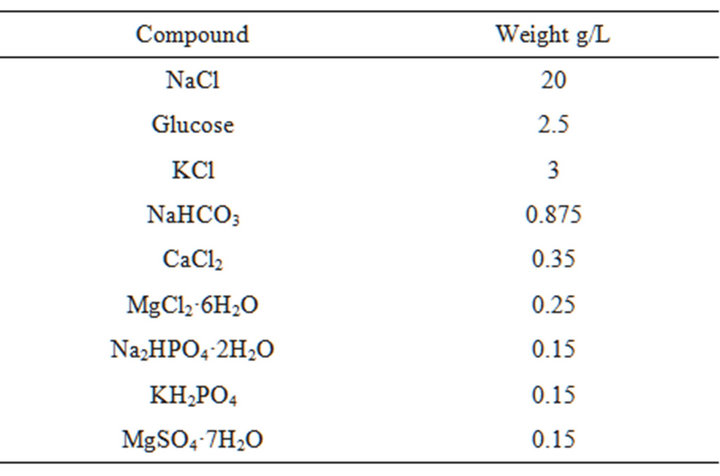
Table 3. Preparation of hanks solution.
 (a)
(a)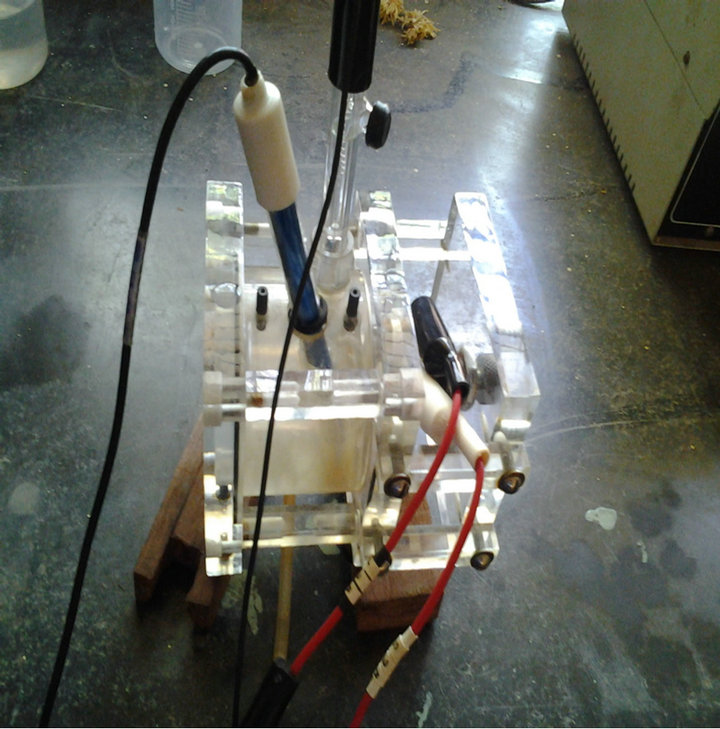 (b)
(b)
Figure 2. (a) Schematic diagram of an electrochemical cell. (b) Photography of the electrochemical testing set up.
sion Measurement). This maintains the voltage in the circuit and the current values are measured and the output is given in the form of E-I plot. The corrosion potentials Ecorr and Epit were determined for all the alloy samples considered. The microstructure of the surface of the alloy specimens after corrosion was imaged using an optical microscope and analyzed.
3. Results and Discussion
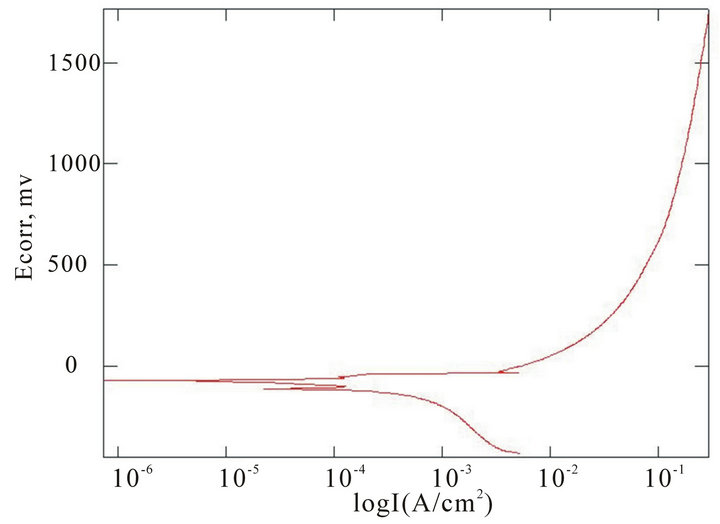
The chemical composition of the alloys considered for the study with the corresponding Ecorr and Epit values in three corrosion media, i.e. fresh water, hanks solution and sea water, are given in Table 4. Corrosion is the chemical or electrochemical reaction between a material, usually a metal, and its environment, that produces a deterioration of the material and its properties. The corrosion potentials Ecorr and Epit were determined for the alloy samples considered in three corrosion media. The point where the depletion of the passive layer on the surface of the material begins is given by Ecorr and the point where the passive layer is completely depleted leading to the formation of pits in the material is given by Epit. It can be observed that these alloys exhibit good corrosion resistance in fresh water when compared to sea water and Hank’s solution. From the corrosion potential plot for the alloy sample 2 in Distilled water shows no pitting. The corrosion potential plots of the alloys 2, 5, 6 and 8 obtained by the corrosion test using electrochemical cell with potentiostat which marks the Ecorr and Epit potentials of the alloys are shown in Figure 3. It can be observed from Table 1 and Figure 3 that as the content of nickel increases the corrosion resistance of the alloys increases. It can also be observed that as the zinc concentration increases the corrosion resistance also increases. The alloys exhibit better corrosion resistance in Hanks solution than sea water; this is due to the more concentration of Cl– ions in the solution of sea water which causes more corrosion and finally leading to pitting as evinced from the results. It can also be observed from Figure 3 that the corrosion potential of the alloys moves towards more positive side as the nickel and zinc concentration increases. It can also be observed from Table 4 that pitting happens early in sea water whereas it moves to fur-
 (a)
(a)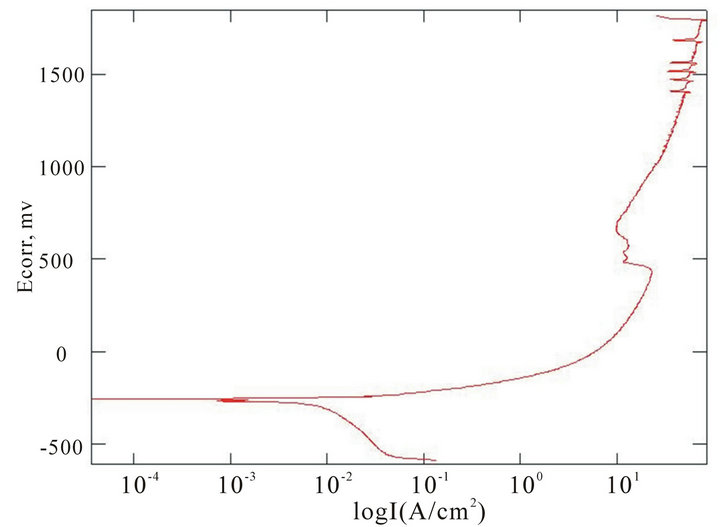 (b)
(b)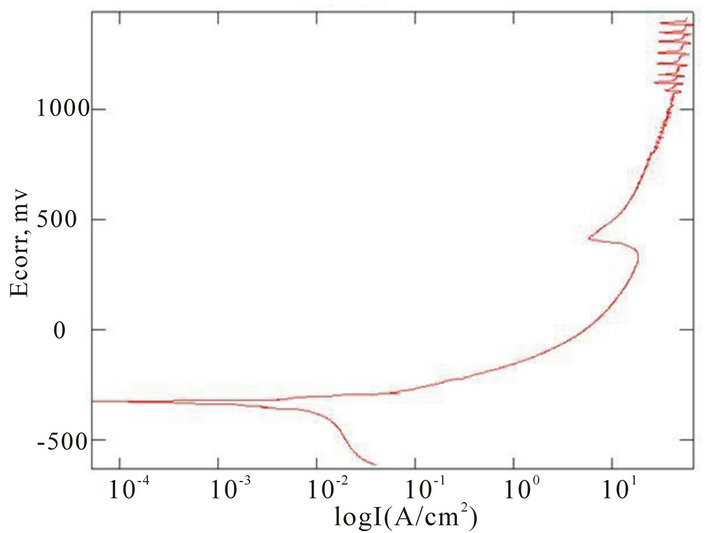 (c)
(c)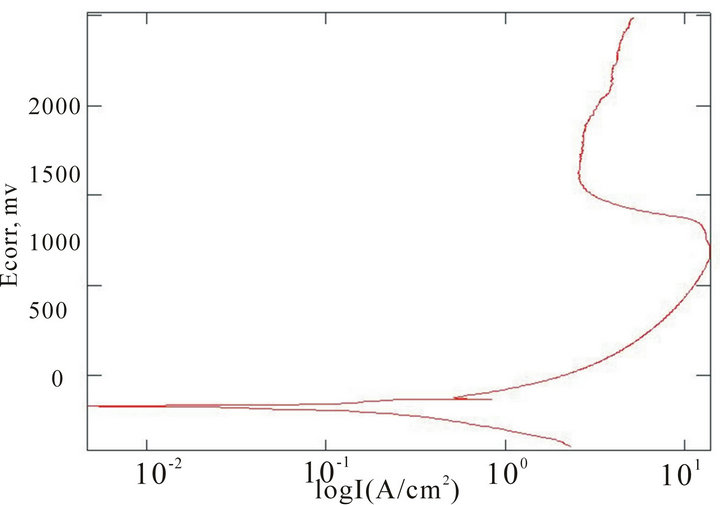 (d)
(d)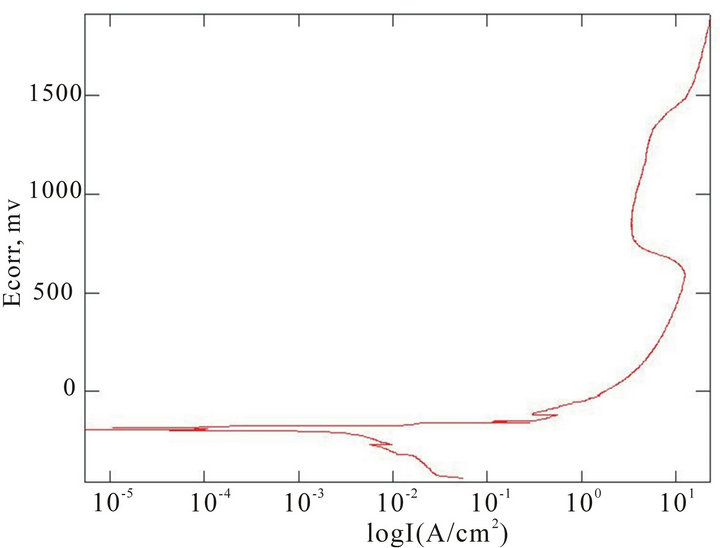 (e)
(e)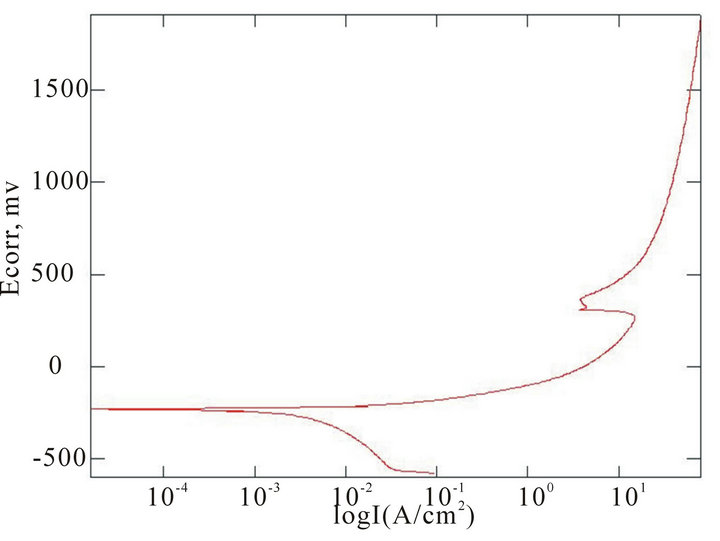 (f)
(f)
Figure 3. Corrosion potential plots of Cu-Zn-Ni SMAs. (a) Sample 2 in fresh water; (b) Sample 2 in sea water; (c) Sample 6 in sea water; (d) SAMPLE 6 in hank’s solution; (e) Sample 5 in hank’s solution; (f) Sample 8 in sea water.
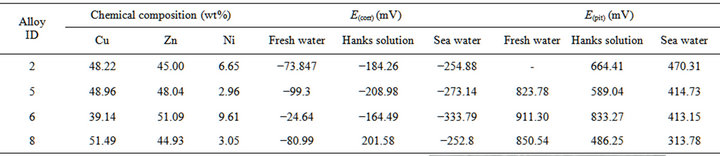
Table 4. Chemical composition and corrosion potentials of Cu-Zn-Ni SMAs.
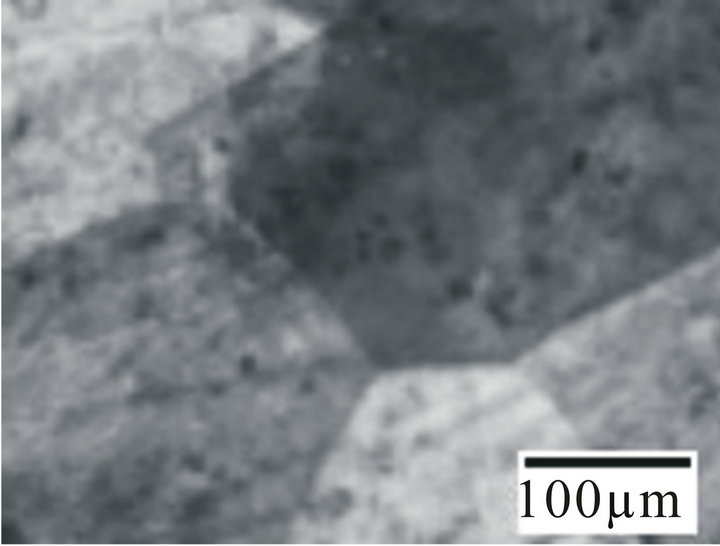
ther higher side in Hanks solution indicating better pitting resistance in Hanks solution than in sea water. Figure 4 shows the optical micrographs of the alloy samples before (Figure 4(a)) and after corrosion in fresh, Hanks solution and Sea water (Figures 4(b)-(d)). From Figure 4(b) it can be observed that the alloy undergoes a very
 (a)
(a)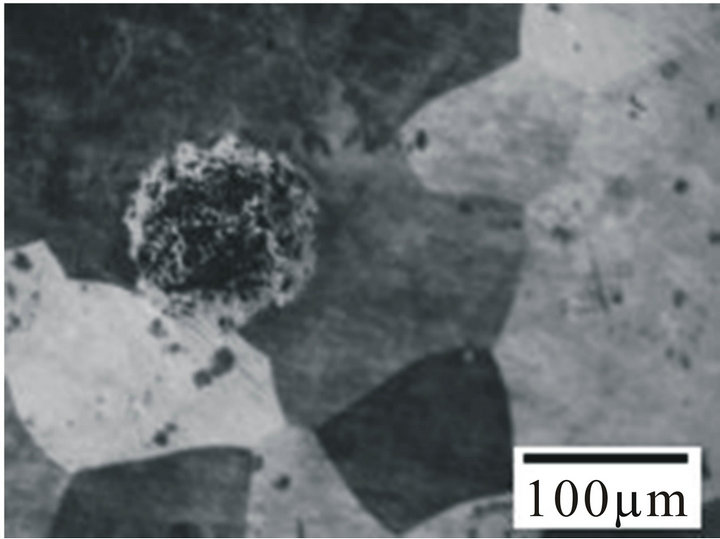 (b)
(b)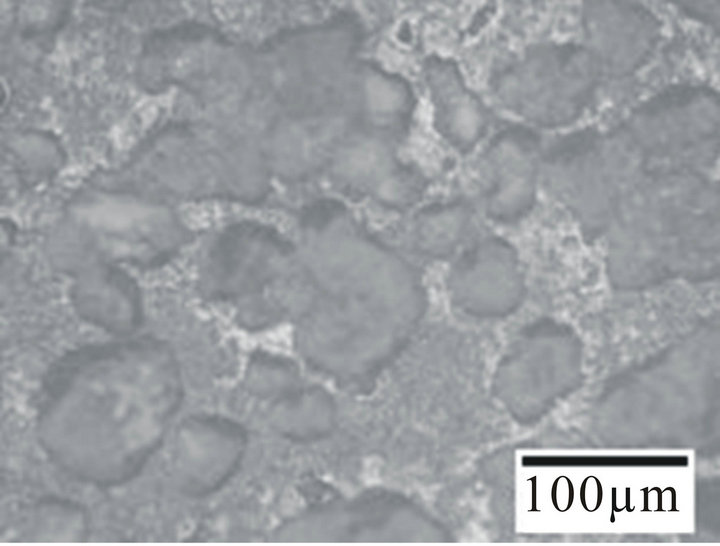 (c)
(c)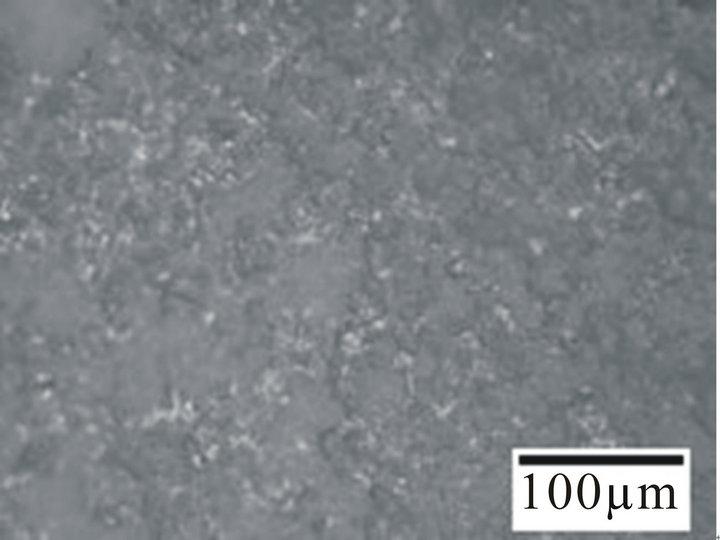 (d)
(d)
Figure 4. Optical micrographs of the alloy sample 6 (a) before corrosion; (b) After corrosion in fresh water; (c) After corrosion in sea water; (d) After corrosion in hanks solution.
slow and uniform corrosion and as such no changes in the surface structure was observed. From Figures 4(c) and (d) it can be observed that the alloys initially undergo uniform corrosion and after some time there is formation of pits. The pits formed on the surface of the alloy samples in Hanks solution were shallower and lesser in diameter. The pits formed in sea water (Figure 4(d)) were deeper and wider when compared to Hanks solution. This clearly indicates that the Hanks solution and Sea water has a remarkable and deteriote effect on the alloy samples, hence it might not prove to be a promising candidate for biomedical application. So care should be taken before employing it for biomedical applications.
3.1. Shape Memory Effect (SME)
The alloys were tested for its shape memory effect by using a semi empirical bend test as shown in Figure 5 [9]. The sheet specimens were bent to a U-shape in its martensitic phase by applying an initial strain of 2% around a round bar of diameter 50 mm. The alloys were then heated to above their austenitic finish temperature. The corresponding angles of bend before heating and after heating to above their austenitic finish temperature were measured. The percentage of strain recovery by shape memory effect was determined by using the relation:
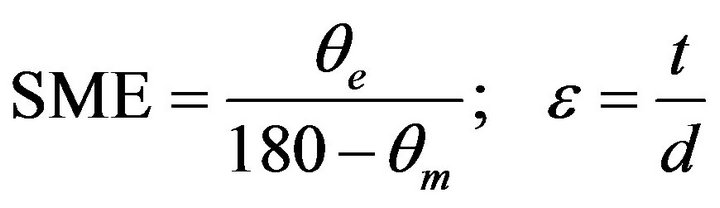
where θe = angle recovered on unloading, d = 50 mm, t = 1 mm, e = 2%, and θm = angle recovered on heating.
These alloy exhibit significant strain recovery by SME. Table 5 gives the amount strain recovery by shape memory effect of the Cu-Zn-Ni SMAs.
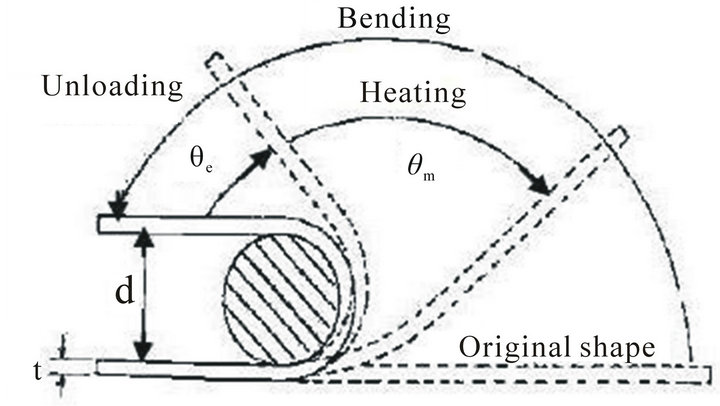
Figure 5. Schematic diagram of the bend test to determine strain recovery by SME.
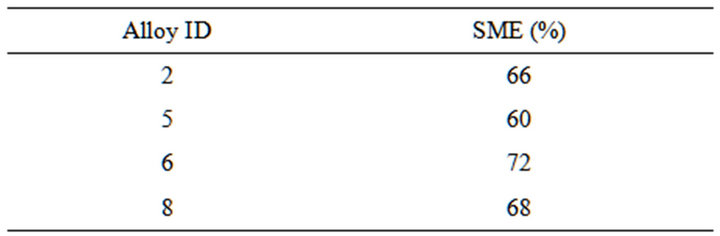
Table 5. The strain recovery by shape memory effect.
4. Conclusions
1) From the above results with increasing the wt% of the Ni content from 2 - 9 the corrosive resistance property of the alloy also increases in the entire three corrosive medium.
2) It can be observed that these alloys exhibit good corrosion resistance in fresh water when compared to sea water and hanks solution.
3) Increasing the zinc concentration increases the corrosion resistance of the alloys.
4) Since nickel is allergic and there is pitting occurring in the alloy samples in Hanks solution, it cannot be a promising alternative for biomedical application.
5) The alloys exhibit significant shape memory effect.
REFERENCES
- Z. G. Wez, R. Sandstrom and S. Miyazaki, “Review Shape Memory Materials and Hybrid Composites for Smart Systems,” Journal of Materials Science, Vol. 33, No. 15, 1998, pp. 3743- 3762. doi:10.1023/A:1004692329247
- T. W. Duerig, K. N. Melton, D. Stockel and C. M. Wayman, “Engineering Aspects of Shape Memory Alloys,” Butterworth Heinemann Publishing, London, 1990, pp. 3-20.
- K. Otsuka and X. Ren, “Martensitic Transformation in Non Ferrous Shape Memory Alloys,” Materials Science and Engineering A, Vol. 273-275, 1999, pp. 89-105.
- B. Y. Chen, C. H. Liang, D. J. Fu and D. M. Ren, “Corrosion Behavior of Cu and Cu-Zn-Al Shape Memory Alloy in Simulated Uterine Fluid,” Contraception, Vol. 72, No. 3, 2005, pp. 221-224. doi:10.1016/j.contraception.2005.04.006
- Abdul Raheem K. Abid Ali and Zuheir T. Khulief Al-Tai, “The Effect of Iron Addition on the Dry Sliding Wear and Corrosion Behavior of Cu Al Ni Shape Memory Alloy,” Engineering and Technology Journal, Vol. 28, No. 24, 2010, pp. 6888-6902.
- T. Eliades and A. E. Athanasiou, “In Vivo Aging of Orthodontic Alloys: Implications for Corrosion Potential, Nickel Release, and Biocompatibility,” The Angle Orthodontis, Vol. 72, 2002, pp. 222-237.
- Y. F. Zheng, B. L. Wang, J. G. Wang, C. Li and L. C. Zhao, “Corrosion Behavior of Ti-Nb-Sn Shape Memory Alloys in Different Simulated Body Solutions,” Materials Science and Engineering A, Vol. 438-440, 2006, pp. 891- 895. doi:10.1016/j.msea.2006.01.131
- Y. S. Zhang and X. M. Zhu, “Electrochemical Polarization and Passive Film Analysis of Austenitic Fe-Mn-Al Steels in Aqueous Solutions,” Corrosion Science, Vol. 41, No. 9, 1999, pp. 1817-1833. doi:10.1016/S0010-938X(99)00017-7
- U. S. Mallik and V. Sampath, “Influence of Aluminum and Manganese Concentration on the Shape Memory Characteristics of Cu-Al-Mn Shape Memory Alloys,” Journal of Alloys and Compounds, Vol. 459, No. 1-2, 2008, pp. 142-147. doi:10.1016/j.jallcom.2007.04.254