Food and Nutrition Sciences
Vol.5 No.2(2014), Article ID:42091,6 pages DOI:10.4236/fns.2014.52017
Foodservice Quality: Identifying Perception Indicators of Foodservice Quality for Hospitality Students
Department of Restaurant, Hotel and Institutional Management, Fu Jen University, New Taipei City, Taiwan.
Email: 073770@mail.fju.edu.tw
Received October 26th, 2013; revised November 26th, 2013; accepted December 4th, 2013
ABSTRACT
This study uses an expert perspective to identify indicators of foodservice quality as perceived by hospitality students. A 3-round modified Delphi method and an expert panel comprising culinary arts instructors, master chefs with >10 years of experience, and senior foodservice industry executive managers were used to define and identify these indicators. The developed foodservice quality framework includes 2 categories, the product and customer, which comprise 57 indicators in 6 dimensions. The results of this study provide a clear direction for further studies and applications for hospitality professionals, educators, and students.
Keywords:Foodservice Quality; Hospitality Student; Modified Delphi Method
1. Introduction
Foodservice quality is a critical factor influencing the hospitality and dining experience [1] and is a concept that hospitality students must understand and master before beginning their careers in the foodservice industry. Each aspect of foodservice quality must be addressed to satisfy the expectations and needs of the consumer [2]. Furthermore, ensuring the quality of both the food and service is critical for the continuing success of restaurants and foodservice operations [3]. The researchers used a modified Delphi approach, including three anonymous expert evaluation rounds and a survey, to identify the primary indicators of hospitality student foodquality perceptions. The researchers used qualitative statistical and content analyses to validate these perception indicators.
2. Literature Review
The food and beverage (F & B) sector encompasses numerous dimensions, including historical and cultural factors, product development, F & B service, design, product evaluation, physiology, nutrition, psychology, markets, health, environment and space, interpersonal relations, product characteristics, and comprehensive management systems [4]. Foodservice quality requirements that are essential for continued innovation as well as for improved reliability and consistency include consumer-specific preferences, such as nutrition, presentation, and taste, and general performance requirements, such as uniform quality, on-time delivery, product differentiation, and research-and-development (R & D)-based improvements [5,6]. Furthermore, food hygiene is an increasingly important factor that affects consumer trust in the overall food quality [7]. Finally, food safety is of paramount importance to the consumer, food industry, and economy [8].
Therefore, learning about and implementing proper foodservice operations are critical to hospitality education. Hospitality education prepares students for future management positions using curricula that teach hospitality-related technical skills and provide a diverse grounding in business and the social sciences. Coursework is often designed in collaboration with the industry, and practical experience internships are a critical part of the hospitality-education experience [9]. The hospitality industry remains a highly labor-intensive sector of the economy; human resources and human-related factors easily contribute 90% or more to the success or failure of hospitality industry operations [10]. Rapid growth in the hospitality sector and foodservice industry in Taiwan has led to an increased awareness of the importance of foodservice quality. Comprehensive quantitative standards and total-quality-assurance systems implemented by many foodservice operators have achieved significant gains in foodservice quality. Consequently, Taiwan’s higher education institutions have opened and expanded related academic programs in hospitality and foodservice management as well as marketing, tourism, and restaurant marketing. Professional foodservice and culinary education is an important and growing segment of higher education in Taiwan. Most hospitality students have industrial internship experience before graduation [11].
3. Research Methodology
3.1. Study Design and Questionnaire
The Delphi method is a structured approach toward collecting and distilling expert knowledge using a series of questionnaires interspersed with controlled-opinion feedback [12]. To identify and validate the perception indicators, we used a modified Delphi method rather than a traditional Delphi method because the traditional method uses only open questions. The conceptual framework and Delphi survey format were developed for this study under the guidance of the domestic and international literature regarding the hospitality industry foodservice quality, relevant theories, and prior studies on factors affecting the perceptions of foodservice quality held by hospitality and culinary students. The survey included several open questions designed to collect information on new potential foodservice quality indicators. Because foodservice quality addresses interactions with consumers in addition to the physical products, this study considered foodservice quality in terms of six distinct dimensions from two different perspectives: the product and the customer. The dimensions under the product perspective included food character, culinary arts, hygiene, and safety. The dimensions under the customer perspective included environment, ambience, marketing, promotion, and service quality.
The researchers reviewed the literature and generated a preliminary foodservice quality survey instrument based on the relevant findings. Experts were subsequently invited to participate in a series of questionnaire surveys. Invitations were delivered by mail in an opaque envelope, and the recipients were asked to return the enclosed survey questionnaire in the enclosed return envelope within two weeks. During the first round, the survey participants ranked their opinion of each item on a five-point Likert-type scale ranging from “strongly disagree” to “strongly agree”. Participants were also invited to provide additional comments to their responses or additional remarks. A report on first-round analysis results was sent to the participants with an invitation to participate in rounds 2 and 3.
3.2. The Expert Panel
Delbecq, Van de Van, & Gustafson [12] stated that 10 to 15 participants on an expert panel consisting of a homogeneous group should represent an adequate sample. This study enrolled 20 participants in three categories: culinary course instructors, master chefs with >10 years of experience, and senior foodservice industry executive managers. All participants had the practical teaching and industry experiences necessary for a substantive understanding of foodservice quality perceptions prevalent in the foodservice industry and among students.
3.3. Standards for Item Elimination
At the end of the first round, items with average scores below 4.00 and quartile deviations above 1.00 were eliminated. After the second and third rounds, those with average scores below 4.00 were eliminated, and amendments or modifications were performed on the items to conform with participant input [13].
3.4. Standard for Consensus
According to Faherty [13] and Holden and Wedman [14], quartile deviations below 0.60 represent a substantial degree of expert consistence, quartile deviations between 0.60 to 1.0 represent moderate consistency, and quartile deviations >1.0 represent a lack of consensus. Holden and Wedman [14] went further, stating that item stability is achieved and further modification may be discontinued when >85% reach a moderate or better consensus.
4. Results
4.1. First Round
The first-round Delphi results were analyzed to obtain the average, mode, and quartile deviation scores. Items with average scores below 4.00 and quartile deviations equal to or greater than 1 were eliminated. Although the average marketing and promotion dimension scores fell below 4.00 (3.85), this dimension was retained in the second round after discussions with experts and the performance of the subsequent amendments. All other categories and dimensions were preserved without amendment. Some indicators were modified, and new indicators were added for the second-round Delphi process based on participant input. The second Delphi-round instrument included 2 categories, 6 dimensions, and 79 indicators.
4.2. Second Round
The second-round instrument was a semi-open-ended questionnaire developed by eliminating the items noted above and amending the remaining items based on participant suggestions. The results of the second round achieved higher average scores and lower quartile deviations than the first, indicating that the second-round modified-Delphi method was more appropriate than the first; participant opinions trended toward uniformity. Based on these results, the researchers made further modifications based on participant suggestions and integrated substantially similar items into the third-round modified Delphi instrument.
The scores for the second modified Delphi instrument round were analyzed to obtain the average, mode, and quartile deviations, and indicators with average scores below 4.00 were eliminated. Although the marketing and promotion dimension achieved average scores below 4.00, its importance and expert consistency were higher than the levels achieved in the first round, with 7 indicators in this domain earning average scores ≥4.00. Therefore, this dimension was retained and led to 7 indicators being included in the third round. The dimensions and categories of the remaining indicators were not affected, although amendments to some indicators were performed based on the suggestions of the participants. Consequently, the third modified Delphi instrument had 2 categories, 6 dimensions, and 62 indicators.
4.3. Third Round
The third-round modification of the instrument added several new indicators, while dropping or merging several second-round indicators. A comparison of the appropriateness of each category appears in Table 1, indicating that the two categories, the product and customereach earned average scores above 4.80 and quartile deviations of 0. This result evinced a high degree of expert agreement regarding the importance of these two foodservice quality categories.
The three indicators in the product category earned average scores above 4.00 and quartile deviations below 0.6. Thirty indicators achieved high consistency; 16 earned scores of 5 (highly significant), and 14 earned scores of 4 (important). Indicators including “wellmatched condiments” and “possessing professional culinary arts qualifications” both earned average scores below 4.0, justifying their elimination. Although “product calorie information display” failed to achieve an average score of 4.0, the item was amended based on expert suggestions and retained as an indicator under a new item name: “nutritional information display”. The third-round results and expert-recommended changes to some of the secondary indicators provided the basis for the final set of foodservice quality perception indicators for the hospitality sector.
Two of the three indicators in the customer category earned average scores above 4.00, while the marketing and promotion dimension earned an average of 3.95. The quartile deviations for the three primary indicators were all below 0.6. Thirty-two indicators achieved high consistency: 17 earned scores of 5 (highly significant), and 15 earned scores of 4 (important). Although the thirdround score for the marketing and promotion dimension fell short of 4.00 by averaging 3.95 with a quartile deviation of 0, the score was higher than the first (3.85) and second (3.90) rounds, demonstrating increased importance and momentum toward expert consensus. Five of this dimension’s indicators attained average scores of ≥4.00. Marketing and promotion were therefore retained with the other five dimensions.

Table 1. Statistical results for the two categories.
Table 2. Statistical results for the six dimensions.
Table 2 compares the results for the primary indica
tors across the second and third rounds, with the final list including 57 indicators in 6 dimensions in 2 categories.
5. Discussion and Recommendations
Expert opinions indicate that the importance of the “customer orientation” dimension exceeds that of the “product orientation” dimension. Chen and Huang [15] demonstrated that when selecting dining venues, consumers increasingly emphasize food quality and price, dining setting and ambience, and service quality, reflecting their greater emphasis on food hygiene and safety, interpersonal interactions, and the importance of personal preferences and values. Interior design and aesthetics can accentuate a restaurant’s unique dining ambiance and style. The design of building exteriors and interiors [16,17], the creation of a distinctive ambience [18,19], and the development of visually striking menu presentations [20]
all play positive roles. Therefore, restaurant operators must search for new experiential elements to enhance customer excitement and stimulate a customer’s willingness to patronize and re-patronize [17,21].
The overlap between the literature and the expert cohort findings demonstrates the importance of foodservice quality dimensions throughout society. The firstand second-round as well as the secondand third-round modified Delphi questionnaire stability exhibited high degrees of stability among the participant opinions. This finding validates and completes this study’s modified Delphi instrument. The final version included 2 categories (product and customer), 6 dimensions (product character, culinary arts, hygiene and safety, environment and ambience, marketing and promotion, and service quality), and 57 perception indicators of food quality (Table 3).
The final version may be used to enhance the teaching
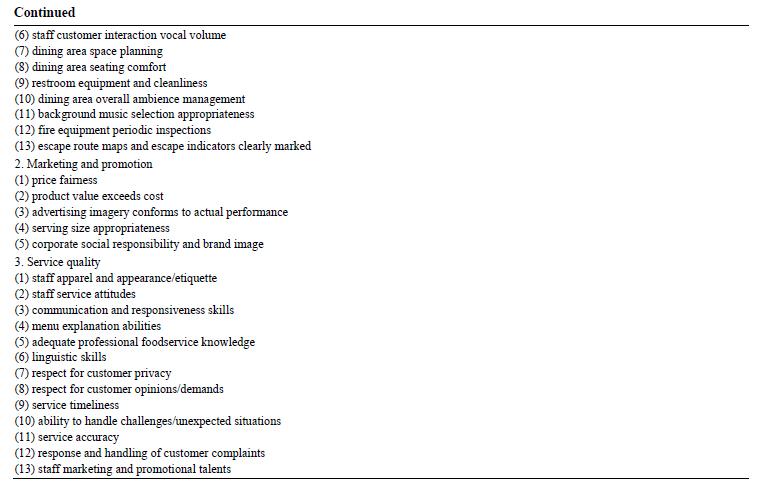
Table 3 . Final list of the perception indicators of foodservice quality.
of restaurant management and food preparation principles to improve students’ food-related knowledge and experience. The final version may also be used to develop practical kitchen courses that foster a greater appreciation of foodservice quality. As consumer foodservice quality expectations continue to rise, a restaurant’s success requires not only the provision of excellent food but also achievements in other dimensions. Based on study findings, we recommend that the hospitality industry focuses greater attention on menu item prices, hygiene, environment, and service conditions to enhance the foodservice quality experience of customers. Additionally, internships and on-the-job training programs should reduce repetitive task assignments and expand management-related training to expose students to all facets of the restaurant industry, enhance a student’s willingness to enter the field after graduation, and improve overall foodservice quality perception performance. The Delphi survey in this study used input from experts to construct foodservice quality perception indicators. Future studies should survey the opinion of restaurant employees, hospitality teachers, and students to confirm the validity of the identified indicators.
REFERENCES
- J. M. Sulek and R. L. Hensley, “The Relative Importance of Food, Atmosphere, and Fairness of Wait,” Cornell Hotel and Restaurant Administration Quarterly, Vol. 45, No. 3, 2004, pp. 235-247. http://dx.doi.org/10.1177/0010880404265345
- Y. Namkung and S. Jang, “Does Food Quality Really Matter in Restaurant: Its Impact of Customer Satisfaction and Behavioral Intentions?” Journal of Hospitality and Tourism Research, Vol. 31, No. 3, 2007, pp. 387-410. http://dx.doi.org/10.1177/0010880404265345
- J. R. Olsen, H. Harmsen and A. Friis, “Linking Quality Goals and Product Development Competences,” Food Quality and Preference, Vol. 19, No. 1, 2008, pp. 33-42. http://dx.doi.org/10.1016/j.foodqual.2007.06.002
- H. L. Meiselman, “Dimensions of the Meal,” Journal of Foodservice, Vol. 19, No. 1, 2008, pp. 13-21. http://dx.doi.org/10.1111/j.1745-4506.2008.00076.x
- S. Sanderson and M. Uzumeri, “Managing Product Families: The Case of the Sony Walkman,” Research Policy, Vol. 24, No. 6, 1995, pp. 762-782.
- C. Y. Baldwin and K. B. Clark, “Managing in an Age of Modularity,” Harvard Business Review, Vol. 75, No. 5, 1997, pp. 84-93.
- D. Aggelogiannopoulos, E. H. Drosinos and P. Athanasopoulos, “Implementation of a Quality Management System (QMS) According to the ISO 9000 Family in a Greek Small-Sized Winery: A Case Study,” Food Control, Vol. 18, No. 9, 2007, pp. 1077-1085. http://dx.doi.org/10.1016/j.foodcont.2006.07.010
- M. Jevsnik, V. Hlebec and P. Raspor, “Consumers’ Awareness of Food Safety from Shopping to Eating,” Food Control, Vol. 17, 2008, pp. 737-745. http://dx.doi.org/10.1016/j.foodcont.2007.07.017
- C. W. Barrow and R. H. Bosselman, “Hospitality Management Education,” The Haworth Hospitality Press, 1999.
- C. C. Teng, “The Effects of Personality Traits and Attitudes on Student Uptake in Hospitality Employment Student Uptake in Hospitality Employment,” International Journal of Hospitality Management, Vol. 27, No. 1, 2008, pp. 76-86. http://dx.doi.org/10.1016/j.ijhm.2007.07.007
- J. S. Horng, “Curriculum Analysis of Foods and Beverage management in Technological and Vocational Education,” Asia Pacific Journal of Tourism Research, Vol. 9, No. 2, 2004, pp. 107-119. http://dx.doi.org/10.1080/1094166042000233676
- A. L. Delbecq, A. H. Van de Ven and D. H. Gustafson, “Group Techniques for Program Planning: A Guide to Nominal Group and Delphi Processes,” Scott, Foresman, Glenview, 1975.
- V. Fahety, “Continuing Social Work Education: Result of Delphi Survey,” Journal of Education for Social Work, Vol. 15, No. 1, 1979, pp. 12-19. http://dx.doi.org/10.1080/00220612.1979.10671539
- M. C. Holden and J. F. Wedman, “Future Issues of Computer-Mediated Communication: The Results of a Delphi Study,” Educational Technology, Research and Development, Vol. 41, No. 4, 1993, pp. 5-24. http://dx.doi.org/10.1007/BF02297509
- K. H. Chen and D. H. Huang, “Devising Evaluation Indicators for Taiwanese Cultural Cuisine Restaurant Rating,” Journal of Hospitality and Home Economics, Vol. 7, No. 3, 2010, pp. 235-259.
- D. J. MacLaurin and T. L. MacLaurin, “Customer Perceptions of Singapore’s Theme Restaurants,” Cornell Hotel and Restaurant Administration Quarterly, Vol. 41, No. 3, 2000, pp. 75-85.
- K. Ryu, H. Han and T. H. Kim, “The Relationships among Overall Quick-Casual Restaurant Image, Perceived Value, Customer Satisfaction, and Behavioral Intentions,” International Journal of Hospitality Management, Vol. 27, 2008, pp. 459-469.
- R. Weiss, A. H. Feinstein and M. Dalbor, “Customer Satisfaction of Theme Restaurant Attributes and Their Influence on Return Intent,” Journal of Foodservice Business Research, Vol. 7, No. 1, 2004, pp. 23-41. http://dx.doi.org/10.1300/J369v07n01_03
- Y. Liu and S. Jang, “Perceptions of Chinese Restaurants in the US: What Affects Customer Satisfaction and Behavioral Intentions?” International Journal of Hospitality Management, Vol. 28, No. 3, 2009, pp. 338-348. http://dx.doi.org/10.1016/j.ijhm.2008.10.008
- J. Kivela, R. Inbakaran and R. Reece, “Consumer Research in the Restaurant Environment, Part 1: A Conceptual Model of Dining Satisfaction and Return Patronage,” International Journal of Contemporary Hospitality Management, Vol. 11, No. 5, 1999, pp. 205-222. http://dx.doi.org/10.1108/09596119910272739
- Y. Liu and S. Jang, “The Effects of Dining Atmospherics: An Extended Mehrabian-Russell Model,” International Journal of Hospitality Management, Vol. 8, No. 4, 2009, pp. 494-503. http://dx.doi.org/10.1016/j.ijhm.2009.01.002