Food and Nutrition Sciences
Vol.4 No.2(2013), Article ID:27717,6 pages DOI:10.4236/fns.2013.42020
Quantitative Analysis of Relationships between Masseter Activity during Chewing and Textural Properties of Foods
![]()
1Department of Health and Nutrition, Niigata University of Health and Welfare, Niigata, Japan; 2Department of Health and Nutrition, University of Niigata Prefecture, Niigata, Japan.
Email: miyaoka@nuhw.ac.jp
Received December 17th, 2012; revised January 14th, 2013; accepted January 22nd, 2013
Keywords: Surface Electromyogram; Masseter; Physiological Parameters; Chewing; Textural Properties; Human
ABSTRACT
The aim of this study was to quantify the relationships between four physiological parameters of masseter activity during chewing and properties related to the sizes and textures of the six representative test foods. The physiological parameters analyzed were the number of chewing cycles, chewing time, masseter amplitude, and cycle duration, which were obtained from masseter surface electromyography recorded in ten (seven male and three female) healthy, young participants. The six test foods differed in size dimensions (length, width, and height) and in textural properties (hardness, fracturability, and adhesiveness). The quantitative relationships were examined using linear regression. Nine statistically significant regression coefficients were found between the four physiological parameters and the textural properties, but not the height, of the test foods. From the regression coefficients, contributions of the food properties to the physiological parameters were estimated. Individual relationships between the physiological parameters and textural properties of the test foods are discussed in relation to their physiological implications.
1. Introduction
Both the size dimensions of foods and the textural properties (such as hardness and adhesiveness) affect the jaw and muscle activity during the chewing of foods. For example, it has been shown that compared to the chewing of a smaller piece of food, the chewing of larger foods is associated with longer jaw-opening and -closing phases and chewing times [1] and larger amplitudes of jaw-closing muscle activity [2]. Further, when harder and softer foods are cut into uniformly size cubes, the chewing of the harder foods is associated with higher average jaw-closing muscle activity and larger vertical amplitudes of the jaw-opening phase [3]. It has also been shown that increasing the hardness of viscoelastic model foods that are otherwise identical in shape, size, and texture reduces the number of chewing cycles, the jawclosing muscle activity, and the vertical amplitude of the jaw-opening phase of jaw movement [4].
Two challenges have limited our understanding of the effect of food size dimensions, and textural properties on jaw muscle activity during chewing: one being a methodological challenge and the other related to the chewing materials. With regard to the methodological challenge, while many previous studies have examined food parameters (such as size dimensions, and textural properties) and physiological parameters, these parameters have been generally assessed separately. This has hampered our understanding of the causal and quantitative relationships between food and physiological parameters. There have been a limited number of studies that have used a correlation method to analyze the relationships between food and physiological properties [5,6]. In regard to the chewing material challenge, while some model foods have been useful since they allow a more precise focus on specific properties such as hardness [1,2,4], such model foods are not representative of the foods that are consumed every day, which usually possess complex physical and chemical properties. Both challenges can be addressed by employing a linear regression model (LRM), a statistical model that tests how well two or more variables are related by a straight line [7].
The aim of the present study was to quantify the relationships between the physiological parameters of masseter activity during chewing and the size and textural properties of representative test foods using LRM.
This study was approved by the ethical committee of Niigata University of Health and Welfare. A preliminary report of this study has been presented as an abstract form [8].
2. Materials and Methods
2.1. Participants
Ten young adults (seven men and three women) with an average age of 20 years participated in this study after providing informed consent. None of the participants had special medical and dental problems related to chewing or swallowing.
2.2. Test Foods
Six test foods were used in the present study: processed cheese (Rokko Butter Co., Ltd., Japan), gummy candy (Meiji Co., Ltd., Japan), marshmallow (EIWA Confectionery Co., Ltd., Japan), dried prunes (Uchiyama-Tozaburo firm, Japan), rice crackers (Sanko-Seika Co., Ltd., Japan), and sponge cake (Shimizu-Seika Co., Ltd., Japan). The size dimensions and weight of these foods were described in our preceding paper (Table 1 in [9]). Since the test foods were natural and commercial products, their physical morphological attributes were not uniform. Since the processing of the test foods would cause some unavoidable destruction, the commercial products were used in their original forms.
As shown in the preceding paper (Table 2 in [9]), four textural properties of the test foods, namely, hardness, cohesiveness, fracturability, and adhesiveness, were measured using a Texture Profile Unit (TPU-2S, Yamaden Inc., Tokyo, Japan) at a room temperature of approximately 25˚C. A cylindrical plunger with an 8 mm diameter was used for these measurements. Each sample of the test foods was placed into a cylindrical stainless steel container (50 mm in diameter and 15 mm in height), which in turn was placed under one of the plungers on the Texture Profile Unit, and the sample was compressed twice at a speed of 2.5 mm/s with a 2.0 mm clearance.
2.3. Electrophysiological Recordings
A pair of adhesive electrodes (Ambu Inc., Blue Sensor, Maryland, USA) was attached to the skin just above the masseter muscle (Mass) on the participant’s habitual working side to record a surface electromyogram (EMG). The Mass EMG signals were amplified, filtered (using a bandwidth of 10 Hz - 10 kHz), fully rectified, and integrated (time constant = 0.06 s) using the PowerLab system (ADInstruments Pty Ltd., PowerLab/8 sp, Bella Vista, Australia). An accelerometer (Takei Scientific Instruments Co., Ltd., Tokyo, Japan) was attached to the skin of the chin to monitor jaw movement associated with chewing; the amplitude of the movement was not measured. In addition to the EMG and accelerometer recordings, two video cameras (Logicool®, Qcam Communicate STX, Tokyo, Japan) were used to monitor the movement of the body, neck, and head of each participant from the frontal and lateral sides, respectively. The collected data were stored and analyzed on the PowerLab system.
2.4. Procedures
Each participant was seated on a chair in an electrically shielded room, the temperature of which was around 25˚C. The participant was partitioned from the experimenters by a folding screen and was asked to wear earplugs and a headphone during the experiment to reduce surrounding noise. The participant was provided with instructions regarding chewing tasks from a computer display that was placed on a desk in front of them. One of the six test foods was delivered randomly in front of the participant and they were asked to chew it at their natural rhythm. The participant was not restricted with regard to the chewing side despite the fact that the EMG electrodes were attached on the habitual working side. The participant was also asked to swallow when they felt the food had been fully chewed. After swallowing, the participant was allowed to drink room temperature green tea (Ohi-ocha, Ito-en, Tokyo, Japan). One experimental session consisted of 7 - 12 trials for each participant (1 minute intervals between trials). A total of 108 trials were conducted with the ten participants.
2.5. Data Analysis
Since the Mass EMG was evoked not only by cyclic chewing but also by any voluntary and involuntary contractions, the start of chewing was confirmed on the basis of both the accelerometer data, which displayed the jaw movement trajectory, and visual observations using the video-camera monitors. The start and end of each chewing cycle were determined to be when the Mass EMG had clearly exceeded and returned to the resting activity level, respectively.
Four parameters were analyzed in this study: the number of chewing cycles, chewing time, peak amplitude of the integrated Mass EMG, and cycle duration of the raw Mass EMG. The chewing cycle number was determined by counting the bursts in the Mass EMG that occurred between the start and the end (i.e., just before swallowing) of each chewing sequence. The chewing time was determined to be the cycle duration from the start to the end of each chewing sequence. The peak amplitude was defined as the highest value of the integrated Mass EMG. The cycle duration of the raw Mass EMG was defined as the interval from the start to the end of each burst in the Mass EMG. The peak amplitude and the cycle duration were measured for the first chewing cycle only.
2.6. Statistical Analysis
Since the number of chewing cycles was a discrete parameter, two non-parametric methods, namely, the Kruskal-Wallis and Steel-Dwass tests, were used for statistical analyses. The Kruskal-Wallis test was used to detect any significant differences between the six foods and between the participants, while the Steel-Dwass test was used to detect any specific differences between food or participant pairs. Two parametric methods were used to analyze the remaining data, namely, the two-way analysis of variance (ANOVA) and LRM analysis. In the ANOVA, two factors (“Food” and “Participant”) were used to detect significant differences between the parameters for the six foods and the ten participants. The ANOVA was followed by the Tukey’s HSD test to detect specific differences between food pairs but not between participant pairs. In the LRM analysis, the following linear model was assumed:

where y is an observation of one of the parameters (such as cycle duration or peak amplitude), ai (i = 1, 2, 3, 4) are four regressive effects of three textural properties (“Hardness”, “Fracturability”, and “Adhesiveness”) and the “Height” of the foods, ci are four regression coefficients for the four regressive effects, b is a fixed-main effect of “Participant”, and e is a random residual effect. Since the “Cohesiveness” is a ratio of the positive force areas under the first and second compressions [10], this textural parameter was not included in the LRM analysis. Regression coefficients estimated in the significant regressive effects were used to denote the contributions in each parameter space. For example, if the “Height” of the six test foods ranged from A to B mm and the regression coefficient of the “Height” on the “Chewing number” parameter was estimated as C, the contribution of the effect was denoted as “a (B − A) mm increase in the height increased (or decreased if C was negative) the chewing number by the amount of C × (B − A)”. The significance level was set at P < 0.05.
3. Results
3.1. Number of Chewing Cycles
The estimated contributions of the four food parameters (hardness, fracturability, adhesiveness, and height) to the number of chews from the start of chewing to just before swallowing are shown in Figure 1. LRM analysis found significant regression coefficient estimates for fracturability (−0.088) and for adhesiveness (−1.33; Ps < 0.01) with regard to the number of chews. Considering the estimated regression coefficients together with the measured ranges of these two food parameters, changes in the number of chewing cycles were estimated as −8.2 cycles across the range of fracturability values and −7.5 cycles across the range of adhesiveness values.
3.2. Chewing Time
The estimated contributions of the food parameters to the chewing time from the start to the end of chewing are shown in Figure 2. LRM analysis found two significant
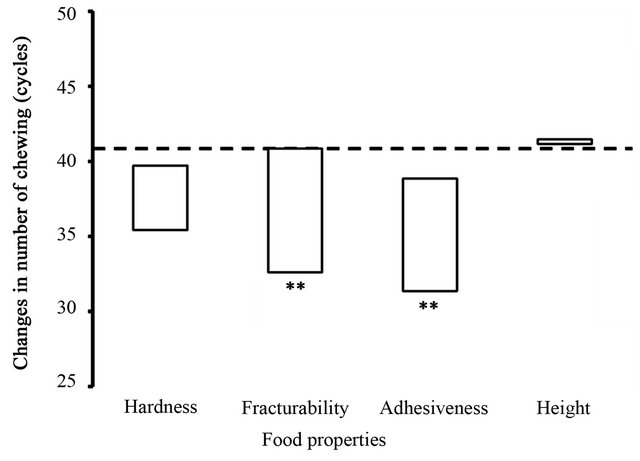
Figure 1. Relationship between food properties and number of chewing. Changes in the number of chewing cycles from the start to the end of each chewing sequence were estimated by the LRM analysis in response to four food properties measured in the six test foods by a texturometer. The changes are presented in proportion to the ranges of the four food properties: hardness, 600 (157 to 757) kPa; fracturability, 94 (0 to 94) kPa; adhesiveness, 5.7 (1.5 to 7.2) kJ/m3; and height, 19.8 (8.3 to 28.1) mm. A horizontal dotted line indicates the overall mean of the number of chewing cycles, and asterisks indicate significant estimations of the regression coefficients of the food properties on the number of chewing cycles. **P < 0.01.
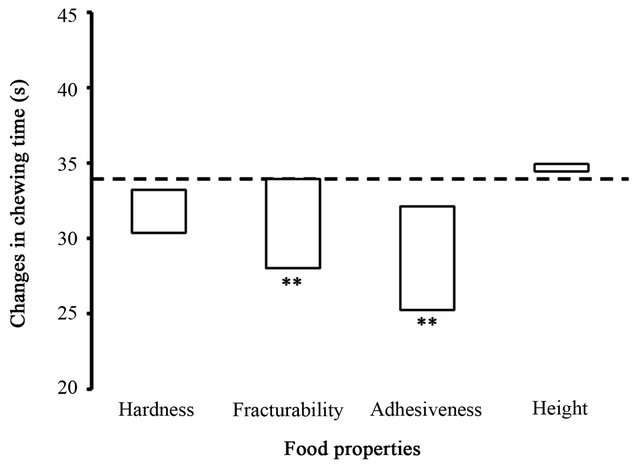
Figure 2. Relationship between food properties and chewing time. Changes in the chewing time from the start to the end of each chewing sequence were estimated by the LRM analysis in response to four food properties measured in the six test foods by a texturometer. The changes are presented in proportion to the ranges of the four food properties as shown in Figure 1. A horizontal dotted line indicates the over-all mean of the chewing time, and asterisks indicate significant estimations of the regression coefficients of the food properties on the chewing time. **P < 0.01.
regression coefficient estimates for fracturability (−0.063) and for adhesiveness (−1.22; Ps < 0.01) with regard to the chewing time. According to the estimated regression coefficients and the measured ranges of these two food parameters, changes in the chewing time were estimated as −5.9 s across the range of fracturability values and −6.9 s across the range of adhesiveness values.
3.3. Amplitude
The estimated contributions of the food parameters to the peak amplitudes of the integrated Mass EMG during the first chewing cycle are shown in Figure 3. LRM analysis found three significant regression coefficient estimates for hardness (0.011), for fracturability (−0.101), and for adhesiveness (−1.46; Ps < 0.05) with regard to the peak amplitudes. According to the estimated regression coefficients and the measured ranges of these three food parameters, changes in the peak amplitudes were estimated as 6.5 µV·s across the range of hardness values, −9.5 µV·s across the range of fracturability values, and −8.3 µV·s across the range of adhesiveness values.
3.4. Cycle Duration
The estimated contributions of the food parameters to the cycle durations of the Mass EMG for the first chewing cycle are shown in Figure 4. LRM analysis found two significant regression coefficient estimates for hardness (0.13) and adhesiveness (−12.5; Ps < 0.05) with regard to the cycle duration. According to the estimated coeffi-
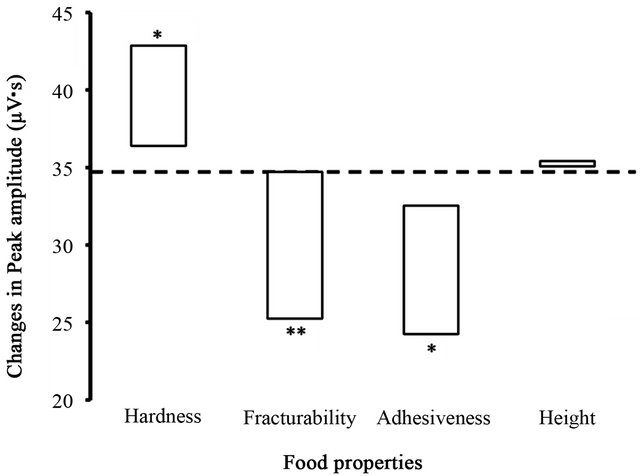
Figure 3. Relationship between food properties and masseter amplitude. Changes in the peak amplitudes of the integrated masseter electromyogram during the first chewing cycle were estimated by the LRM analysis in response to four food properties measured in the six test foods by a texturometer. The changes are presented in proportion to the ranges of the four food properties as shown in Figure 1. A horizontal dotted line indicates the overall mean of the masseter amplitude, and asterisks indicate significant estimations of the regression coefficients of the food properties on the masseter amplitudes. *P < 0.05, **P < 0.01.

Figure 4. Relationship between food properties and cycle duration. Changes in the cycle duration of the masseter electromyogram during the first chewing cycle were estimated by the LRM analysis in response to four food properties measured in the six test foods by a texturometer. The changes are presented in proportion to the ranges of the four food properties as shown in Figure 1. A horizontal dotted line indicates the overall mean of the cycle duration, and asterisks indicate significant estimations of the regression coefficients of the food properties on the cycle durations. *P < 0.05.
cients and the measured ranges of these two food parameters, changes in the cycle duration were estimated as 75.8 ms across the hardness values and −70.8 ms across the adhesiveness values.
4. Discussion
Six test foods were used in this study, and their size dimensions and textural properties were previously analyzed (Tables 1 and 2 in [9]). Ten foods were used in the initial stage of the study, but four of them were eliminated because their textural properties could not be measured by the same plunger (ɸ = 8 mm) of the Texture Profile Unit as the other six test foods, indicating the wide variation in textural properties of the initial ten test foods. For the six test foods adopted for the present study, statistical differences were detected in food dimensions and textural properties, although no specific differences in food dimensions were found between any given pair of foods. Accordingly, four physiological parameters of masseter activity during chewing were examined in this study by using test foods whose textural properties were restricted to those measureable by the plunger used in this study. LRM analysis was able to demonstrate quantitative relationships between the physiological parameters and the food properties of size and texture. We found that hardness, fracturability, and adhesiveness of the test foods contributed to the changes in the physiological parameters during chewing, while the height of the test foods did not.
Previous physiological studies have shown that the type [3,11], hardness [4], and amount [12,13] of food affect the number of chewing cycles and/or the chewing time until swallowing, and one of the studies [3] also showed that these two parameters behaved similarly when different foods were chewed. This corresponds to our own observations in the present study. Another study [4], where a viscoelastic model of foods was used, found that the number of chewing cycles increased proportionally with increases in food hardness. The present study suggests that fracturability and adhesiveness of the test foods contributed significantly to the number of chewing cycles, while only a negligible correlation between food hardness and the number of chewing cycles was observed (Figure 1). This was contrary to our expectations, since few previous studies have directly found any relationships between these two textural properties and chewing behavior. However, a recent paper used sensory evaluation data to generate two-dimensional representations of the adhesiveness and fracturability of various foods (see Figures 2 and 3 in [14], respectively). These representations were basically consistent with the conventional textural scales [15-17]. Since the previous studies [14-17] documented the usefulness of such a representation method, it seems reasonable to conduct experiments that enable physiological parametric data to be compared to scaling representation data.
The peak amplitude of an integrated masseter EMG is a very popular parameter for evaluating the behavior of the chewing apparatus in humans and experimental animals [4,18-21], probably because of its high sensitivity to the hardness of foods. In the present study, the LRM analysis allowed the quantification of the significant contributions of two textural parameters, fracturability and adhesiveness, to the peak amplitude (Figure 3). While hardness has been the focus of most studies relating food properties to physiological measurements of chewing, and far fewer studies have examined the influence of these two textural parameters on peak amplitude, two studies [12,22] have shown that these textural parameters affect the jaw-opening muscle activity rather than the jaw-closing muscle activity. These studies suggest that the observed regression coefficient for adhesiveness may reflect an indirect rather than a direct effect of this food textural property on the Mass EMG at the first chewing cycle. It may be that the adhesiveness modifies the jawopening muscle activity that precedes the Mass EMG: normally, the jaw-opening muscles fire first at the start of each chewing sequence, after which the jaw-closing muscles (including the Mass) fire [23]. It is possible that the modification of this jaw-opening activity induced by the food adhesiveness affects the Mass EMG via reflexes that are elicited by the sensory and motor systems that regulate chewing [23].
In conclusion, quantitative relationships are presented between four physiological parameters of masseter activity during chewing by ten healthy young adults and properties related to the sizes and textures of the six test foods used. Nine statistically significant regression coefficients were found between the four physiological parameters and the textural properties, but not the height, of the test foods. From the significant regression coefficients, contributions of the food properties to the physiological parameters were estimated.
5. Acknowledgements
This study was supported in part by Grants-in-Aid for Scientific Research from the Ministry of Education, Science and Culture of Japan (No. 22500740 to YM, No. 23700889 to TY, and No. 2050072 to IA).
REFERENCES
- S. Miyawaki, N. Ohkochi, T. Kawakami and M. Sugimura, “Effect of Food Size on the Movement of the Mandibular First Molars and Condyles during Deliberate Unilateral Mastication in Humans,” Journal of Dental Research, Vol. 79, No. 7, 2000, pp. 1525-1531. doi:10.1177/00220345000790071601
- S. Miyawaki, N. Ohkochi, T. Kawakami and M. Sugimurav, “Changes in Masticatory Muscle Activity According to Food Size in Experimental Human Masticationv,” Journal of Oral Rehabilitation, Vol. 28, No. 8, 2001, pp. 778-784.
- T. Horio and Y. Kawamura, “Effects of Texture of Food on Chewing Patterns in the Human Subject,” Journal of Oral Reha-Bilitation, Vol. 16, No. 2, 1989, pp. 177-183.
- A. Peyron, C. Lassauzay and A. Woda, “Effects of Increased Hardness on Jaw Movement and Muscle Activity during Chewing of Visco-Elastic Model Foods,” Experimental Brain Research, Vol. 142, No. 1, 2002, pp. 41-51. doi:10.1007/s00221-001-0916-5
- K. R. Agrawal, P. W. Lucas, I. C. Bruce and J. F. Prinz, “Food Properties That Influence Neuromuscular Activity during Human Mastication,” Journal of Dental Research, Vol. 77, No. 11, 1998, pp. 1931-1938. doi:10.1177/00220345980770111101
- K. R. Agrawal, P. W. Lucas, J. F. Prinz and I. C. Bruce, “Mechanical Properties of Foods Responsible for Resisting Food Breakdown in the Human Mouth,” Archives of Oral Biology, Vol. 42, No. 1, 1997, pp. 1-9. doi:10.1016/S0003-9969(96)00102-1
- A. Grafen and R. Hails, “Modern Statistics for the Life Sciences,” Oxford University Press Inc., New York, 2002.
- Y. Miyaoka, I. Ashida, H. Iwamori, Y. Tamaki, S. Kawakami and S. Miyaoka, “Activity Pattern of the Masseter during Chewing as a Discriminator of Foods,” Journal of Japanese Society of Sensory Evaluation, Vol. 14, No. 1, 2010, p. 63.
- Y. Miyaoka, I. Ashida, Y. Tamaki, S. Kawakami, H. Iwamori, T. Yamazaki and N. Ito, “Analysis of Masseter Activity Patterns Using TP Values during Chewing of Foods with Different Shapes and Textural Properties,” Journal of Texture Studies, 2013. doi:10.1111/jtxs.12012
- M. C. Bourne, “Texture Profile Analysis,” Food Technology, Vol. 32, No. 7, 1978, pp. 62-66.
- G. C. Gorniak and C. Gans, “Quantitative Assay of Electromyograms during Mastication in Domestic Cats (Felis catus),” Journal of Morphology, Vol. 163, No. 3, 1980, pp. 253-281. doi:10.1002/jmor.1051630304
- K. Kohyama, M. Yamaguchi, C. Kobori, Y. Nakayama, F. Hayakawa and T. Sasaki, “Mastication Effort Estimated by Electromyography for Cooked Rice of Differing Water Content,” Bioscience, Biotechnology, and Biochemistry, Vol. 69, No. 9, 2005, pp. 1669-1676. doi:10.1271/bbb.69.1669
- H. Dan and K. Kohyama, “Interactive Relationship between the Mechanical Properties of Food and the Human Response during the First Bite,” Archives of Oral Biology, Vol. 52, No. 5, 2007, pp. 455-464.
- M. A. Chauvin, C. Parks, C. Ross and B. G. Swanson, “Multidimensional Representation of the Standard Scales of Food Texture,” Journal of Sensory Studies, Vol. 24, No. 1, 2008, pp. 93-110.
- A. V. Cardello, A. Matas and J. Sweeney, “The Standard Scales of Texture: Rescaling by Magnitude Estimation,” Journal of Food Science, Vol. 47, No. 5, 1982, pp. 1738- 1740, 1742.
- A. M. Munoz, “Development and Application of Texture Reference Scales,” Journal of Sensory Studies, Vol. 1, No. 1, 1986, pp. 55-83. doi:10.1111/j.1745-459X.1986.tb00159.x
- A. S. Szczesniak, “Classification of Textural Characteristics,” Journal of Food Science, Vol. 28, No. 4, 1963, pp. 385-389. doi:10.1111/j.1365-2621.1963.tb00215.x
- A. Peyron, L. Mioche, P. Renon and S. Abouelkaram, “Masticatory Jaw Movement Recordings: A New Method to Investigate Food Texture,” Food Quality and Preference, Vol. 7, No. 3-4, 1996, pp. 229-237.
- Y. Y. Shiau, C. C. Peng and C. W. Hsu, “Evaluation of Biting Performance with Standardized Test-Foods,” Journal of Oral Rehabilitation, Vol. 26, No. 5, 1999, pp. 447- 452.
- C. Lassauzay, M. A. Peyron, E. Albuisson, E. Dransfield and A. Woda, “Variability of the Masticatory Process during Chewing of Elastic Model Foods,” European Journal of Oral Sciences, Vol. 108, No. 6, 2000, pp. 484-492.
- K. D. Foster, A. Woda and M. A. Peyron, “Effect of Texture of Plastic and Elastic Model Foods on the Parameters of Mastication,” Journal of Neurophysiology, Vol. 95, No. 6, 2006, pp. 3469-3479. doi:10.1152/jn.01003.2005
- K. Shiozawa, K. Kohyama and K. Yanagisawa, “Influence of Adhesiveness of Ingested Food on Human Masticatory Behavior,” Japanese Journal of Oral Biology, Vol. 39, No. 1, 1997, pp. 25-33. doi:10.2330/joralbiosci1965.39.25
- Y. Yamada, K. Yamamura and M. Inoue, “Coordination of Cranial Motoneurons during Mastication,” Respiratory Physiology and Neurobiology, Vol. 147, No. 2-3, 2005, pp. 177-189. doi:10.1016/j.resp.2005.02.017