Food and Nutrition Sciences
Vol. 3 No. 7 (2012) , Article ID: 20507 , 9 pages DOI:10.4236/fns.2012.37120
Developing a Heme Iron Database for Meats According to Meat Type, Cooking Method and Doneness Level
![]()
1Nutritional Epidemiology Branch, Division of Cancer Epidemiology and Genetics, National Cancer Institute, National Institutes of Health, Rockville, USA; 2US Department of Agriculture, Food Composition and Methods Development Laboratory, Beltsville Human Nutrition Research Center, Agricultural Research Service, Beltsville, USA; 3Yale School of Public Health, New Haven, USA; 4Information Management Services, Inc., Silver Spring, USA.
Email: *crossa@mail.nih.gov
Received May 3rd, 2012; revised June 3rd, 2012; accepted June 10th, 2012
Keywords: Meat; Heme; Iron; Database
ABSTRACT
Background: Animal studies have demonstrated that iron may be related to carcinogenesis, and human studies found that heme iron can increase the formation of N-nitroso compounds, which are known carcinogens. Objectives: One of the postulated mechanisms linking red meat intake to cancer risk involves iron. Epidemiologic studies attempt to investigate the association between heme iron intake and cancer by applying a standard factor to total iron from meat. However, laboratory studies suggest that heme iron levels in meat vary according to cooking method and doneness level. We measured heme iron in meats cooked by different cooking methods to a range of doneness levels to use in conjunction with a food frequency questionnaire to estimate heme iron intake. Methods: Composite meat samples were made to represent each meat type, cooking method and doneness level. Heme iron was measured using atomic absorption spectrometry and inductively coupled plasma-atomic emission spectrometry. Results: Steak and hamburgers contained the highest levels of heme iron, pork and chicken thigh meat had slightly lower levels, and chicken breast meat had the lowest. Conclusions: Although heme iron levels varied, there was no clear effect of cooking method or doneness level. We outline the methods used to create a heme iron database to be used in conjunction with food frequency questionnaires to estimate heme iron intake in relation to disease outcome.
1. Introduction
Both red and processed meat intake have been positively associated with a variety of cancers, in large prospective cohort studies, including colorectal, esophageal, pancreatic, lung and liver cancer [1]. One of the key characteristics defining red meat is its iron content. Red meat is the largest dietary source of heme iron, which is more readily absorbed than non-heme iron [2,3]. Although both non-heme and heme iron can induce oxidative DNA damage by catalyzing the formation of reactive oxygen species [4,5], heme iron specifically has additional detrimental effects. Heme iron is associated with increased cytotoxicity of fecal water [6,7] and the promotion of chemically-induced colorectal cancer in rats [8]. Furthermore, heme iron intake increases endogenous formation of N-nitroso compounds (NOCs) [9,10], which are known carcinogens [11].
Despite the interest in heme iron, there are limited data for concentrations in meats, attributable to the lack of appropriate analytical methods, the variation of heme iron concentrations between meats (e.g. beef, chicken, or pork), the variation between different cuts of meats from the same animal, and the many different methods of preparation [12-14]. Limited studies have addressed each of these factors, but none were designed to support epidemiologic studies. In many cases, heme iron is still determined by difference; i.e. total iron minus non-heme iron. Thus far, epidemiologic studies have either assessed total dietary iron or attempted to estimate heme iron intake by applying a standard factor to total iron from meat [15,16]. However, research indicates that heme iron in meat can be partially converted to non-heme iron depending on cooking techniques [17-19]. This study describes the analysis of heme iron in different meat types cooked by various methods to a range of doneness levels.
2. Methods
Meat Samples: We measured the heme iron content of bacon, hotdog, pork chop, processed pork products (bologna, ham slice, luncheon meat), sausage (links and patties), roast beef, hamburger, steak, chicken breast and chicken thigh—both with and without skin; the total number of meat samples measured was 88. The cooking methods included broiled, baked, barbecued, micro-waved, pan-fried and restaurant prepared (for hamburger only), and we examined four levels of doneness—rare/just, medium, well and very-well done. The cooking methods and doneness levels considered depended on each meat type. Specifically, steak and hamburger samples were cooked by three different methods (barbecued, pan-fried and broiled) and to up to four different doneness levels (rare, medium, well and very-well done); in addition to cooked hamburgers obtained from a fast-food restaurant. Hotdog samples were cooked by four different methods (barbecued, pan-fried, broiled and boiled) and had either a standard doneness level (for broiled) or for the other cooking methods, three doneness levels (just done, well and very-well done). We analyzed pork chop cooked by broiling and pan-frying to three doneness levels (just done, well and very-well done). Bacon samples were cooked by pan-frying (to just done and very-well done), broiling (to just done, well and very-well done), and microwaving (to just done and very-well done). With regard to chicken, we analyzed 33 different samples representing four different cooking methods (barbecued, pan-fried, oven-broiled, and baked) for both chicken breast and thighs, both with and without skin and with and without bone. Doneness for chicken was categorized as standard (for whole chicken roasted or stewed), just done, well or very-well done.
For each meat type/cooking method and doneness level, multiple samples were cooked by nutritionists at the Human Nutrition Research Center at the US Department of Agriculture (USDA), Beltsville, MD. These meat samples were prepared for a previous study and detailed information on the samples and cooking conditions have been previously published [20-22]. Composite samples representing each cooking method and doneness level for any given meat type were made from multiple cooked meat samples.
Analysis: Cooked meat samples were analyzed by the Food Composition Laboratory, Human Nutrition Research Center, of the USDA, Beltsville, MD. Each batch of 13 samples contained one of each of the two quality control samples blinded to the laboratory. In addition, the laboratory analyzed its own in-house control sample with every batch. The blinded quality control samples were from a well-done, pan-fried hamburger patty and a hamburger broken into pieces and stir-fried at a low temperature. The in-house control samples are described in detail below.
The full protocol involved the analysis of duplicate samples. The first sample was subjected to an acid digestion and analyzed for iron by inductively coupled plasmaatomic emission spectrometry (ICP-AES) to provide the total iron content. The second sample was extracted with acidified acetone as described by Hornsey [23] and analyzed by flame atomic absorption spectrometry (FAAS) to provide the heme iron. We define heme iron as iron incorporated in a porphyrin structure without globin. The remaining solid was subjected to a total acid digestion and analyzed by ICP-AES to provide the non-heme iron.
The material balance was computed as the sum of the heme iron and non-heme iron divided by the total iron times 100%. The percent heme iron was computed as the ratio of heme iron to total iron. All control samples and 1/3 of the food samples were analyzed by the full protocol. The other 2/3 of the food samples were analyzed using a modified protocol; only the total iron and the heme iron were determined (no material balance was computed). All samples were prepared in duplicate.
Total iron: Approximately 1 g of sample was weighed into a digestion tube. Two mL of concentrated HNO3 was added and the sample was allowed to sit overnight. The next morning the sample was gently heated to 90˚C in a heating block for an hour and then allowed to cool. After cooling, drops of 10% H2O2 were added as necessary to provide a clear solution. The sample was transferred to a 25 mL volumetric and brought to volume. Samples were analyzed directly for iron by ICP-AES (PS3000, Teledyne Leeman Labs, Hudson, NH) using inorganic iron standards in 5% HCl. ICP-AES was used because initial results using FAAS revealed a suppression interference that ranged from a few percent to 40%. An accurate material balance was impossible to achieve using FAAS.
Heme iron (flame atomic absorption spectrometry): Approximately 1 g of sample was weighed into a digestion tube and mixed with 8 mL of acidified acetone (acetone:H2O:HCl = 80:10:10). The mixture was agitated vigorously on a vortex mixer and then centrifuged to separate the phases. The acidified acetone was quantitatively (as near as possible) transferred to a 25 mL volumetric and brought to volume with acidified acetone. The sample was analyzed by FAAS (Model 932 Plus, GBC Scientific Equipment, Hampshire, IL) using heme iron standards prepared from hemin dissolved in acidified acetone. FAAS was found to be more accurate than traditional molecular absorbance measurements (640 nm). ICP-AES could not be used because the acidified acetone solution quenched the plasma.
Heme iron (HPLC): Twenty µL of the acidified acetone extract (after bringing to volume of 15 mL) was injected onto the C18 column of an HPLC (System Gold, Beckman Coulter, Inc., Danvers, MA). The mobile phase was 0.5% trifluoroacetic acid in water. In every case only a single peak was observed and the peak area was quantified at 640 nm using hemin standards dissolved in acidified acetone.
Non-heme iron: The remaining solid (after removal of the acidified acetone phase) was digested in the same manner used for total iron; i.e. 2 mL of concentrated HCL was added, it sat overnight, was heated to 90˚C the next day, cooled, treated with H2O2 as necessary, transferred to a 25 mL volumetric, brought to volume, and analyzed by ICP-AES.
In-house control samples: Six different in-house control samples were compiled, 3 raw lean ground beef samples, ground beef jerky, and 2 baby food meat samples. Beef samples were obtained from a chuck roast purchased at the local supermarket, cleaned of all fat, ground, frozen, lyophilized, powdered, mixed, and stored in small containers. The beef jerky and the baby foods were purchased at the same supermarket.
3. Results
The total, heme, and non-heme iron values (in µg/g dry weight) and the percent heme iron and material balance obtained for the 6 in-house control samples are given in Table 1. The material balances fell between 94% and 102% with an average standard deviation of 12%. The average within control sample standard deviations for total, heme, and non-heme iron were 11%, 12% and 12%.
When run in conjunction with the meat samples, the standard deviations of the beef 3 control samples for total, heme, and non-heme iron was 4%, 4% and 15% and the material balance was 102% ± 20%. For the samples themselves, the average relative standard deviations for the total, heme, and non-heme iron determination for the samples was 6.3%, 5.1% and 13%. The material balance was 109% ± 22%. The standard deviation for the blinded control samples was 5.8%, 9.9% and 10.9% for low (12.9), medium (14.7), and high (13.0) heme iron levels.
The meats with the highest levels of heme iron, regardless of cooking method or doneness, were hamburgers (mean: 10.3 μg/g) and steak (mean: 9.3 μg/g). All pork products had values in the range of 3.4 μg/g (pork chop) to 7.5 μg/g (ham slice). Chicken had the lowest heme values (mean: 2.4 μg/g for chicken breast), but varied considerably according to the cut of meat (Figure 1).
The heme iron values, irrespective of doneness level, did not vary significantly according to cooking method (barbecued, broiled and pan-fried) for steak (9.6, 9.2 and 9.0 μg/g, respectively) or hamburgers (10.6, 10.2 and 10.7 μg/g, respectively). There was no effect of doneness level on heme iron content for steak or hamburgers (Table 2). The mean heme iron value for roast beef (8.3 μg/g) was in between the values for steak/hamburgers and pork products and there was no pattern according to doneness level (Table 2).
The heme iron values, irrespective of doneness level, for hot dogs did not vary significantly by cooking method (6.3, 5.8, 6.4 and 4.9 μg/g for barbecued, broiled, panfried and boiled, respectively) (Table 3). The heme iron level for pork chops cooked by pan-frying were slightly higher (3.8 μg/g) than for broiling (2.9 μg/g). There was no clear effect of doneness level on heme iron content of pork meats (Table 3).
The mean heme iron levels for bacon were lower for pan-frying (4.2 μg/g) and microwaving (4.6 μg/g), compared to broiling (5.6 μg/g). The heme iron values were slightly higher for very-well done bacon, compared to just done, for all three cooking methods (Table 3).
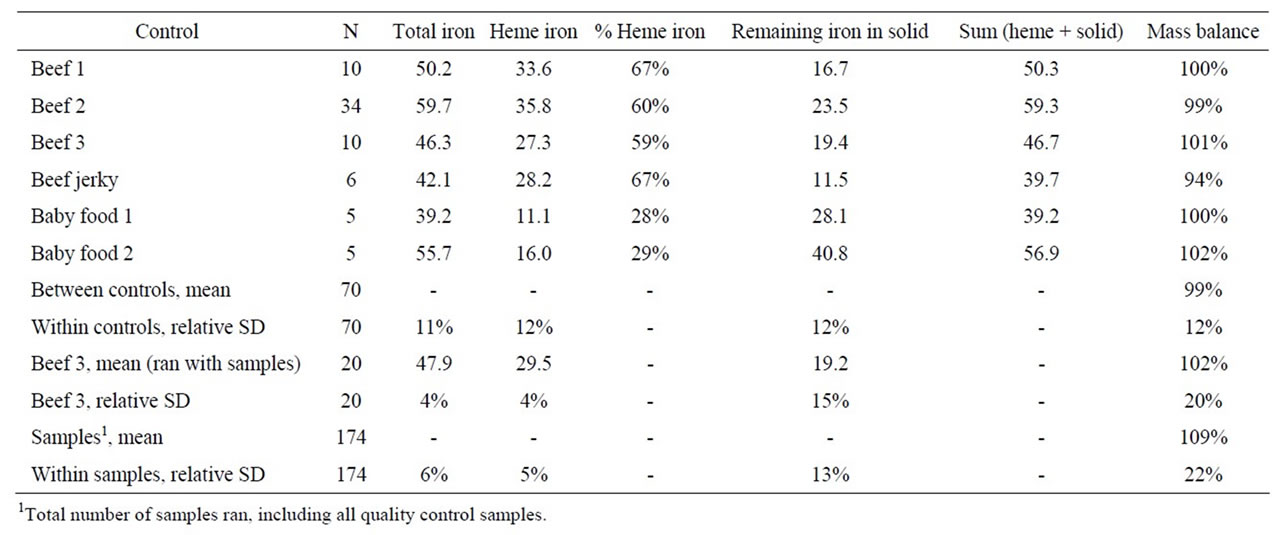
Table 1. In-house quality control materials (iron in µg/g, dry weight).

Figure 1. Mean heme iron level according to meat type.
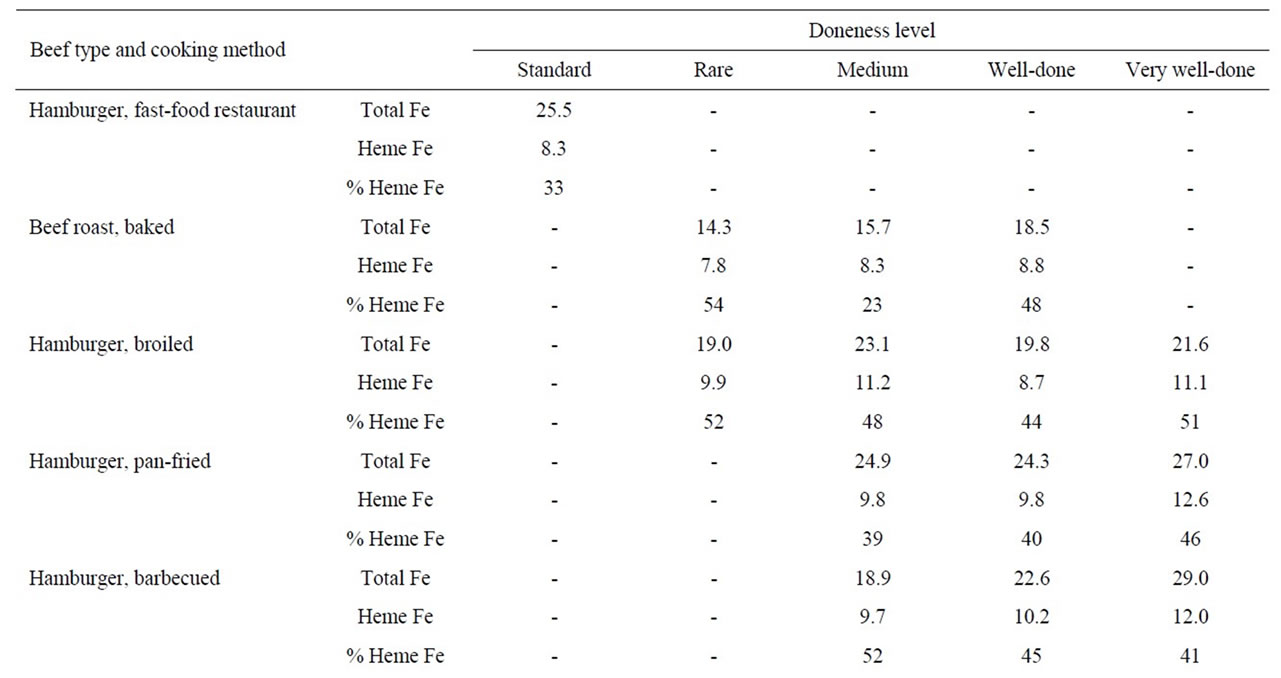
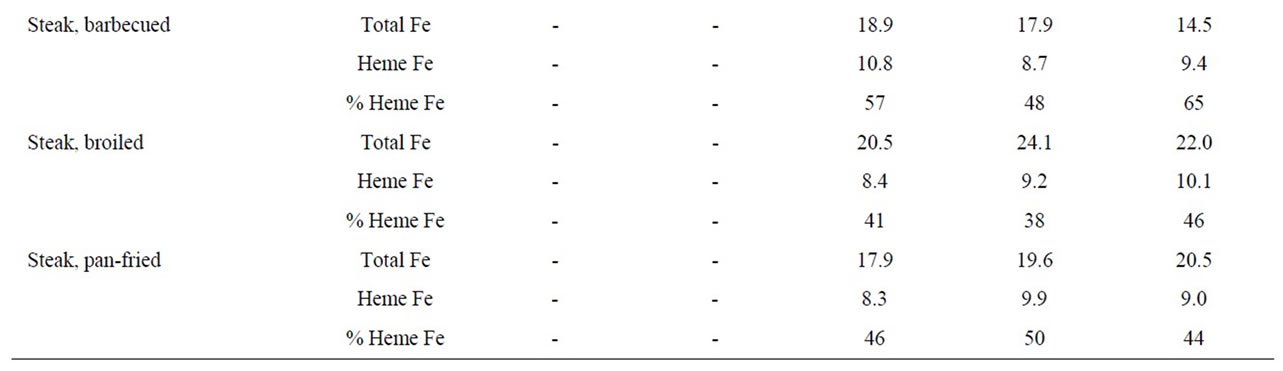
Table 2. Heme iron content (mg/g) of beef according to meat type, cooking method and doneness level.
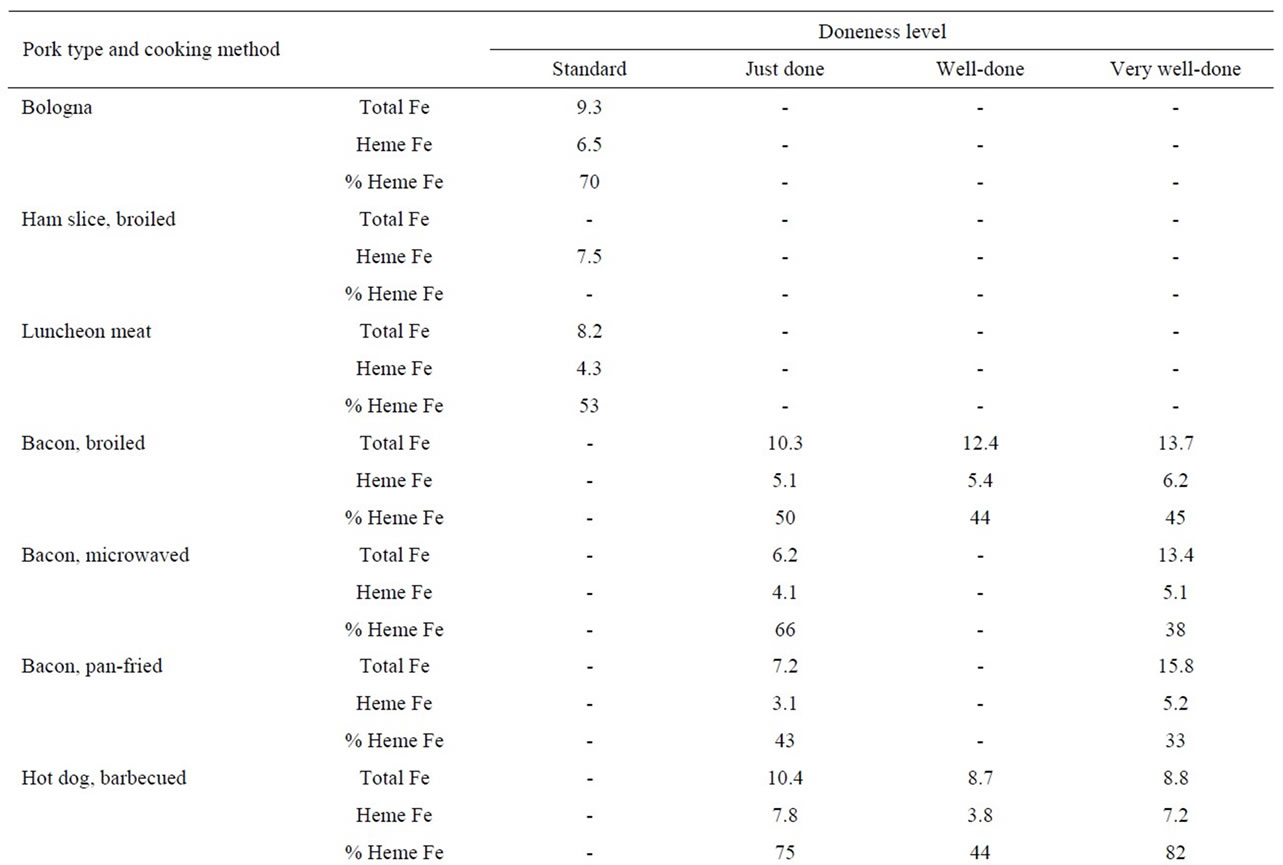
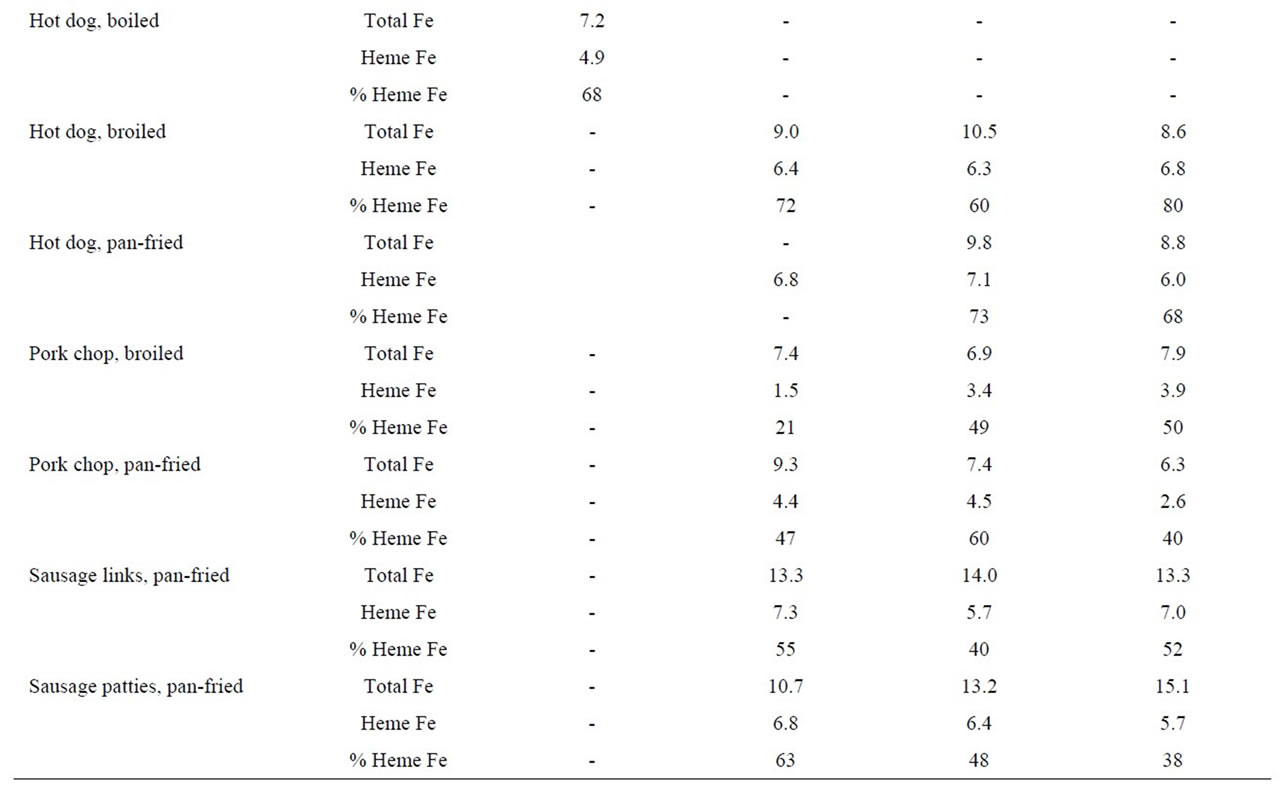
Table 3. Heme iron content (mg/g) of pork according to meat type, cooking method and doneness level.
With regard to sausages, we measured both patties and links cooked by pan-frying to three degrees of doneness (just, well done and very-well done). There was no difference in the mean heme values for sausage links (6.7 μg/g) versus sausage patties (6.3 μg/g); furthermore, there was no effect of doneness level on heme iron content. Other processed pork products, including bologna, ham slices and luncheon meats had similar heme iron values (6.5, 7.5 and 4.3 μg/g, respectively) to other sources of pork (Table 3).
In these analyses, we found that the heme iron level in chicken thigh meat was considerably higher (5.1 μg/g) than the levels in chicken breast meat (2.4 μg/g). Whether the chicken had skin or not or whether the meat was on the bone or not, did not appear to determine heme iron levels. In addition, the method used to cook chicken did not alter the heme iron values (Table 4).
4. Discussion
There are no reference materials that are certified for heme iron. The accuracy of the heme iron analysis was validated by demonstrating that the material balance (100% × (heme iron + non-heme iron)/total iron) for the in-house control samples and selected meat samples were close to 100%.
Initial results in the development phase gave poor recoveries. It was determined that traditional molecular absorbance measurements of heme iron (following acidified extraction) were biased high due to background absorbance. This problem was reduced by using measurements at 500 nm and 600 nm to extrapolate to the background at 540 nm. However, these values were still greater than those obtained by FAAS and gave material balances in excess of 100%. The validity of the acidified acetone extraction was confirmed by HPLC. Sample extracts provided single peaks whose retention times agreed with the hemin standard and whose quantity agreed with the FAAS analysis (data not shown). Consequently, FAAS was used for all the heme iron values reported here.
Measurements of total iron and non-heme iron by FAAS (following acid digestion) were biased low due to an undetermined interference. Analysis of the digested samples using FAAS and the method of additions confirmed suppression of the iron signals by 20% to 40% (data not shown). Accurate analysis of the acid digests was obtained using ICP-AES, yielding values equivalent to those obtained using FAAS and the method of additions. Thus, material balances of approximately 100% were achieved by analyzing heme iron by FAAS and total iron and non-heme iron by ICP-AES.
In general, the values for total iron and heme iron (Tables 2-4) determined in the present study fall within the range of values that have been reported previously in the literature. However, prior to this study, there was no available heme iron database to use in conjunction with dietary data from epidemiologic studies to estimate heme iron intake according to meat type, cooking method and doneness level.
We found that the heme iron content of various meat types varied considerably, even within meat types from the same animal; for example, heme iron values of steak, hamburger and roast beef were different. Differences in iron levels by species, muscle type, age and breed have been documented in the literature [12-14,17,18].
There were no clear effects of cooking method or doneness level on heme iron levels within meat types (Tables 1-3). Previous research has consistently shown that the total iron concentration (μg iron/g meat) increases with cooking (raw versus cooked) and with the level of doneness (cooking temperature) [12-14]; this occurs due to the loss of mass of meat with cooking, while the mass of the relatively non-volatile iron remains constant or may increase as heme iron is degraded at higher temperatures. The concentration of heme iron at any temperature will depend on the loss of meat mass and the degree of degradation of heme iron; this ratio is further complicated by the type and length of cooking, factors that determine the temperature the heme iron experiences. Results from previous studies are mixed, both increases and decreases in the heme iron concentration have been reported [12-15]. Consequently, the lack of a visible trend for heme iron concentration versus doneness in Tables 2-4 is not surprising.
Red meat intake has been associated with a variety of chronic diseases, including diabetes [24], cardiovascular disease [25] and cancer [1] and there are several potential mechanisms involved, including increased exposure to heme iron. Iron overload has many detrimental effects, irrespective of the iron source; therefore, the human body has tight homeostatic control of this trace element. However, the absorption of heme iron is less well regulated than the absorption of non-heme iron [2,3]. In addition to being more readily absorbed than non-heme iron, there are detrimental effects pertaining to heme iron specifically, including cytotoxicity [6,7], and increased endogenous formation of NOCs, which is not affected by nonheme iron intake [10].
Interest in heme iron intake has been escalating over recent years, leading some investigators to estimate intake of heme iron using proportions of total iron. There are two methods of estimating heme iron: by using 40% of total iron from meat [15,26,27] or by using meatspecific proportions: 69% for beef; 39% for pork, ham, bacon, pork-based luncheon meats, and veal; 26% for chicken and fish; 21% for liver [16]. Although the animal specific proportions are more realistic, our data shows that heme iron values in different types of meat derived
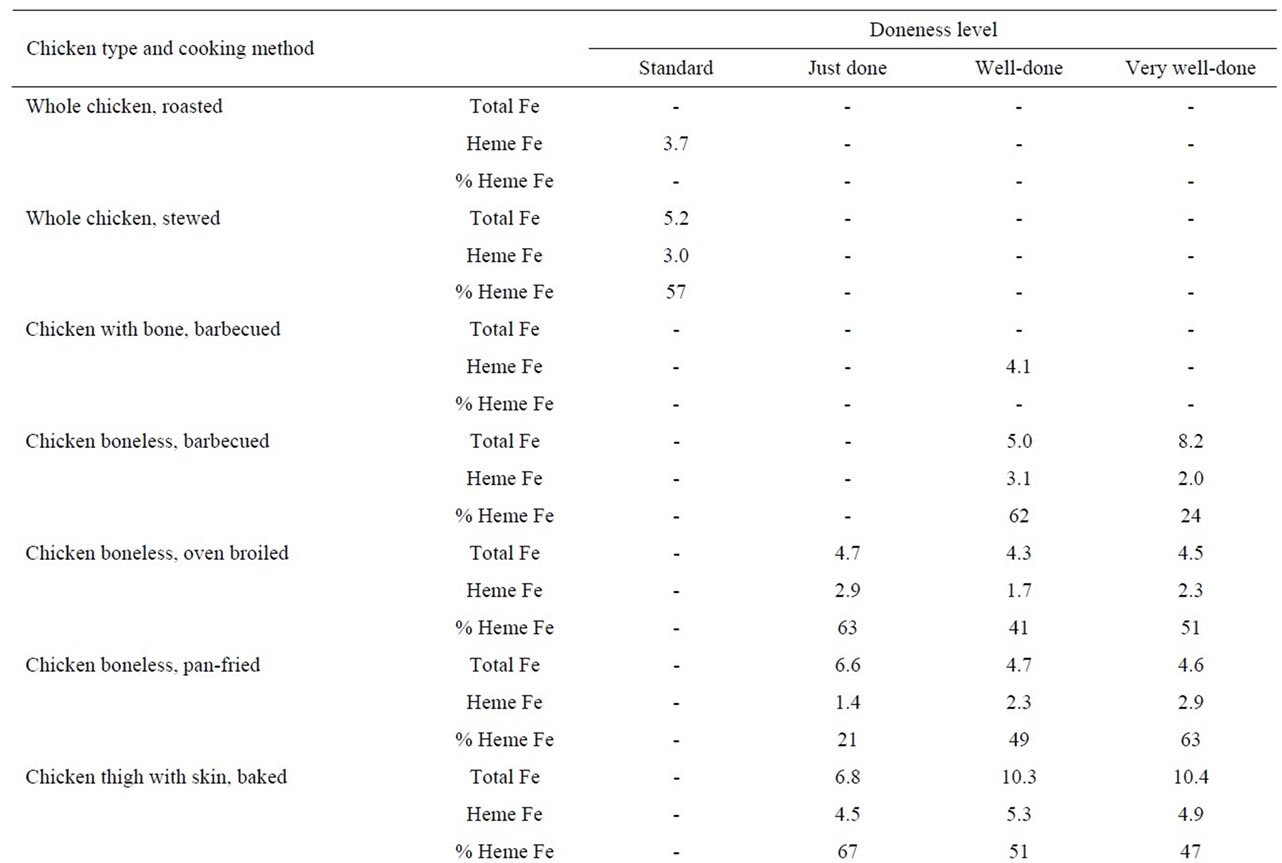
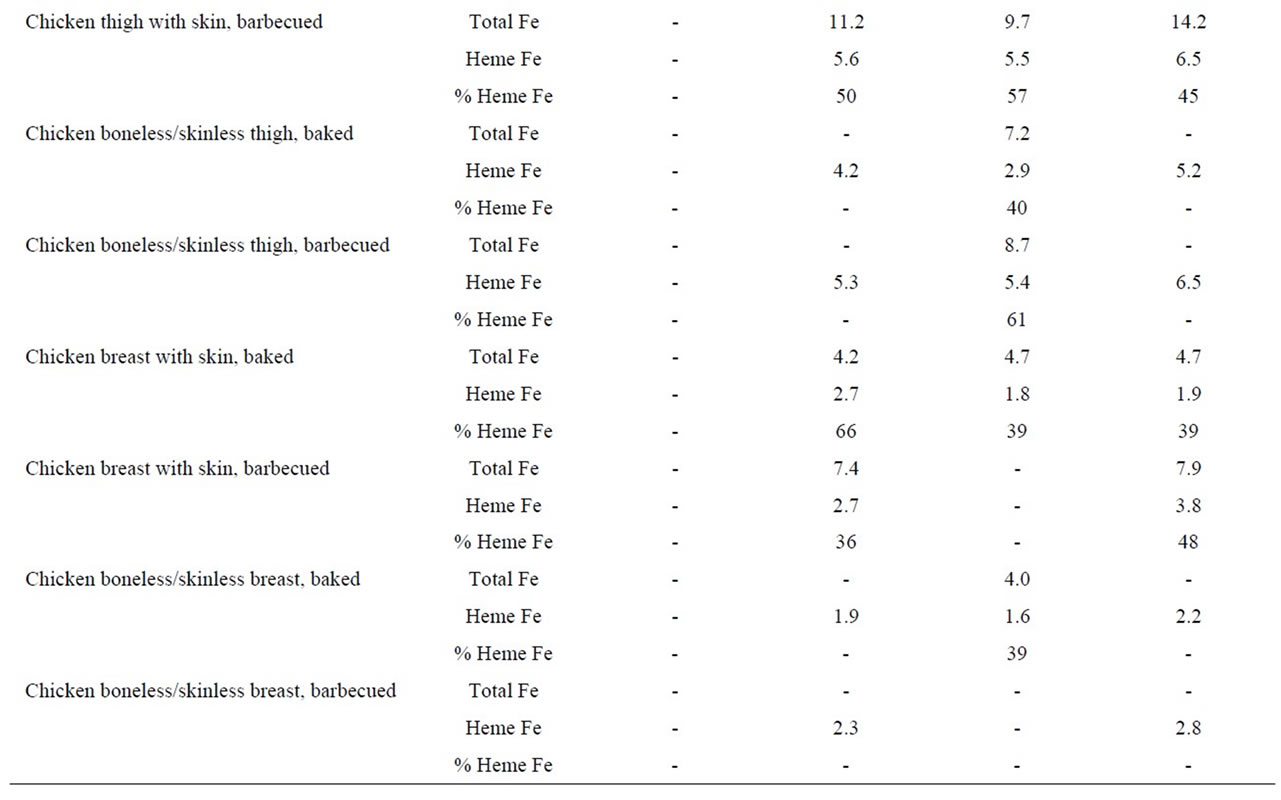
Table 4. Heme iron content (mg/g) of chicken according to meat type, cooking method and doneness level.
from the same animal have varying heme iron contents. Using such estimations has led to inconclusive data for the association between heme iron intake and a variety of cancers. For colon cancer, one study reported an association between heme iron intake and higher risk for proximal colon cancer [27], another two studies reported suggestive/borderline statistically significant positive associations [16,28], whereas the most recent study was null [29]. In addition, a positive association between heme iron intake and lung cancer risk has been reported [30], as well as a suggestive, but not statistically significant, positive association for upper digestive tract tumors [26], but no association for cancer of the breast [31] or endometrium [32] in a Canadian cohort of women.
Despite the advantages of being able to estimate heme iron intake using laboratory measurements for a variety of meat types for the first time in epidemiologic studies, there are some limitations to this data. Some of the meat samples were extremely non-homogeneous with regard to fat, gristle, and charred pieces of meat; while the inhouse reference material did not have variations arising from cooking, it did suffer from the same fat and gristle inclusions. Furthermore, all of the meat samples analyzed were bought locally and although many were brand name products, allowing the data to represent nationally available foods, it may not adequately represent meat items from other countries; in addition, the cooking techniques used may not reflect those used in other countries. Finally, each of the measurements on a specific meat type by cooking method and doneness level was made on only one composite sample; therefore, we were unable to estimate the variation within each subcategory.
In conclusion, we report the methodologies used to create a heme iron database that can be used in conjunction with food frequency questionnaires to estimate heme iron intake in relation to disease outcome in epidemiologic studies. We found considerable differences in the heme iron content of various meat types. However, in contrast to the literature, we did not observe an effect of cooking methods or doneness level on the heme-iron content of meat.
5. Acknowledgements
AJC and RS are responsible for the design of the study and for writing the manuscript. JMH is responsible for collection and analysis of the data. LMF and AR provided help with the analysis of the data. STM provided significant consultation. Furthermore, we have no financial or personal relationships with the company or organization sponsoring the research at the time the research was done.
REFERENCES
- WCRF, “Food, Nutrition, Physical Activity, and the Prevention of Cancer: A Global Perspective,” World Cancer Research Fund/American Institute for Cancer Research, Washington DC, 2007.
- M. Layrisse, J. D. Cook, C. Martinez, M. Roche, I. N. Kuhn, R. B. Walker and C. A. Finch, “Food Iron Absorption: A Comparison of Vegetable and Animal Foods,” Blood, Vol. 33, No. 3, 1969, pp. 430-443.
- C. E. Carpenter and A. W. Mahoney, “Contributions of Heme and Nonheme Iron to Human Nutrition,” Critical Reviews in Food Science and Nutrition, Vol. 31, No. 4, 1992, pp. 333-367. doi:10.1080/10408399209527576
- M. Glei, G. O. Latunde-Dada, A. Klinder, T. W. Becker, U. Hermann, K. Voigt and B. L. Pool-Zobel, “IronOverload Induces Oxidative DNA Damage in the Human Colon Carcinoma Cell Line HT29 Clone 19A,” Mutation Research, Vol. 519, No. 1-2, 2002, pp. 151-161.
- A. Tappel, “Heme of Consumed Red Meat Can Act as a Catalyst of Oxidative Damage and Could Initiate Colon, Breast and Prostate Cancers, Heart Disease and Other Diseases,” Medical Hypotheses, Vol. 68, No. 3, 2007, pp. 562-564. doi:10.1016/j.mehy.2006.08.025
- A. L. Sesink, D. S. Termont, J. H. Kleibeuker and R. Van der Meer, “Red Meat and Colon Cancer: The Cytotoxic and Hyperproliferative Effects of Dietary Heme,” Cancer Research, Vol. 59, 1999, pp. 5704-5709.
- A. L. Sesink, D. S. Termont, J. H. Kleibeuker and R. Van Der Meer, “Red Meat and Colon Cancer: Dietary Haem, but Not Fat, Has Cytotoxic and Hyperproliferative Effects on Rat Colonic Epithelium,” Carcinogenesis, Vol. 21, No. 10, 2000, pp. 1909-1915. doi:10.1093/carcin/21.10.1909
- F. Pierre, A. Freeman, S. Tache, R. Van der Meer and D. E. Corpet, “Beef Meat and Blood Sausage Promote the Formation of Azoxymethane-Induced Mucin-Depleted Foci and Aberrant Crypt Foci in Rat Colons,” Journal of Nutrition, Vol. 134, No. 10, 2004, pp. 2711-2716.
- R. Hughes, A. J. Cross, J. R. Pollock and S. Bingham, “Dose-Dependent Effect of Dietary Meat on Endogenous Colonic N-Nitrosation,” Carcinogenesis, Vol. 22, No. 1, 2001, pp. 199-202. doi:10.1093/carcin/22.1.199
- A. J. Cross, J. R. Pollock and S. A. Bingham, “Heam, Not Protein or Inorganic Iron, Is Responsible for Endogenous Intestinal N-Nitrosation Arising from Red Meat,” Cancer Research, Vol. 63, No. 10, 2003, pp. 2358-2360.
- W. Lijinsky, “Chemistry and Biology of N-Nitroso Compounds,” Cambridge University Press, Cambridge, 1992.
- C. E. Carpenter and E. Clark, “Evaluation of Methods Used in Meat Iron Analysis and Iron Content of Raw and Cooked Meats,” Journal of Agricultural Food Chemistry, Vol. 43, No. 7, 1995, pp. 1824-1827. doi:10.1021/jf00055a014
- R. Kongkachuichai, P. Napatthalung and R. Charoensiri, “Heme and Non-Heme Iron Content of Animal Products Commonly Consumed in Thailand,” Journal of Food Composition and Analysis, Vol. 15, No. 4, 2002, pp. 389-398. doi:10.1006/jfca.2002.1080
- G. Lombardi-Boccia, B. Martinez-Dominguez and A. Aguzzi, “Total Heme and Non-Heme Iron in Raw and Cooked Meats,” Food and Chemical Toxicology, Vol. 67, No. 5, 2002, pp. 1738-1741.
- E. R. Monsen and J. L. Balintfy, “Calculating Dietary Iron Bioavailability: Refinement and Computerization,” Journal of the American Dietetic Association, Vol. 80, No. 4, 1982, pp. 307-311.
- H. F. Balder, J. Vogel, M. C. Jansen, M. P. Weijenberg, P. A. van den Brandt, S. Westenbrink, R. van der Meer and R. A. Goldbohm, “Heme and Chlorophyll Intake and Risk of Colorectal Cancer in the Netherlands Cohort Study,” Cancer Epidemiology, Biomarkers & Prevention, Vol. 15, 2006, pp. 717-725. doi:10.1158/1055-9965.EPI-05-0772
- C. Martinez-Torres, I. Leets, P. Taylor, J. Ramirez, M. del V. Camacho and M. Layrisse, “Heme, Ferritin and Vegetable Iron Absorption in Humans from Meals Denatured of Heme Iron during the Cooking of Beef,” Journal of Nutrition, Vol. 116, No. 9, 1986, pp. 1720-1725.
- B. R. Schricker and D. D. Miller, “Effects of Cooking and Chemical Treatment on Heme and Nonheme Iron in Meat,” Journal of Food Science, Vol. 48, No. 4, 1983, p. 1340. doi:10.1111/j.1365-2621.1983.tb09225.x
- J. O. Igene, J. A. King, A. M. Pearson and J. I. Gray, “Influence of Heme Pigments, Nitrite, and Non-Heme Iron on Development of Warmed-Over Flavor (WOF) in Cooked Meat,” Journal of Agricultural and Food Chemistry, Vol. 27, No. 4, 1979, pp. 838-841. doi:10.1021/jf60224a052
- R. Sinha, M. G. Knize, C. P. Salmon, E. D. Brown, D. Rhodes, J. S. Felton, O. A. Levander and N. Rothman, “Heterocyclic Amine Content of Pork Products Cooked by Different Methods and to Varying Degrees of Doneness,” Food and Chemical Toxicology, Vol. 36, No. 4, 1998, pp. 289-297. doi:10.1016/S0278-6915(97)00159-2
- R. Sinha, N. Rothman, C. P. Salmon, M. G. Knize, E. D. Brown, C. A. Swanson, D. Rhodes, S. Rossi, J. S. Felton and O. A. Levander, “Heterocyclic Amine Content in Beef Cooked by Different Methods to Varying Degrees of Doneness and Gravy Made from Meat Drippings,” Food and Chemical Toxicology, Vol. 36, No. 4, 1998, pp. 279- 287. doi:10.1016/S0278-6915(97)00162-2
- R. Sinha, N. Rothman, E. D. Brown, C. P. Salmon, M. G. Knize, C. A. Swanson, S. C. Rossi, S. D. Mark, O. A. Levander and J. S. Felton, “High Concentrations of the Carcinogen 2-Amino-1-methyl-6-phenylimidazo-[4,5-b] pyridine (PhIP) Occur in Chicken but Are Dependent on the Cooking Method,” Cancer Research, Vol. 55, 1995, pp. 4516-4519.
- H. C. Hornsey, “The Colour of Cooked Cured Pork. I.- Estimation of the Nitric Oxide-Haem Pigments,” Journal of the Science of Food and Agriculture, Vol. 7, No. 8, 1956, pp. 534-540. doi:10.1002/jsfa.2740070804
- T. T. Fung, M. Schulze, J. E. Manson, W. C. Willett and F. B. Hu, “Dietary Patterns, Meat Intake, and the Risk of Type 2 Diabetes in Women,” Archives of Internal Medicine, Vol. 164, No. 20, 2004, pp. 2235-2240. doi:10.1001/archinte.164.20.2235
- L. Qi, R. M. van Dam, K. Rexrode and F. B. Hu, “Heme Iron From Diet as a Risk Factor for Coronary Heart Disease in Women with Type 2 Diabetes,” Diabetes Care, Vol. 30, No. 1, 2007, pp. 101-106. doi:10.2337/dc06-1686
- D. H. Lee, K. E. Anderson, A. R. Folsom and D. R. Jacobs, Jr., “Heme Iron, Zinc and Upper Digestive Tract Cancer: The Iowa Women’s Health Study,” International Journal of Cancer, Vol. 117, No. 4, 2005, pp. 643-647. doi:10.1002/ijc.21215
- D. H. Lee, K. E. Anderson, L. J. Harnack, A. R. Folsom and D. R. Jacobs, Jr., “Heme iron, Zinc, Alcohol Consumption, and Colon Cancer: Iowa Women’s Health Study,” Journal of the National Cancer Institute, Vol. 96, No. 5, 2004, pp. 403-407. doi:10.1093/jnci/djh047
- S. C. Larsson, H. O. Adami, E. Giovannucci and A. Wolk, “Re: Heme Iron, Zinc, Alcohol Consumption, and Risk of Colon Cancer,” Journal of the National Cancer Institute, Vol. 97, No. 3, 2005, pp. 232-233. doi:10.1093/jnci/dji032
- G. C. Kabat, A. B. Miller, M. Jain and T. E. Rohan, “A Cohort Study of Dietary Iron and Heme Iron Intake and Risk of Colorectal Cancer in Women,” British Journal of Cancer, Vol. 97, 2007, pp. 118-122. doi:10.1038/sj.bjc.6603837
- D. H. Lee and D. R. Jacobs, Jr., “Interaction among Heme Iron, Zinc, and Supplemental Vitamin C Intake on the Risk of Lung Cancer: Iowa Women’s Health Study,” Nutrition & Cancer, Vol. 52, No. 2, 2005, pp. 130-137. doi:10.1207/s15327914nc5202_3
- G. C. Kabat, A. B. Miller, M. Jain and T. E. Rohan, “Dietary Iron and Heme Iron Intake and Risk of Breast Cancer: A Prospective Cohort Study,” Cancer Epidemiology, Bio-markers & Prevention, Vol. 16, No. 6, 2007, pp. 1306-1308. doi:10.1158/1055-9965.EPI-07-0086
- G. C. Kabat, A. B. Miller, M. Jain and T. E. Rohan, “Dietary Iron and Haem Iron Intake and Risk of Endometrial Cancer: A Prospective Cohort Study,” British Journal of Cancer, Vol. 98, 2008, pp. 194-198. doi:10.1038/sj.bjc.6604110
NOTES
*Corresponding author.