International Journal of Medical Physics, Clinical Engineering and Radiation Oncology
Vol.06 No.01(2017), Article ID:73745,21 pages
10.4236/ijmpcero.2017.61005
Measurement and Analysis of PDDs Profile and Output Factors for Small Field Sizes by cc13 and Micro-Chamber cc01
Muhammad Kamran Rasheed Nasir1, Nauman Amjad2, Aasia Razzaq2, Tariq Siddique1
1Pakistan Institute of Engineering & Applied Sciences (PIEAS), Islamabad, Pakistan
2Institute of Nuclear Medicine and Oncology Lahore (INMOL), Lahore, Pakistan

Copyright © 2017 by authors and Scientific Research Publishing Inc.
This work is licensed under the Creative Commons Attribution International License (CC BY 4.0).
http://creativecommons.org/licenses/by/4.0/


Received: August 30, 2016; Accepted: January 20, 2017; Published: January 23, 2017
ABSTRACT
Small radiation fields are abundantly used in modern radiotherapy techniques like in IMRT and SRS. In order to commission these techniques, dosimetric data for small fields is required. The purpose of this study is to compare dosimetric measurements with two different ion chambers cc13, and cc01 for smaller fields. Dosimetric measurements are beam profile, output factor, pdds, and collimator factor. Dosimetric data is acquired in water phantom for two different photon beam energies 6 MV and 15 MV with zero gantry angle. In beam profiles cc13 chamber, measure wider penumbra as compare to cc01. And this wider measurement of penumbra occurs for smaller as well as for larger field sizes. Accumulated relative error in the measurement of penumbra for number of field sizes and 6 MV at dmax, and at 10 cm depth are 34.32% and 27.72% respectively. Accumulated relative error in the mea- surement of penumbra for number of field sizes and 15 MV at dmax, and at 10 cm depth are 28.49% and 23.92%. In case of output factor for smaller fields cc13 underestimates the output factor relative to cc01, with non-linear increase for smaller fields. But for larger fields, this increase in output factor is almost linear difference of two chambers is decreased. For very smaller fields <2 cm × 2 cm, relative error in output factor of cc13 and cc01 is greater than 5% and rapidly increases with decreasing field size. But for lager fields, this relative error is negligible. In measurement of pdds after the buildup region difference occurs in the response of two chambers cc13 and cc01 for smaller fields. For field sizes ≤2 cm × 2 cm average cc13-cc01 at various depths 30 cm, 40 cm, 50 cm, 60 cm, 70 cm, and 80 cm is almost greater than 0.5 cm. And similarly as output factor, this difference (cc13-cc01) increases with field size decreasing.
Keywords:
Percentage Depth Dose PDD, Intensity Modulation Radiotherapy IMRT, Stereotactic Radio Surgery SRS, Measurement of Output Factor scp

1. Introduction
Conventionally in radiotherapy, all the fields smaller than 4 cm × 4 cm are considered as small radiation fields. In advance radiotherapy techniques like IMRT, SRT, and SRS small radiation fields are used. Because of the absence of lateral electron equilibrium at field edges steep dose gradients and non-linear dose rate variation with decreasing field size, number of challenges are attached with the dosimetry of small fields [1] .
These challenges are related with, definition of the field size, traditional field size definition (at FWHM) bring improper results, accuracy in measurement of standard dosimetric parameters, and calculation of dose for patients by TPS is also a challenge. Because of all these aspects dosimetry of small field is more concerning as compare to larger fields. Volume averaging due to lack of charge particle equilibrium creates difficulties in small field measurements. This effect is define as “detector measures the dose by averaging the dose (signal) over the entire volume of the detector”. Variation in the signal for small fields is not linear especially at the region of steep dose gradients. So that for larger detectors, average value will not provide good results as smaller can [2] [3] [4] .
Therefore in the measurement of standard dosimetric parameters detector dimension and its special resolution plays an important role. Number of detectors are recommended for small field dosimetry, but no one fulfil all requirements of small field dosimetry. Some limitations are attached with almost all dosimeters. Here, some dosimeters that are useful for smaller field with their propertis are discussed.
Radiographic film dosimeters are widely used for smaller field dosimetry because of greater spatial resolution and capable for two dimensional dosimetry. Various drawbacks are also related with radiographic films like artifacts in film processing, film handling, higher energy dependence for low energy radiations, selection of phantom material, and directional dependence. But because of easy availability of films, film developing system and superb spatial resolution, these dosimeters are used for SRS commissioning and patient treatment plan verification [3] . Radiochromic films having number of advantages over radiographic films like absence of energy dependence, self-developing, tissue equivalent, and greater spatial resolution. Property of self-developing reduces the error of film processing. Earlier models have poor sensitivity and are useful only for high dose measurement. Newer models like MD-55 and EBT radiochromic are more sensitive and useful for radiological and clinical measurements. EBT radiochromic films are specially design for dosimetric measurement of IMRT. Sensitivity of EBT radiochromic films is five to ten time greater than MD-55. For quality assurance of IMRT EBT films are widely used. But proper choice and calibration is required for densitometry system [5] .
For low energy (kV range) photons, these chambers shows water equivalence, but use of it for high energy photons beam dosimetry needed a correction factor. From the literature kQ correction factor is used. Medium size chambers have the volume range of 0.1 to 1.0 cm3. Larger volume of these chambers makes them useless for the purpose of small field’s dosimetry. Minimum field’s size where these chambers can be used is 3 × 3 cm2. These pinpoint chambers also needs kQ correction when used for small fields of high energy MV range. These chambers have sensitive volumes 0.0l5 cm3 to 0.03 cm3 with diameter 2 mm to 2.9 mm. Because of smaller volume cable and stem effect for example, as compared to larger ionization, chambers are greater. These chambers have spatial resolution as good as 2 mm and it increases when scans are taken perpendicular to the chamber axis. This positioning helps in the relative dosimetry. High spatial resolution makes ideal for dose measurement in smaller fields. Waterproof fully guarded chambers and was useful in water, air and solid water phantoms [6] .
2. Materials and Methods
ONCOR Impression linear accelerator(Siemens) at INMOL (Pakistan) is used to generate high energy photon fields. Available photon energy beams are 6 MV and 15 MV. 3-D water phantom (IBA company) is the most advance system for dosimetric measurements (commissioning and QA) is used. Majorly this phantom consists on 3-D high precision servo mechanism and water tank of Perspex. OminPro-Accept provide the fast and accurate dosimetric measurements of radiotherapy fields. Commonly used for commissioning and QA of linear accelerators. OminPro-Accept having number of new software for different dosimetric phantoms and detectors. OminPro-Accept provide one button icons to view number of dosimetric quantities i.e. isodose, TMR, profiles, depth doses, and absolute dose. All the standard dosimetric protocols (IAEA, IEC…) and specifications of the manufacturers are supported by this software. In this study two ionization chambers cc13 (IBA company) with active volume 0.13 cm3 and cc01 (IBA company) with active volume 0.01 cm3 are used. Sensitivity of cc13 is 3.8 × 10⁻⁹ C/Gy and of cc01is 4 × 10⁻¹⁰ C/Gy. Some parameters of these two ion chambers are given in Table 1 below [1] [7] .

Table 1. Parameters of cc13 and cc01 Ion chambers.
3. Results
3.1. Measurement of Beam Profile
Figure 1 shows beam profiles at depth dmax for photon beam energy 6 MV and of different small fields, Figure 1(a) for 1 cm × 1 cm and Figure 1(b) for 2 cm × 2 cm. In Figure 1, black line with solid squares represents the response of cc13
 (a)
(a) (b)
(b)
Figure 1. Beam profiles for smaller fields at photon beam energy 6 MV and depth dmax, (a) for field size 1 cm × 1 cm, (b) for field size 2 cm × 2 cm.
and with hollow squares is for cc01 chamber. Figure 2 shows beam profiles at depth dmax for photon beam energy 6 MV and of different larger fields. Figure 2(a) is for 9 cm × 9 cm and Figure 2(b) for 10 cm × 10 cm. In Figure 2, black line with solid squares represents the response of cc13 and with hollow squares is for cc01 chamber.
 (a)
(a) (b)
(b)
Figure 2. Beam profiles for larger fields at photon beam energy 6 MV and depth dmax, (a) for field size 9 cm × 9 cm, and (b) for field size 10 cm × 10 cm.
Figure 3 shows beam profiles at depth 10 cm for photon beam energy 6 MV and of different small fields. Figure 3(a) is for 1 cm × 1 cm and Figure 3(b) for 2 cm × 2 cm. In Figure 3, black line with solid squares represents the response of cc13 and hollow squares is for cc01 chamber. Figure 4 shows beam profiles at depth 10 cm for photon beam energy 6 MV and of different larger fields. Figure 4(a) is for 9 cm × 9 cm and Figure 4(b) for 10 cm × 10 cm. In Figure 4, black line with solid squares represents the response of cc13 and hollow squares is for cc01 chamber.
 (a)
(a) (b)
(b)
Figure 3. Beam profiles for smaller fields at photon beam energy 6 MV and depth 10 cm, (a) for field size 1 cm × 1 cm, (b) for field size 2 cm × 2 cm.
 (a)
(a) (b)
(b)
Figure 4. Beam profiles for larger fields at photon beam energy 6 MV and depth 10 cm, (a) for field size 9 cm × 9 cm, and (b) for field size 10 cm × 10 cm.
Figure 5 shows beam profiles at depth dmax for photon beam energy 15 MV and of different small fields. Figure 5(a) is for 1 cm × 1 cm and Figure 5(b) for 2 cm × 2 cm. In Figure 5, black line with solid squares represents the response of cc13 and with hollow squares is for cc01 chamber. Figure 6 shows beam profiles at depth dmax for photon beam energy 6 MV and of different larger fields,
 (a)
(a) (b)
(b)
Figure 5. Beam profiles for smaller fields at photon beam energy 15 MV and depth dmax, (a) for field size 1 cm × 1 cm, (b) for field size 2 cm × 2 cm.
Figure 6(a) is for 9 cm × 9 cm and Figure 6(b) for 10 cm × 10 cm. In Figure 6, black line with solid squares represents the response of cc13 and hollow squares is for cc01 chamber.
Figure 7 shows beam profiles at depth 10 cm for photon beam energy 15 MV and of different small fields. Figure 7(a) is for field size 1 cm × 1 cm, and Figure 7(b) for 2 cm × 2 cm. In Figure 7, black line with solid squares represents the
 (a)
(a) (b)
(b)
Figure 6. Beam profiles for larger fields at photon beam energy 15 MV and depth dmax, (a) for field size 9 cm × 9 cm, and (b) for field size 10 cm × 10 cm.
response of cc13 and with hollow squares is for cc01 chamber. Figure 8 shows beam profiles at depth 10 cm for photon beam energy 15 MV and of different larger fields. Figure 8(a) is for field size 9 cm × 9 cm, and Figure 8(b) for 10 cm × 10 cm. In Figure 8, black line with solid squares represents the response of cc13 and hollow squares is for cc01 chamber. Difference in the penumbra measurement of cc13 and cc01 for different fields is given in Table 2.
 (a)
(a) (b)
(b)
Figure 7. Beam profiles for smaller fields at photon beam energy 15 MV and depth 10 cm, (a) for field size 1 cm × 1 cm, (b) for field size 2 cm × 2 cm.
 (a)
(a) (b)
(b)
Figure 8. Beam profiles for larger fields at photon beam energy 15 MV and depth 10 cm, (a) for field size 9 cm × 9 cm, and (b) for field size 10 cm × 10cm.
Table 2. In this table for different fields small as well as large field, difference of penumbra measurement of cc13 and cc01 is given.
3.2. Measurement of Percentage Depth Dose
Calculations related with the measurement of prescribed dose and dose rate is based on some dosimetric data. One useful tool for these measurements is percentage depth dose [pdds]. After placing the dosimeter (cc13 and cc01) at center of radiation field, data for pdds is acquired for cc13 and cc01 respectively with increasing field size starts from 1 cm × 1 cm. Data acquisition for pdds is performed with constant SSD. Figure 9 shows results for pdds of smaller fields with ion chamber cc13 and cc01 for 6 MV photon beam. Figure 9(a) is for field size 1 cm × 1 cm and Figure 9(b) for 2 cm × 2c m. Figure 10 shows more pdds at 6 MV for field sizes 3 cm × 3 cm and 4 cm × 4 cm. Figure 10(a) is for field size 1 cm × 1 cm and Figures 10(b)-10(d) are for 2 cm × 2 cm, 3 cm × 3 cm, 4 cm × 4 cm respectively. These pdds are acquired with photon beam energy 15 MV.
Figure 11 shows results for pdds of smaller fields with ion chamber cc13 and cc01 for 15 MV photon beam. Figure 11(a) is for field size 1 cm × 1 cm and Figure 11(b) for 2 cm × 2 cm. Figure 12 shows more pdds at 15 MV for field sizes 3 cm × 3 cm and 4 cm × 4 cm.
In the case of pdds at different responses in percentage such as 30%, 40%, 50%, 60%, 70%, and 80% of two chambers cc13 and cc01, corresponding depth is measured. Difference in the depth of two chambers (cc13 - cc01) for smaller field is noticeable. For these differences average and standard deviation is calculated and given in Table 3 and Table 4 for 6 MV and 15 MV respectively. By using these standard deviations of percentage depth dose, graph is plotted between field size and standard deviation shown in Figure 13 for photon beam energy 6 MV and 15 MV respectively.
3.3. Measurement of Output Factor scp
Total scatter factor/output factor is define as, at a reference depth ratio of dose for given field size to the dose with reference (10 cm × 10 cm) field size. With increasing field sizes from 1 cm × 1 cm to 20 cm × 20 cm output factors were measured by using two ion chambers cc13 and cc01. Figure 14 represents results
 (a)
(a) (b)
(b)
Figure 9. For photon beam energy 6 MV, pdds acquired by two different ion chamber cc13 and cc01. Thicker line showing the response of cc13 and thiner is of cc01, (a) is for field size 1 cm × 1 cm, (b) is for 2 cm × 2 cm.
 (a)
(a) (b)
(b)
Figure 10. For photon beam energy of 6 MV, pdds acquired by two different ion chamber cc13 and cc01. Thicker line showing the response of cc13 and thiner is of cc01, (a) is for field size 3 cm × 3 cm, (b) is for 4 cm × 4 cm.
 (a)
(a) (b)
(b)
Figure 11. For photon beam energy of 15 MV, pdds acquired by two different ion chamber cc13 and cc01. Thicker line showing the response of cc13 and thiner is of cc01, (a) is for field size 1 cm × 1 cm, (b) is for 2 cm × 2 cm.
 (a)
(a) (b)
(b)
Figure 12. For photon beam energy of 15 MV, pdds acquired by two different ion chamber cc13 and cc01. Thicker line showing the response of cc13 and thiner is of cc01, (a) is for field size 3 cm × 3 cm, (b) is for 4 cm × 4 cm.
Table 3. For different response, say 30%, 40%, 50%, 60%, 70%, and at 80% dose dif- ference of crosponding depth of two ion chambers cc13 and cc01, average, standard deviation of these differences is calculated at photon beam energy 6 MV.
Table 4. For different response, say 30%, 40%, 50%, 60%, 70%, and at 80% dose dif- ference of crosponding depth of two ion chambers cc13 and cc01, average, standard deviation of these differences is calculated at photon beam energy 15 MV.
for total scatter factor measurement, with increasing field size. Lt. side is for photon energy 6 MV and Rt. side for 15 MV. In Figure 14, black line with solid squares represents the response of cc13 and with hollow squares is for cc01. In order to make more visible the underestimation of cc13 output factor for field sizes 1 cm × 1 cm and 2 cm × 2 cm is given in Figure 15, line with solid square is of cc13 and with circle is of cc01 [4] .
Relative error define as “((output factor by cc13 - output factor by cc01)/ output factor by cc13) * 100” is calculated and given in Table 5 [7] .
4. Discussion
Measurement of beam profiles by cc13 relative to cc01 clearly represents volume averaging effect. As at field edges (region of steep dose gradient), cc13 has larger volume as compared to cc01 measure wider penumbra. And this problem of wider
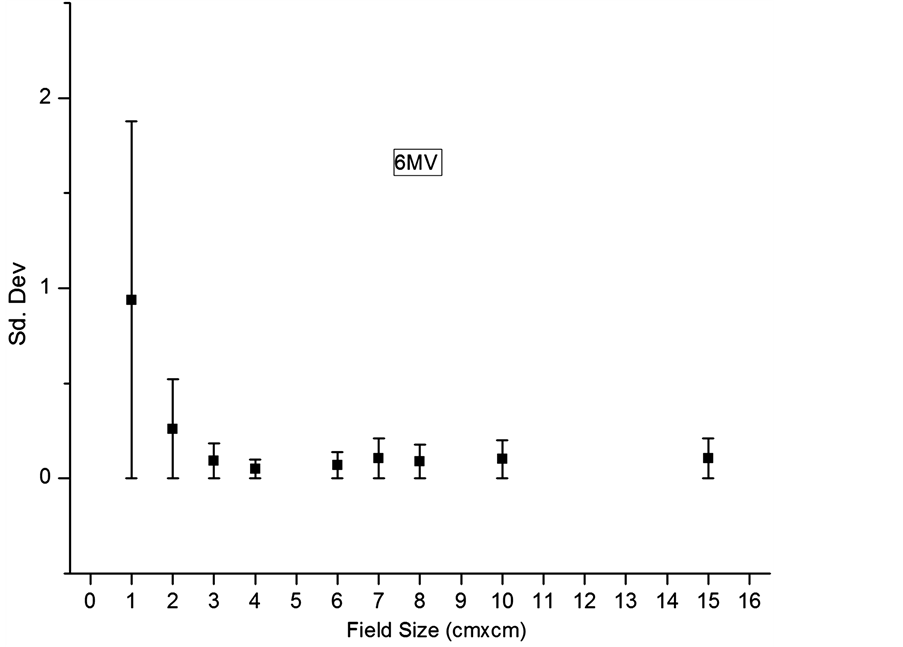
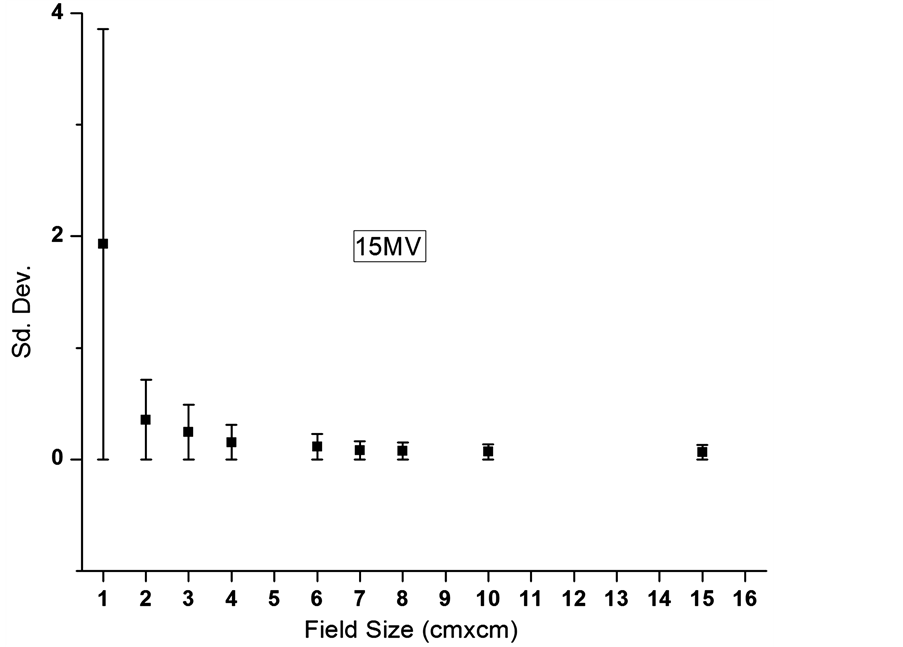
Figure 13. Standard devaition of percentaged depth dose vs increasing field size for photon energy 6 MV and 15 MV respectivly.


Figure 14. Output factor against increasing field size Lt. is for photon energies 6 MV Rt. is for 15 MV.


Figure 15. Dose underestimation by cc13as compared to cc01 for smaller fields.
Table 5. Relative error between cc13 and cc01 for total scattor facter measurement for different field size. For photon beam energy 6 MV, and 15 MV.
penumbra measurement of cc13 is present for both small as well as for large fields. All the figures of beam profiles, (from Figure 1 to Figure 8) represent this volume averaging effect. This wider penumbra measurement may be acceptable for plans which consist of four to five fields. But in the case of IMRT and SRS where we use number of small field, this wider penumbra measurement is not acceptable. In Table 2, difference between cc13 and cc01 penumbra measurement is given. From Table 2, it is clear that wider measurement of penumbra of cc13 relative to cc01 presents for almost all the dosimetric fields.
These graphs of percentage depth dose in Figure 9 and Figure 11 show larger difference in the response of two chambers for very small fields ≤2 cm × 2 cm as compare to large fields.
And this difference is almost negligible for larger fields ≥3 cm × 3 cm shown in Figure 10 and Figure 12. From Table 3 for 6 MV, relative variation in the standard deviation of these differences for small fields is almost 95%. And for large fields, this relative variation of standard deviation is 34%. From Table 4 for 15 MV, relative variation in the standard deviation of these differences for small fields is almost 92% and for large fields this variation is 44%. And from Figure 13, it is also shown that this variation error bar is larger for small fields as compare to large fields.
Figure 14 represents the measurement of output factor scp with increasing field size and for chambers cc13 and cc01. Because of charge particle disequilibrium and greater volume averaging for cc13 results in underestimation of output factor for smaller fields. This underestimation is clearly observed in Figure 15 for fields 1 cm × 1 cm and 2 cm × 2 cm. One of the reasons of this underestimation is that “accuracy in output factor measurement is achieved if active volume of the chamber is irradiated with uniform fluence of photon. For smaller fields and for cc13 this condition is not good as in the case of cc01. Hence cc13 results in underestimation of output factor. But for larger fields charge particle equilibrium is exist and negligible volume effect. Therefore this underestimation of output factor for larger fields is almost vanishes for cc13. Relative error in output factor of cc13 and cc01 is given in Table 5. Along with underestimation of cc13, variation in output factors for smaller fields is not linear. Therefore, measurement of output factors for smaller fields requires dosimeter of higher spatial resolution and smaller dimensions.
5. Conclusions
・ Non-linear behaviour of different dosimetric parameters for smaller fields strongly agrees with the further classification of smaller fields.
・ As cc13 measure wider penumbra, this affects the accuracy of target coverage and also affects the dose of the OAR. This affect integrated many times in IMRT treatment plans where we have a number of small fields. Therefore, this wider penumbra measurement is unacceptable for IMRT plans.
・ As the problem of penumbra is present for large fields, therefore beam profile (penumbra) should be measured with more sensitive chambers.
・ Use of conventional dosimetric protocols for smaller fields will overestimate patient dose.
・ More attention and dosimetric standards are required to commission smaller dosimetric field data.
6. Future Recommendations
A separate dosimetric protocol should be designed for the small field dosimetric calculations, useful for the IMRT and SRS. A comparison study for diamond detector and cc01 should be performed.
Cite this paper
Nasir, M.K.R., Amjad, N., Razzaq, A. and Siddique, T. (2017) Measurement and Analysis of PDDs Profile and Output Factors for Small Field Sizes by cc13 and Micro-Chamber cc01. Inter- national Journal of Medical Physics, Cli- nical Engineering and Radiation Oncology, 6, 36-56. https://doi.org/10.4236/ijmpcero.2017.61005
References
- 1. Palta, J.R. (2003) Linear Accelerator Acceptance Testing and Commissioning. Medical Physics, 30, 1356-1357. Ste 1 No 1, 2 Huntington Quadrangle, Melville, NY, 11747-4502. USA: American Association Physicists Medicine American Institute Physics.
- 2. Sharma, S. (2014) Challenges of Small Photon Field Dosimetry Are Still Challenging. Journal of Medical Physics, 39, 131-132.
https://doi.org/10.4103/0971-6203.138998 - 3. Wuerfel, J. (2013) Dose Measurements in Small Fields. Medical Physics International, 1, 81-90.
- 4. Laub, W.U. and Wong, T. (2003) The Volume Effect of Detectors in the Dosimetry of Small Fields Used in IMRT. Medical Physics, 30, 341-347.
https://doi.org/10.1118/1.1544678 - 5. Wilcox, E.E. and Daskalov, G.M. (2007) Evaluation of GAFCHROMIC® EBT Film for CyberKnife® Dosimetry. Medical Physics, 34, 1967-1974.
https://doi.org/10.1118/1.2734384 - 6. Calcina, C.S.G., de Oliveira, L.N., de Almeida, C.E. and de Almeida, A. (2007) Dosimetric Parameters for Small Field Sizes Using Fricke Xylenol Gel, Thermoluminescent and Film Dosimeters, and an Ionization Chamber. Physics in Medicine and Biology, 52, 1431-1439.
https://doi.org/10.1088/0031-9155/52/5/014 - 7. Chen, L., Chen, L.-X., Sun, H.-Q., Huang, S.-M., Sun, W.-Z., Gao, X.-W., et al. (2009) Measurements and Comparisons for Data of Small Beams of Linear Accelerators. Chinese Journal of Cancer, 28, 272-276.