Open Journal of Energy Efficiency
Vol.2 No.4(2013), Article ID:40880,17 pages DOI:10.4236/ojee.2013.24023
Towards Energy Conservation in Qatar
Qatar Environment and Energy Research Institute, Doha, Qatar
Email: darwish738@gmail.com, madarwish@qf.org.qa
Copyright © 2013 Mohamed Darwish. This is an open access article distributed under the Creative Commons Attribution License, which permits unrestricted use, distribution, and reproduction in any medium, provided the original work is properly cited.
Received August 13, 2013; revised September 13, 2013; accepted September 17, 2013
Keywords: Energy; Fuel; Electric Power; Conservation; Cogeneration Power Desalting Plants; Gas Turbine Combined Cycle; Multi Stage Flash Desalination; Reverse Osmosi
ABSTRACT
Qatar energy consumptions are among the highest in the world, and can easily serve double the present population. Energy conservation is a must, as the energy resources are finite, and their consumptions are increasing at alarming rates. The country depends on desalted seawater, which consumes extensive amounts of energy, and is produced by using the least energy efficient desalting system. The desalination process is vulnerable to many factors, and strategic water storage needs to be built. The high energy consumptions are ruining the air and marine environments. Several suggestions are introduced to conserve energy in the Cogeneration Power Desalting Plants (CPDP), by moving to replace the Multi Stage Flash (MSF) desalting system by the energy efficient Seawater Reverse Osmosis System (SWRO); fully utilizing the installed power capacity to desalt water in winter, when electric power load is low, and during summer non-peak hours for strategic water storage; and modifying the simple Gas Turbines (GT) Power cycle plants to GT combined cycle to raise the Electric Power (EP) generation efficiency (to about 50%).
1. Introduction
Energy conservation (i.e. using less energy for a service) is essential for the entire chain of energy; from fuel extraction, fuel energy conversion to Electric Power (EP) including EP generation, transmission and distribution to usage in industry, transportation, buildings, and for consumers; and consumed EP and fuel. In the hot, humid, and sunny Gulf Cooperation Countries (GCC), renewable energy sources such as solar can play a key role by utilizing plentiful solar energy to generate EP and to desalt seawater. The EP is necessary to meet cooling demands and other industrial and human activities. Desalting seawater and treating waste water for reuse are processes that consume extensive amounts of energy, and needed in this water-scarceregion. While renewable energy is important for sustainable future, Fossil Fuels (FFs) are continued to be the mainly used energy source for the foreseeable future. It’s therefore important to ensure that FFs are used as efficiently as possible while applying renewable energy application should be increasing.
Qatar is a small country but is ranking worldwide among the highest per capita (/ca) in: income, production and proven reserves of oil and Natural Gas (NG), energy(fuel and electricity) and water consumptions, CO2 emission, water scarcity, and shortage in food production. In 2010, Qatar’s economy grew by 19.40%: the fastest in the world. The rapid growth is due to ongoing increases in production and exports of Liquefied Natural Gas (LNG), oil, petrochemicals and related industries.
Qatar, the largest exporter of LNG, is a major force in global energy markets. Qatar’s Electric Power (EP) has grown considerably in recent years with amazing doubled installed EP capacity in just two years, 2009-2011, and doubled EP and Desalted seawater (DW) generations in 6 years (2004-2010). These raise concerns about the unusual vulnerabilities (or insecurity) in water, food, and environment.
The economy is steadily growing: oil and gas account for roughly 85% of export earnings and 70% of government revenues; these made the highest income/ca, [1]. Qatar’s successful 2022 world cup bid accelerates largescale infrastructure projects such as Qatar’s metro system, Qatar-Bahrain causeway, and solar Air Conditioning (AC) of nine stadiums. Qatar GDP (purchasing power parity) increased to $181.7 billion (estimated in 2011), compared to $153 billion and 131.2 billion estimated in 2010 and 2009 respectively [2].
The fast-growing economy, rapid urbanization, and increase of population result in raising demands on scarce water resources and energy, especially EP. These affect, negatively, air and marine environment, and make CO2 emission/ca the highest in the world. The energy forecast is expected to increase in Qatar about 6.6 times from 2000 to 2020, compared to 2.4 in Bahrain, 2.15 in Kuwait, 3.55 in Oman, 2.98 in Saudi Arabia, 2.83 in UAE, and 3.11 for all GCC, [3].
Current FF consumption patterns are not sustainable. Managing domestic demands for FF and EP remain key challenges. An energy-wasteful culture has grown up by subsidizing fuel and electricity prices. Qatar should adopt more energy-efficient practices in building design and transport infrastructure. The need for green buildings should be recognized, and environmental issues should be addressed through architecture to reduce the dependence of heavily air-conditioned buildings absorbing vast amounts of EP.
To conserve energy, consuming sectors are to be recognized, and measures to make them more efficient should be outlined. The main consuming sectors are the Cogeneration Power Desalting Plants (CPDP) producing both EP and DW; and building AC. The CPDPs account for more than 50% the fuel energy consumptions in most Gulf Co-operation Council (GCC). The AC load account for 70% of the EP peak summer load, and about 50% of annual EP consumption. Energy conservations in these two sectors, (CPDP and building AC), are discussed in this paper. The state of these two sectors (CPDP and building AC) is outlined first, and followed by suggested measure to lower their energy consumptions.
2. Qatar Prime Energy Production and Consumption
In 2011, total oil production was 1.638 Million barrel per day (Mbbl/d); including crude oil of 1.296, and the consumption was 0.16 Mbbl/day. The oil export was 1.478 Mbbl/day, [4].Oil production increased about 2.3 folds from 2001 to 2011; see Figure 1, [5].
Latest data on Natural Gas (NG) production, consumption, and export are given in the next table in terms of Billion Cubic Meter (BCM), and Billion Cubic Feet (BCF), [5].

The NG production increased about 5.4 folds from 27 BCM/y in 2001 to 146.8 BCM/y in 2011. Exported NG was 14.04 BCM/y in 2000 and became 113.7 BMC/y in 2011, almost 8 fold increase. In 2010 and 2011, Qatar’s

Figure 1. Oil production and consumptions in Qatar from 2001-2010 in 1000 bbl/d, [5].
NG exports by pipelines was 19.2 BCM/y, but as LNG export jumped from 76.1 BCM in 2010 to 102.6 BCM in 2011, or 35% in only one year, see Figure 2. The consumed primary energy (oil and NG) in Million ton oil equivalent (Mtoe) is given in Figure 3, [5].
The NG production increases are accompanied by continuously rising consumptions of total energy, oil and NG, Figure 2, [5]. NG consumption increased from 11 BCM in 2001 to 23.8 BCM in 2011, more than 2.16 folds in 10 years, and 16.4% annual increase from 2010 to 2011. Oil consumptions increased from 73,000 bbl/d in 2001 to 238,000 in 2011, 3.26 folds in 10 years; and 8.3% annual increase from 2010 to 2011. The total primary energy consumption in Million tons of oil equivalent (Mtoe) increases from 12.3 in 2001 to 29.4 in 2011; 2.38 folds in 10 years, and 14.1% increase from 2010 to 2011, Figure 3. In 2011, the 29.4 Mtoe includes 8 Mtoe for oil and 21.4 Mtoe for NG, i.e. 72.8% for NG and 27.2% for oil.
Table 1 summarizes the last 10 years history of fuel energy production and consumption in Qatar, [5].
The NG is a valuable resource that should be used efficiently. Its prices (in $/Million Btu as given in Figure 4), is continuously increasing worldwide, except in the US from 2009 to 2011. This special case in US is due to the higher NG production rate compared to consumption rate. The production increased from 511.1 BCM in 2005 to 651.3 in 2011, 27.4% in 6 years; or annual 4.2% increase; while the consumption increases from 623.4 to 690.1 BCM in the same period, or 10.6% in 6 years, or annual 1% increase. From 2010 to 2011, the production increases 7.7%, while the consumption increases only 2.4%.
3. Cogeneration Power Desalting Plants (CPDP) in Qatar
3.1. Electric Power
EP and Desalted seawater (DW) are necessities for living in Qatar. DW represents 99% of municipal water supply. AC is expensive summer necessity to deal with the hot and humid (average high 42˚C, although 50˚C was reported), Figure 5. AC equipment consumes 50% of EP productions, and 70% of peak summer load, [6].
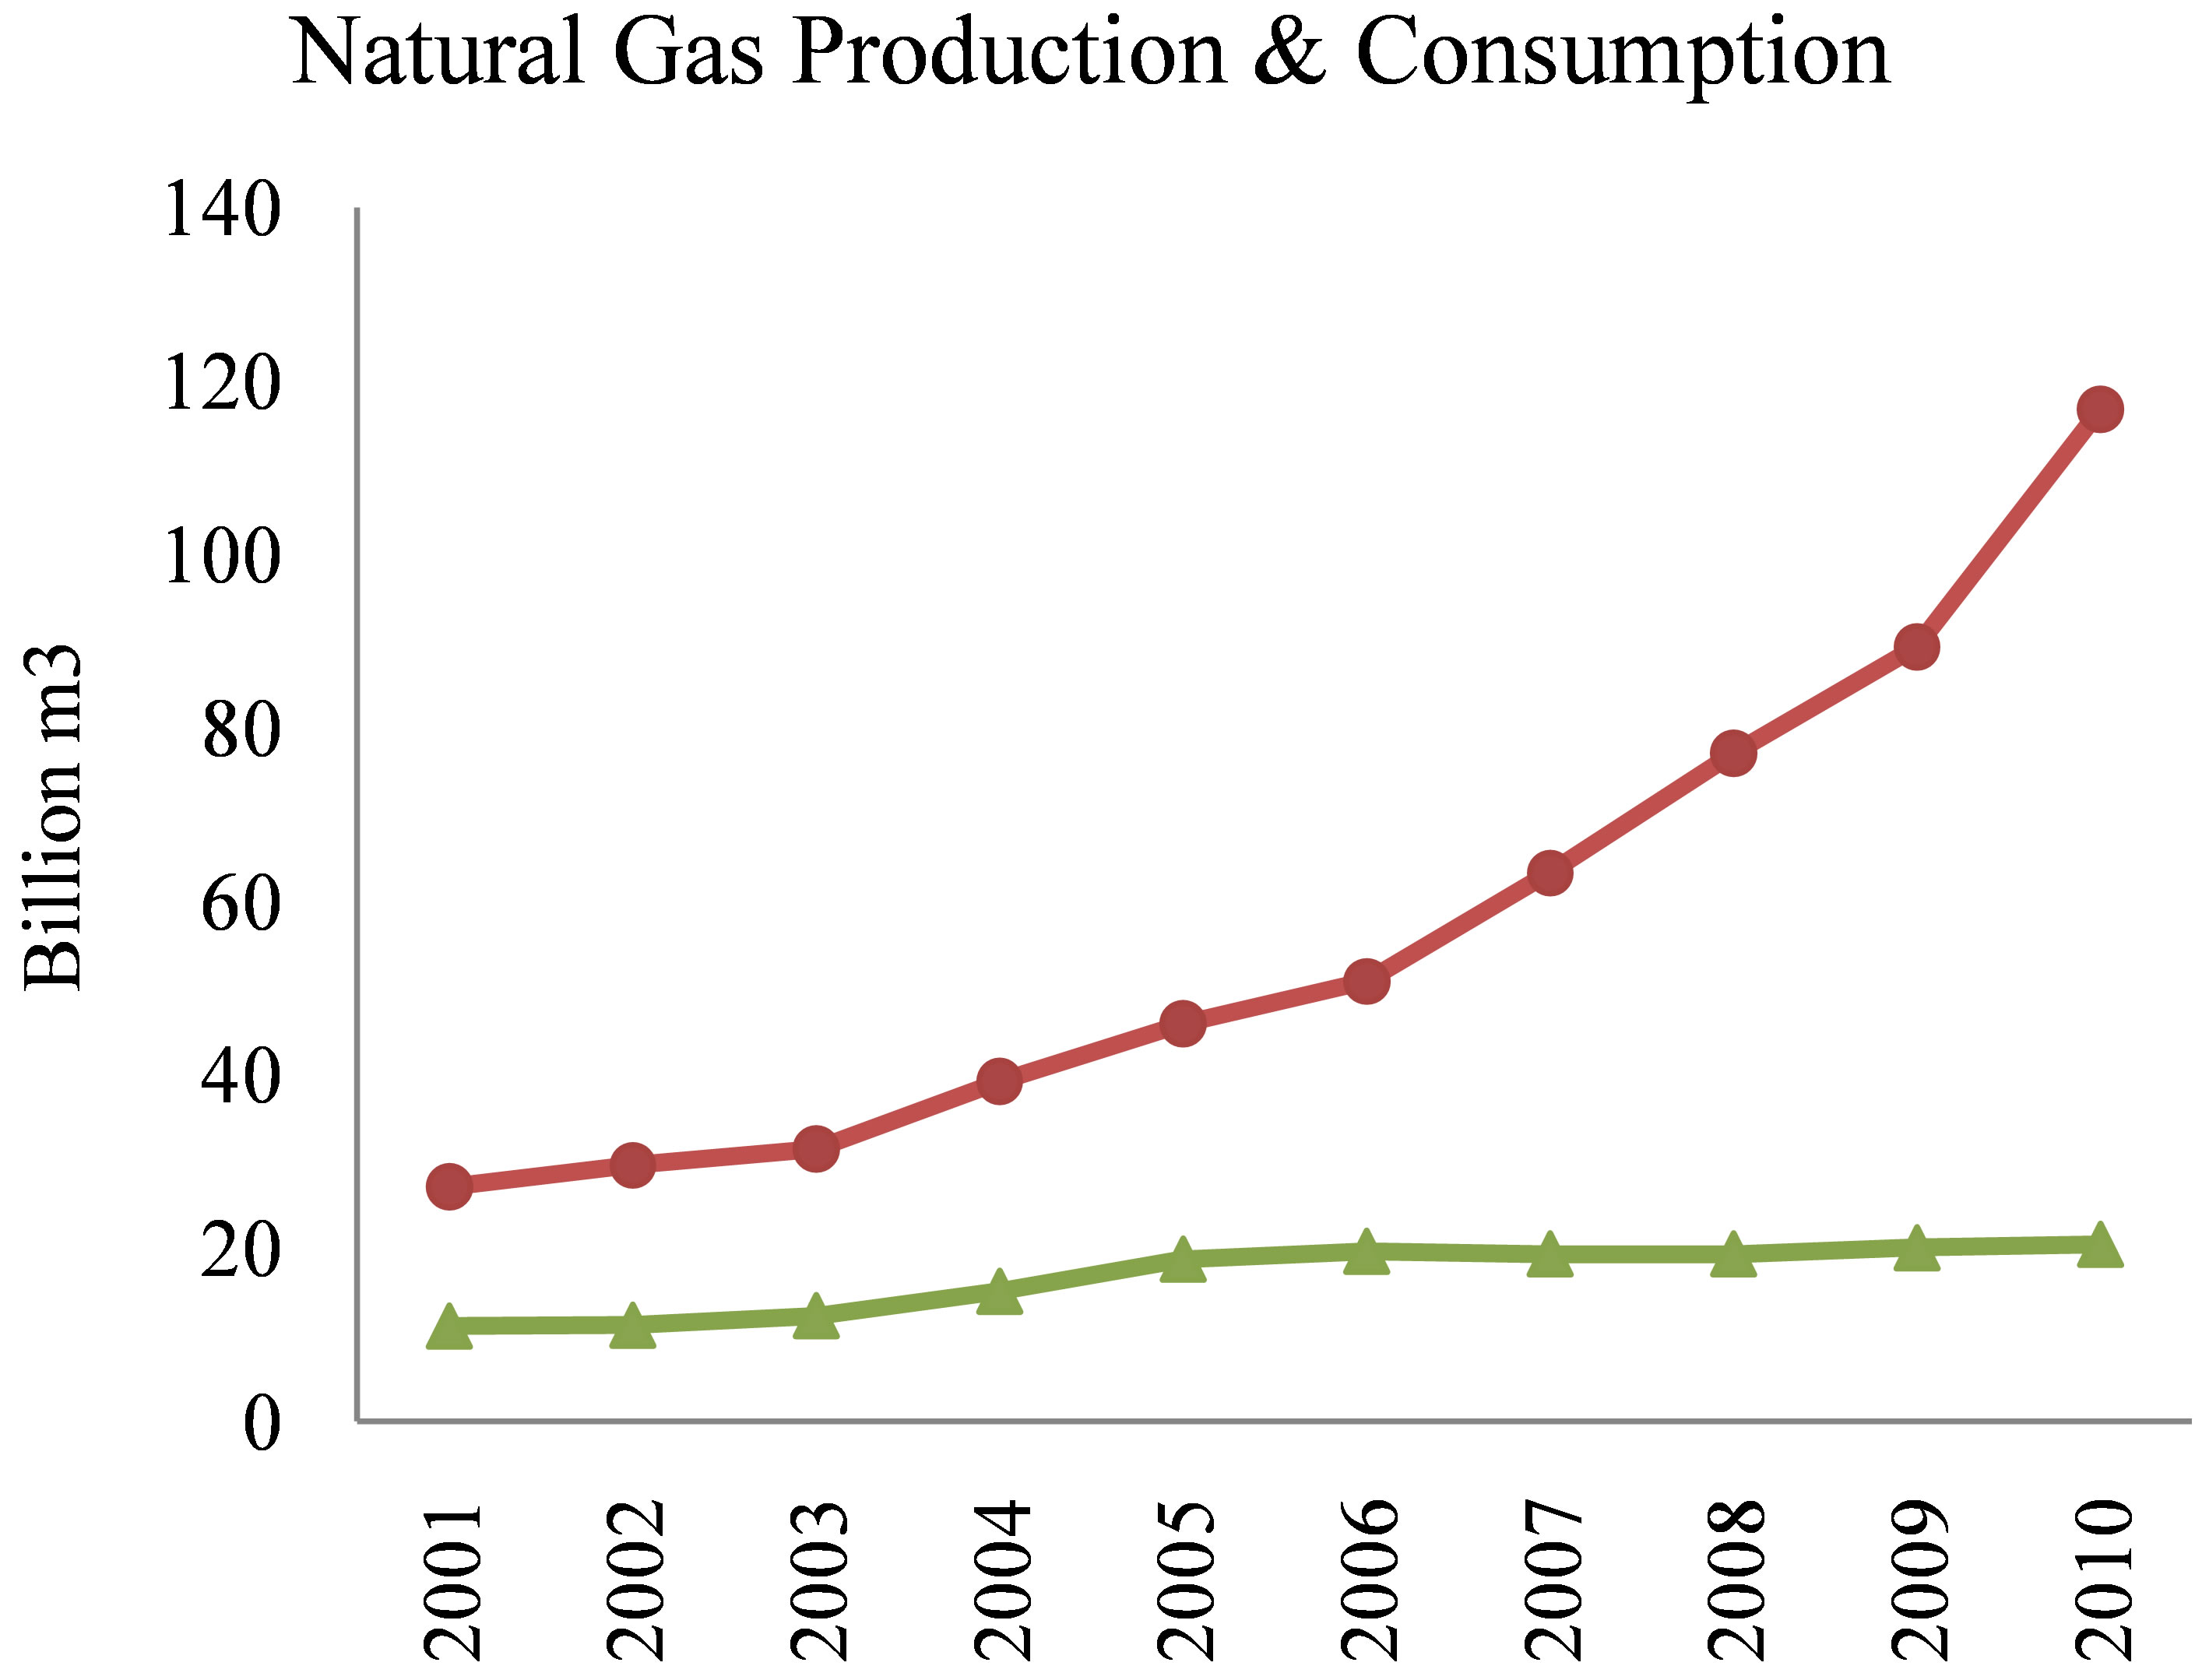
Figure 2. Natural gas production and consumptions in Qatar from 2001-2010 in Billion Cubic Meters (BCM), [5].
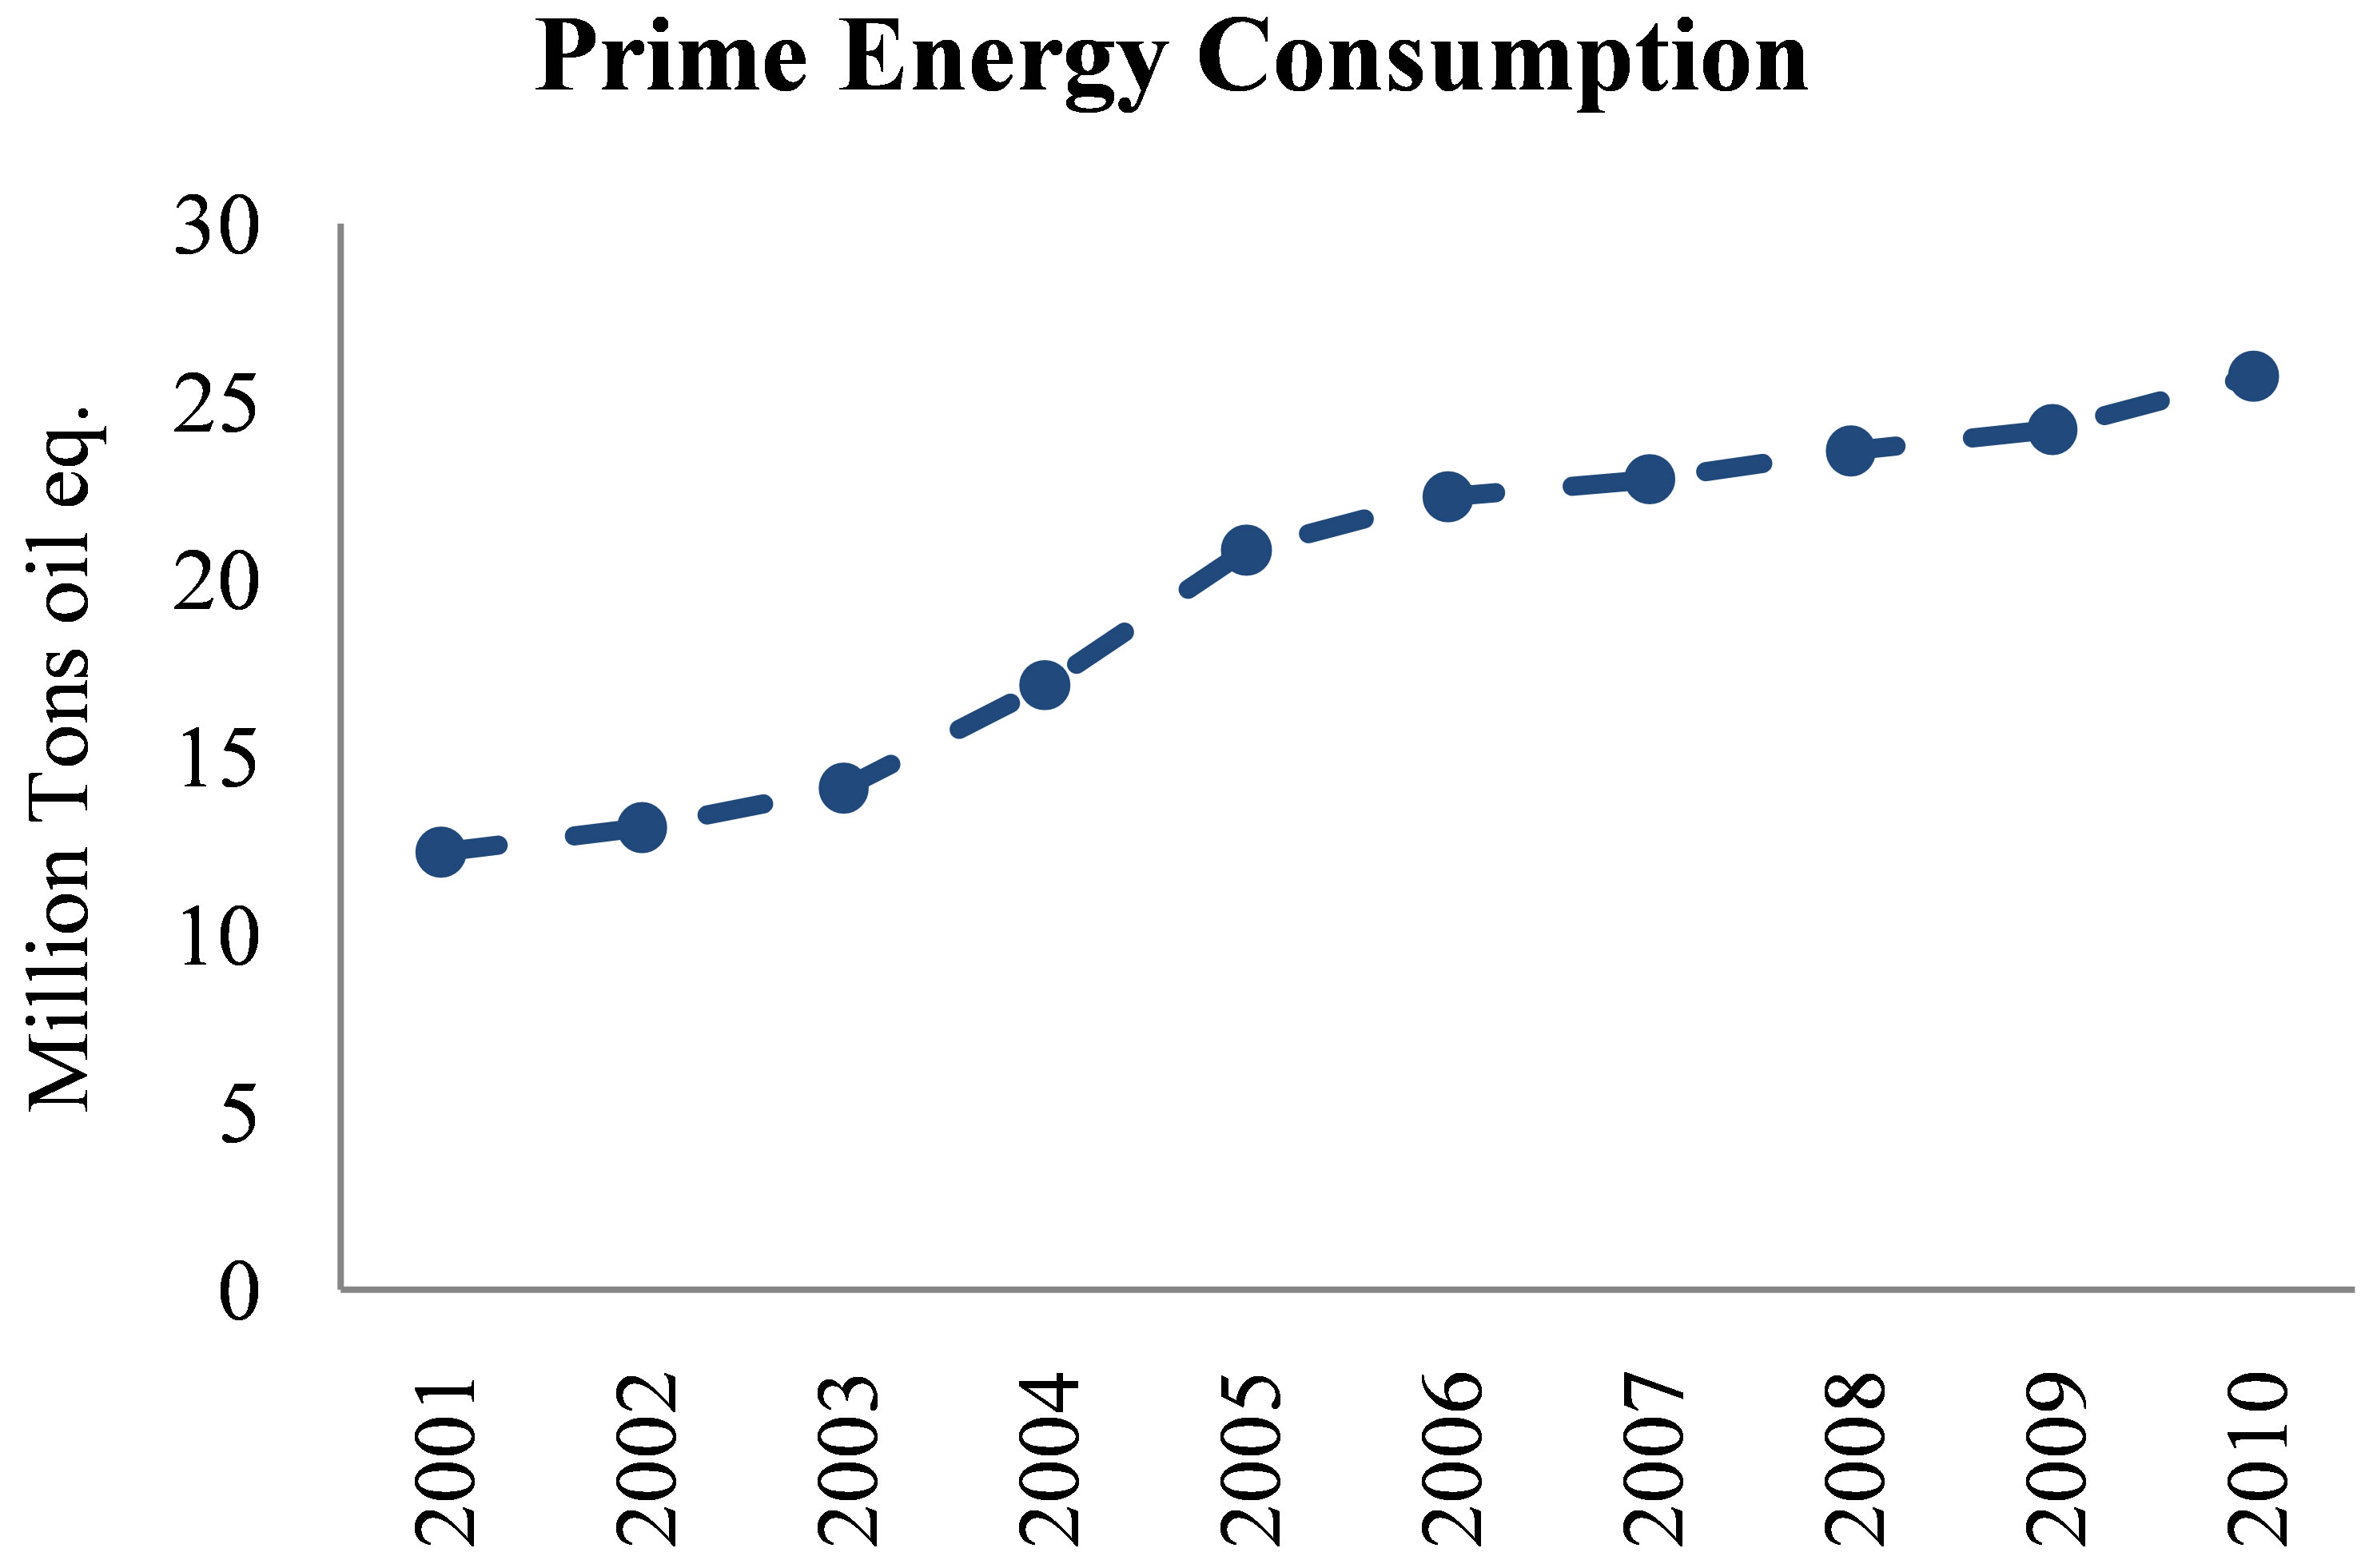
Figure 3. Primary energy consumption in Qatar from 2001- 2010 in M tons oil equivalent (Mtoe), [5].
The EP power consumption in Qatar in kWh is given in Figure 6.
The installed capacity of the EP power plants increased from 1333 MW in 1995 to almost 9000 MW in 2011, as shown in Figure 7 and next table, and as reported by KAHRAMA, [8]:

Presently the EP has excess generating capacity (since September 2009) and supplying the surplus to Bahrain and Kuwait through GCC’s Electric Grid. Qatar’s power generating capacity has reached 8800 MW, up from 5300 MW in the first half of 2009. This is going to expand to 11,500 MW in late 2012 and expected to be 13,500 MW in 2013.
The peak EP load usually occurs in summer due to AC high EP consumption, and increased as given in the next table.

The required PP capacities are determined by the expected peak load; almost doubled in 6 years.
The EP generated was more than doubled from 2004 to 2010, Figure 8, and is given in the next table:


Figure 4. World prices of natural gas in US dollars per Million British Thermal Units (MBTU), [5].
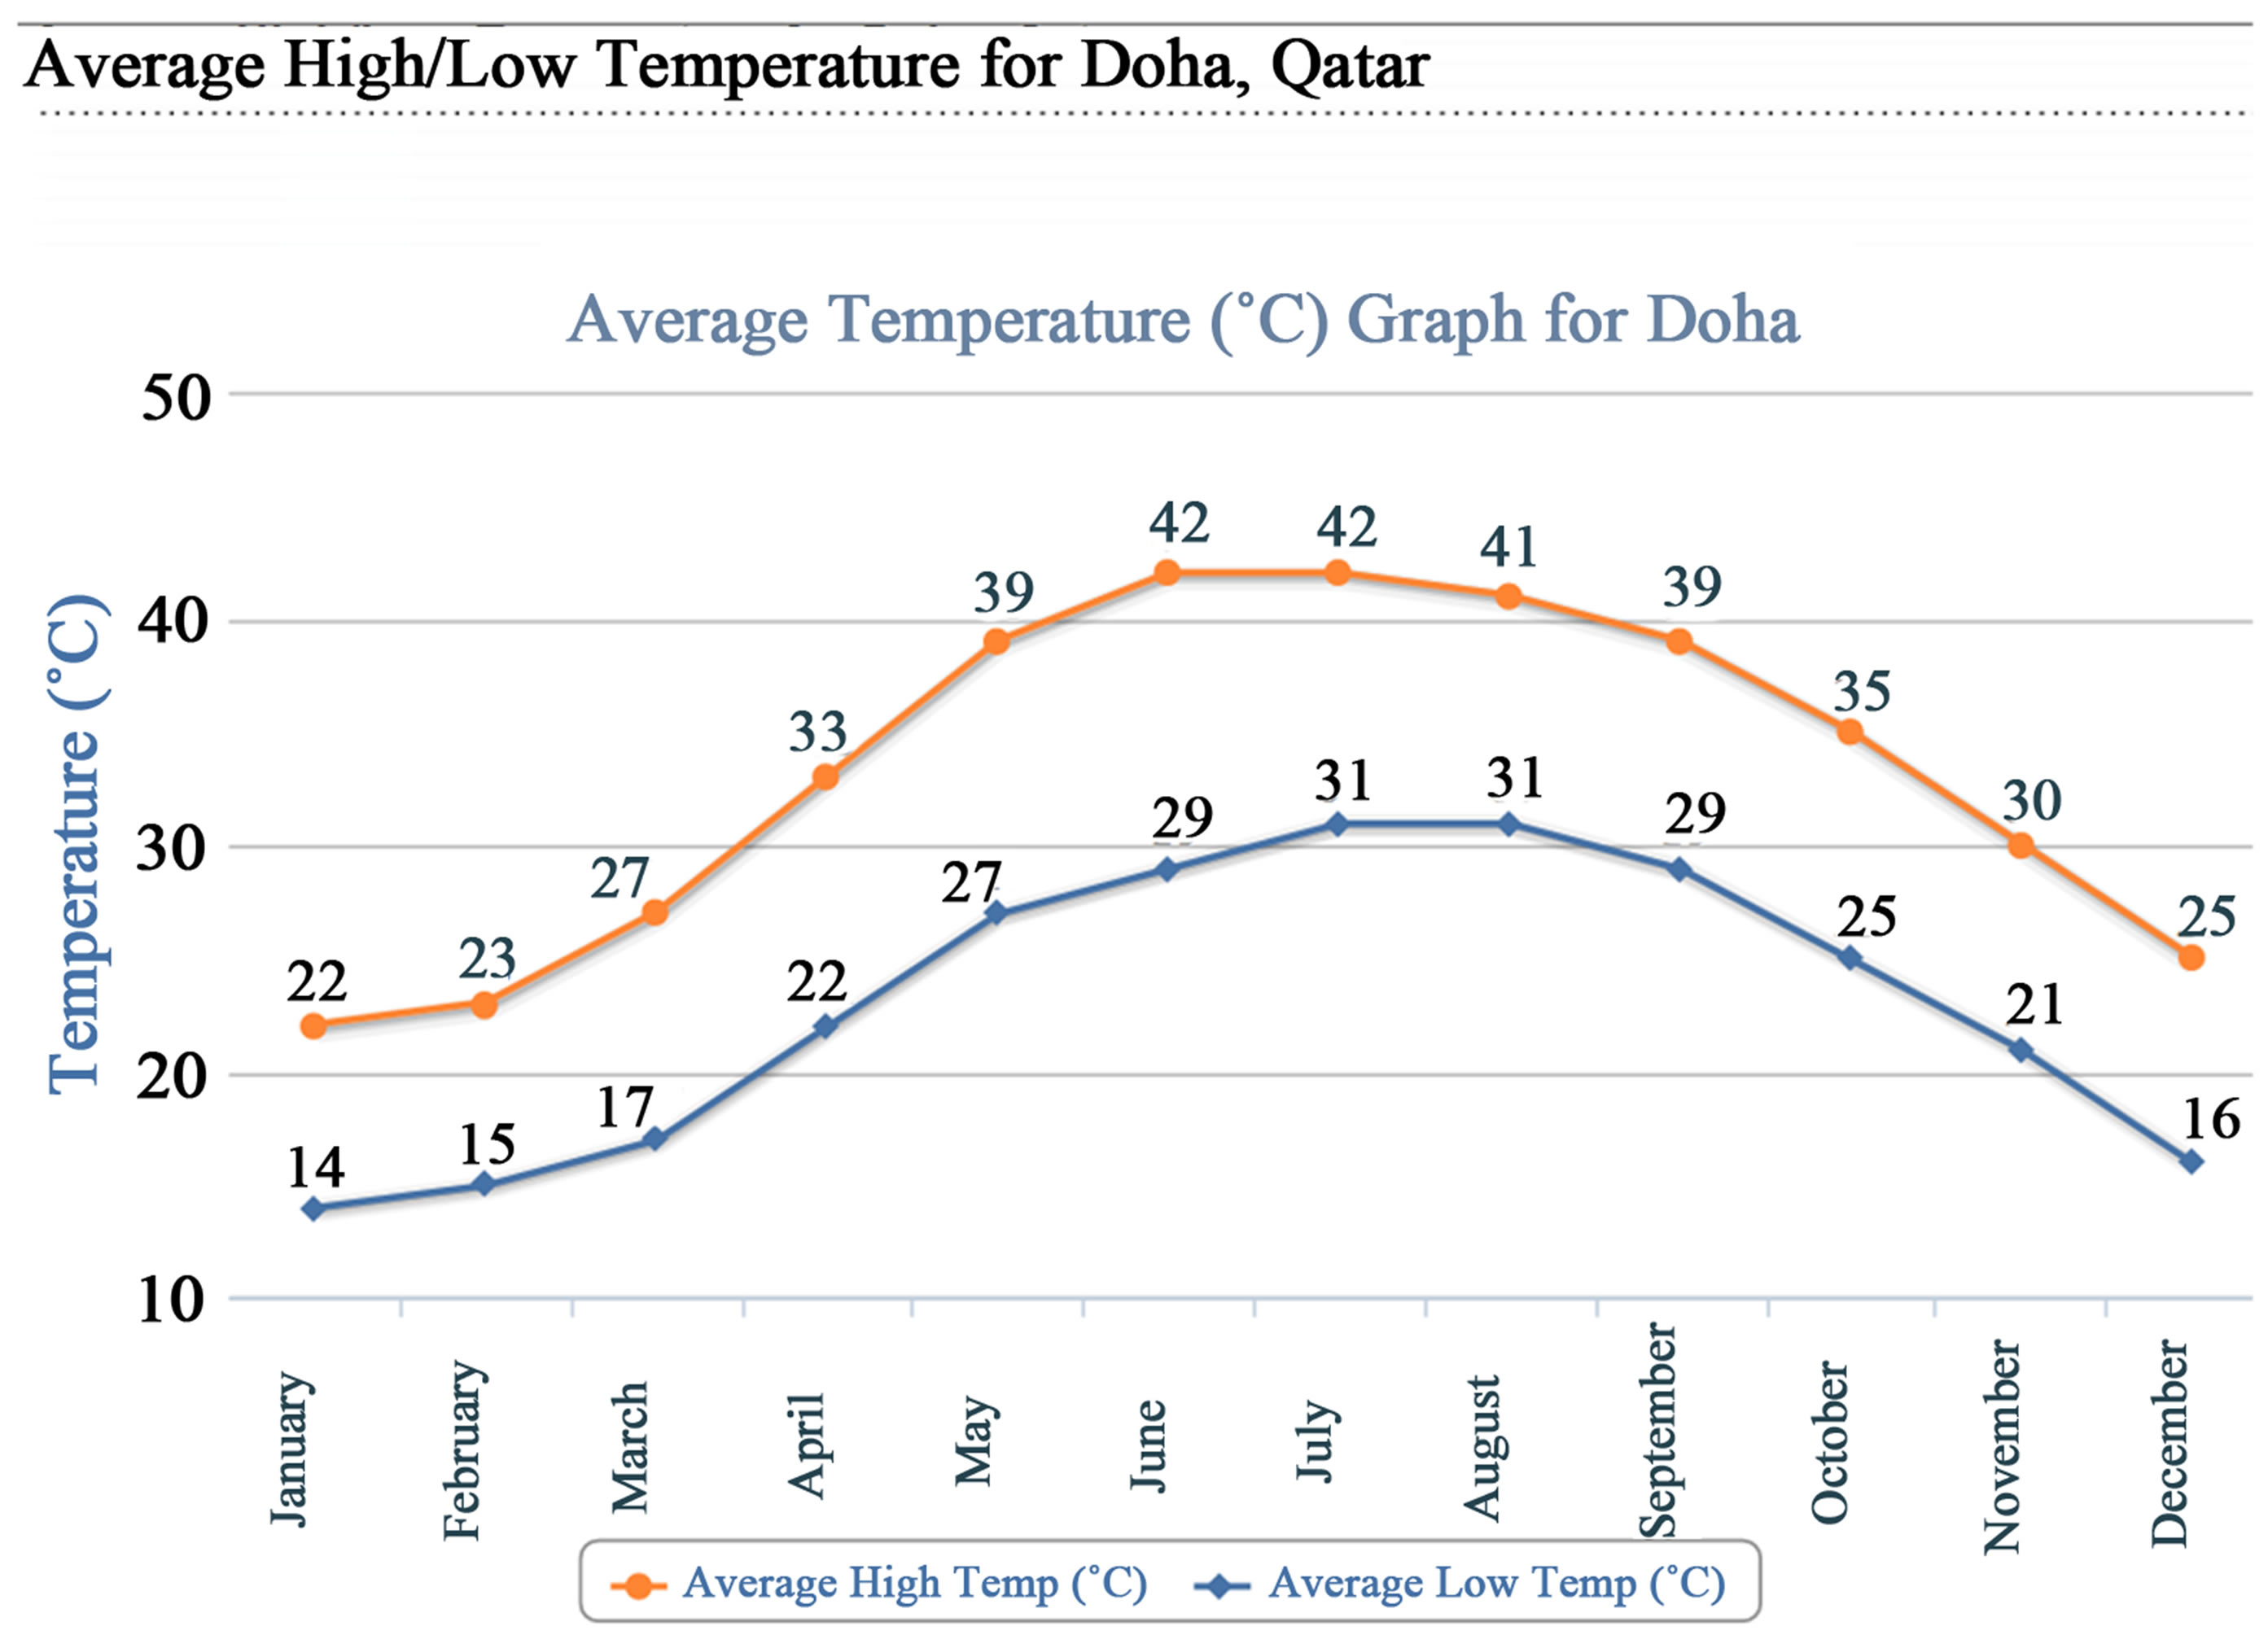
Figure 5. Average maximum and lowest temperatures in Doha, Qatar, [7].

Table 1. Fuel energy production and consumption in Qatar, [5].
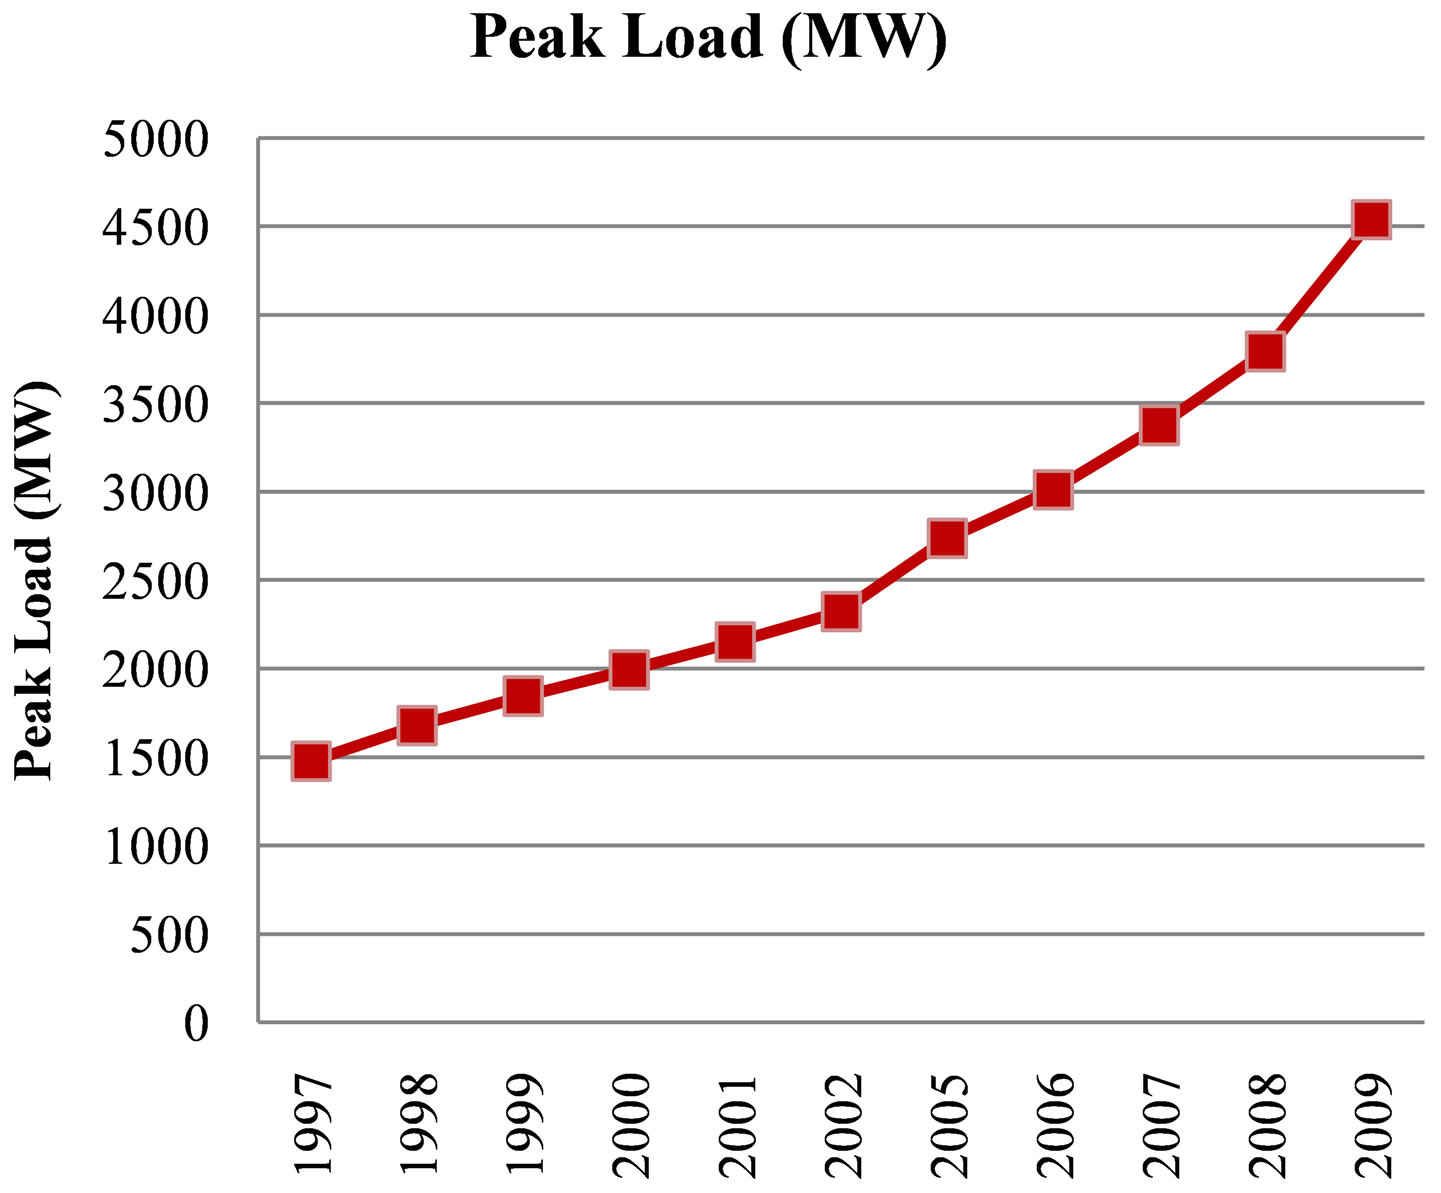
Figure 6. Peak EP load increased from 1997 to 2009, and 5090 MW in 2010, [9].
Figure 9 gives the increase in the EP consumption since 1980 to 2010.
In 2009, the EP consumption was shared as: 25% billed residential buildings, 19% unbilled or non-revenue electricity (Qatari residential and unaccounted losses), 12% government and street lighting, 15% commercial
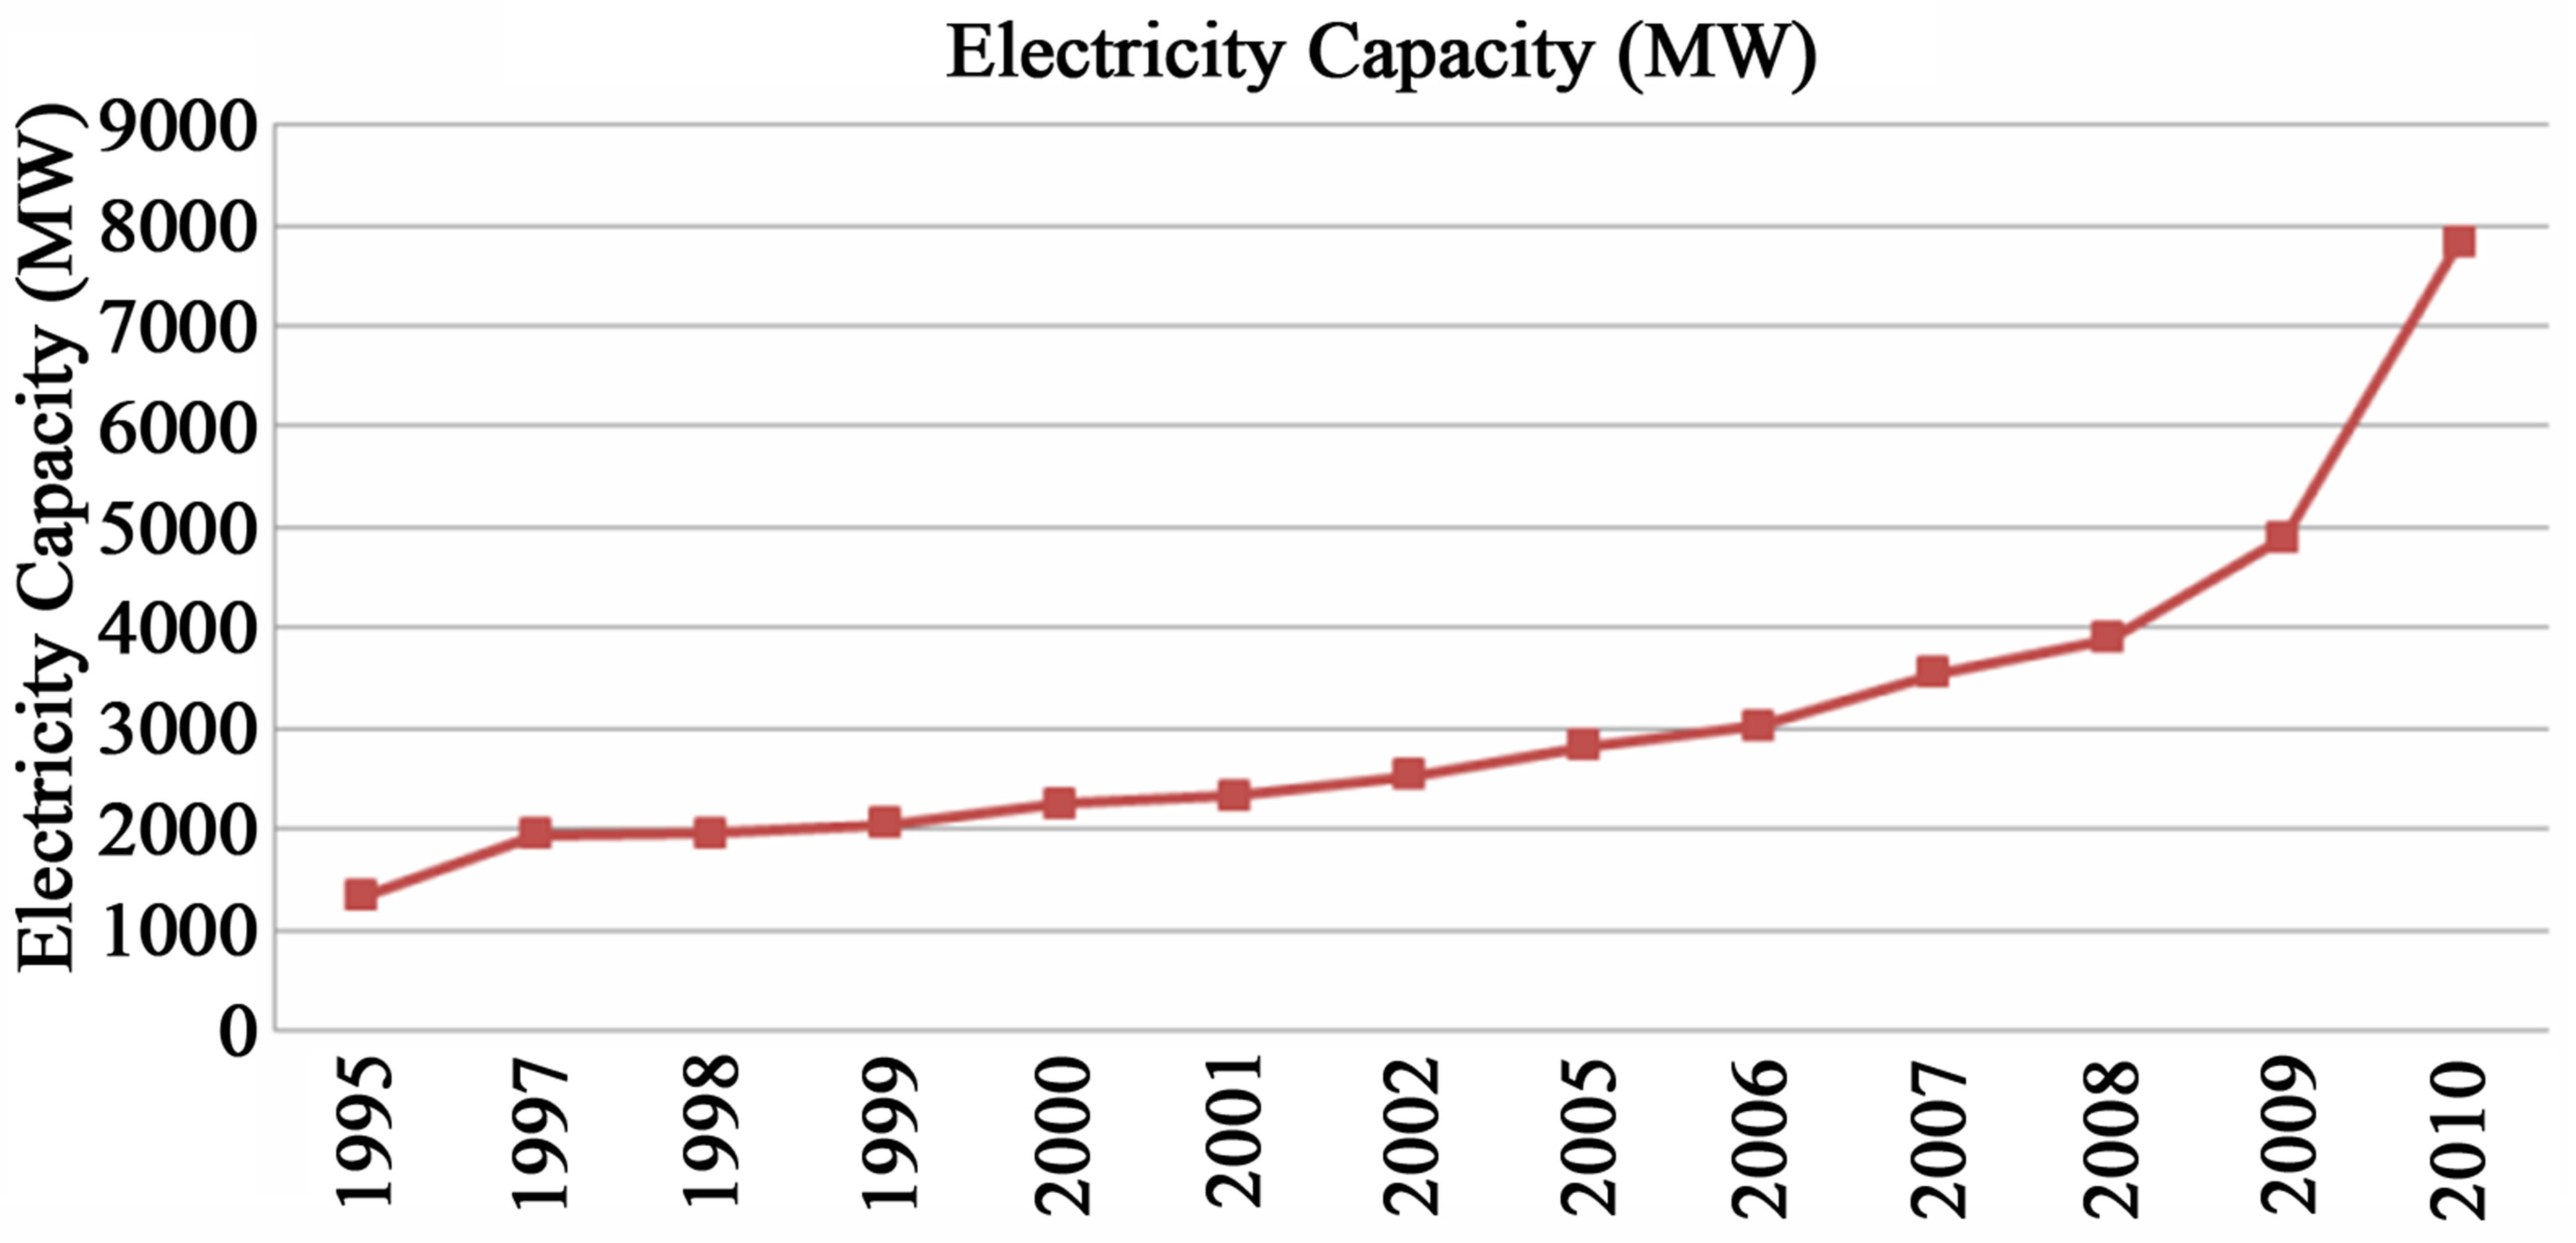
Figure 7. Qatar’s EP installed capacity in the last 10 years, [9].
sector (including light industries), 29% industrial sector (including large industries which do not generate its own EP need such as the iron industries), and 9.9% other sectors, see Figure 10, [10].
The power sector and water desalination plants depend on natural gas. Their combined gas consumption is estimated by 550 MCF/day (15.58 MCM/d). According to QP, this would reach more than 850 MCF/d (27.08 MCM/d) in 2015. Normally, electricity demand has been
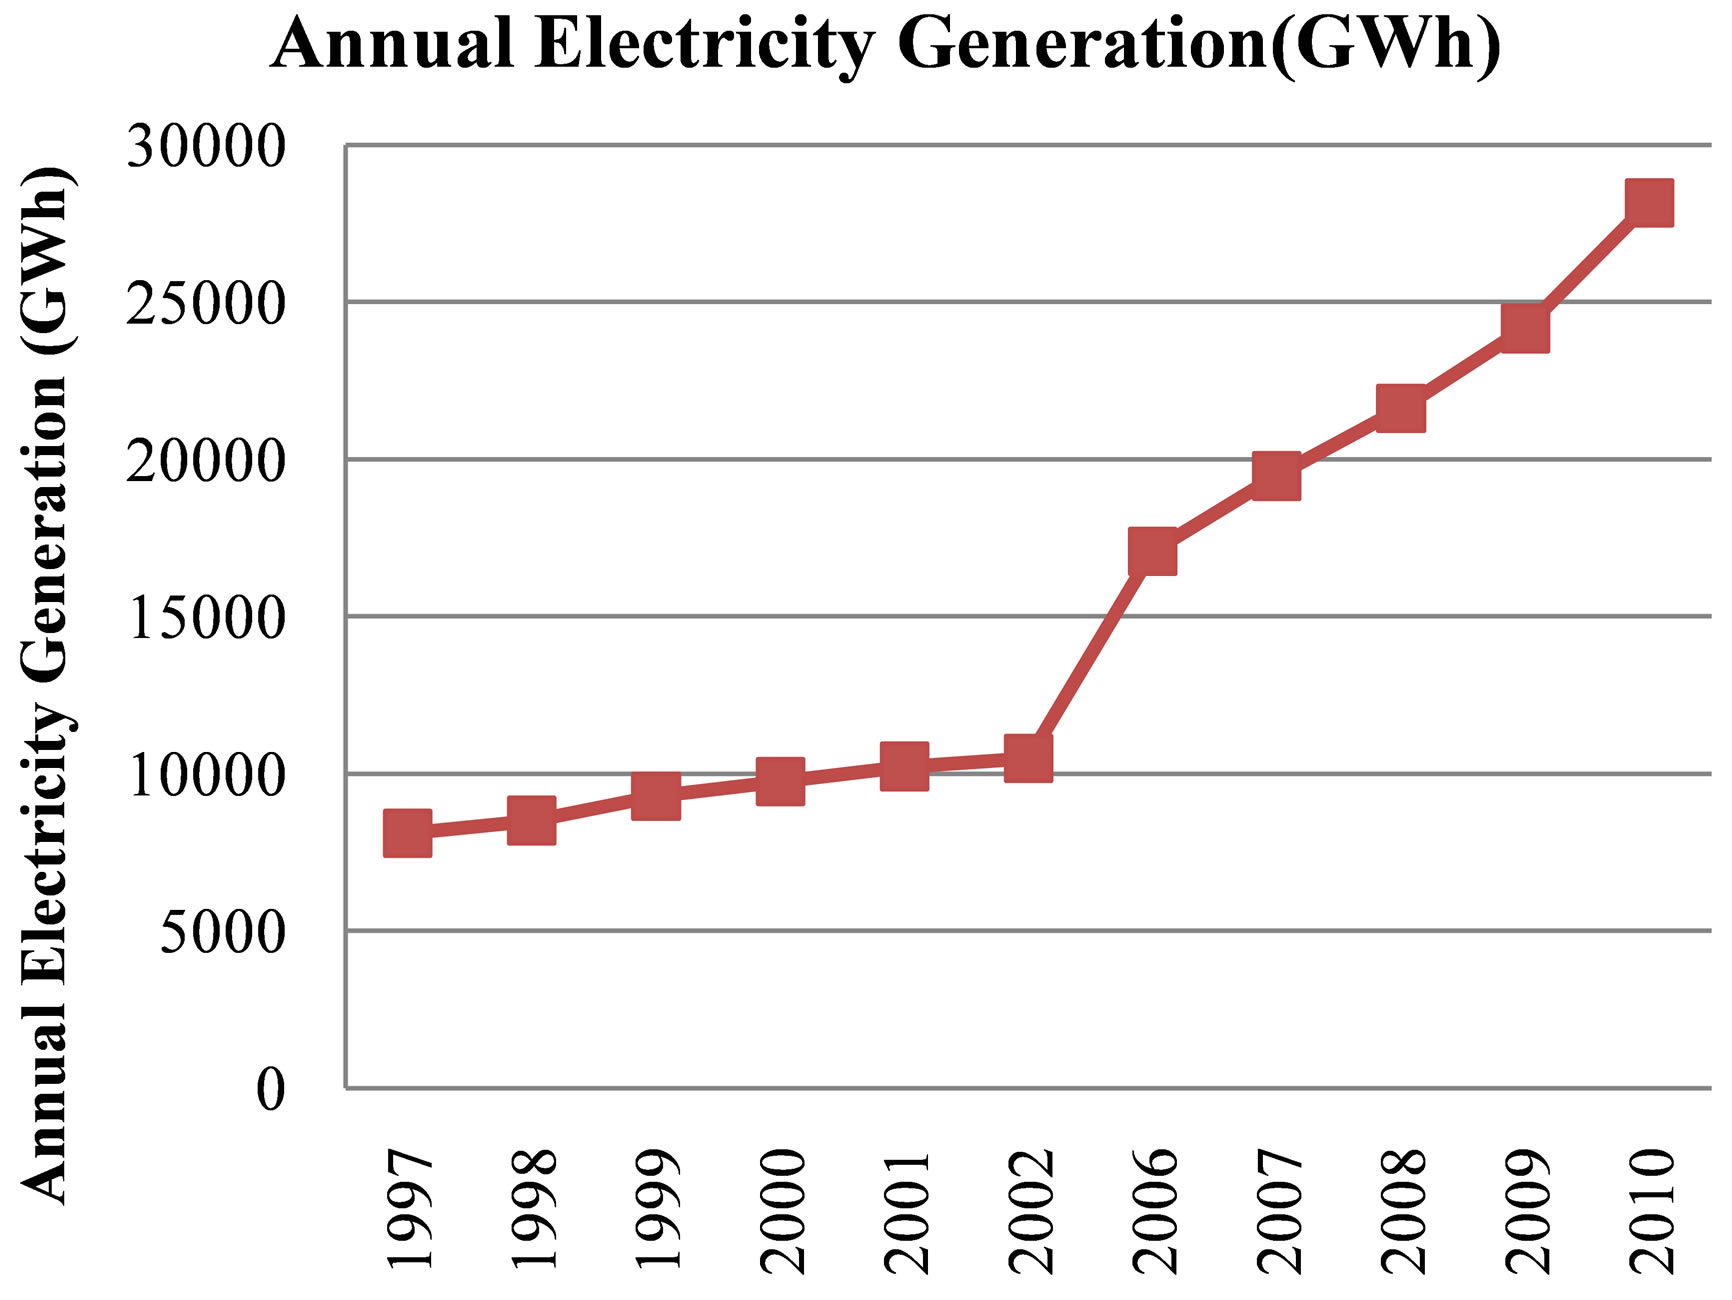
Figure 8. The EP generated in the last 30 years, [data from 9].
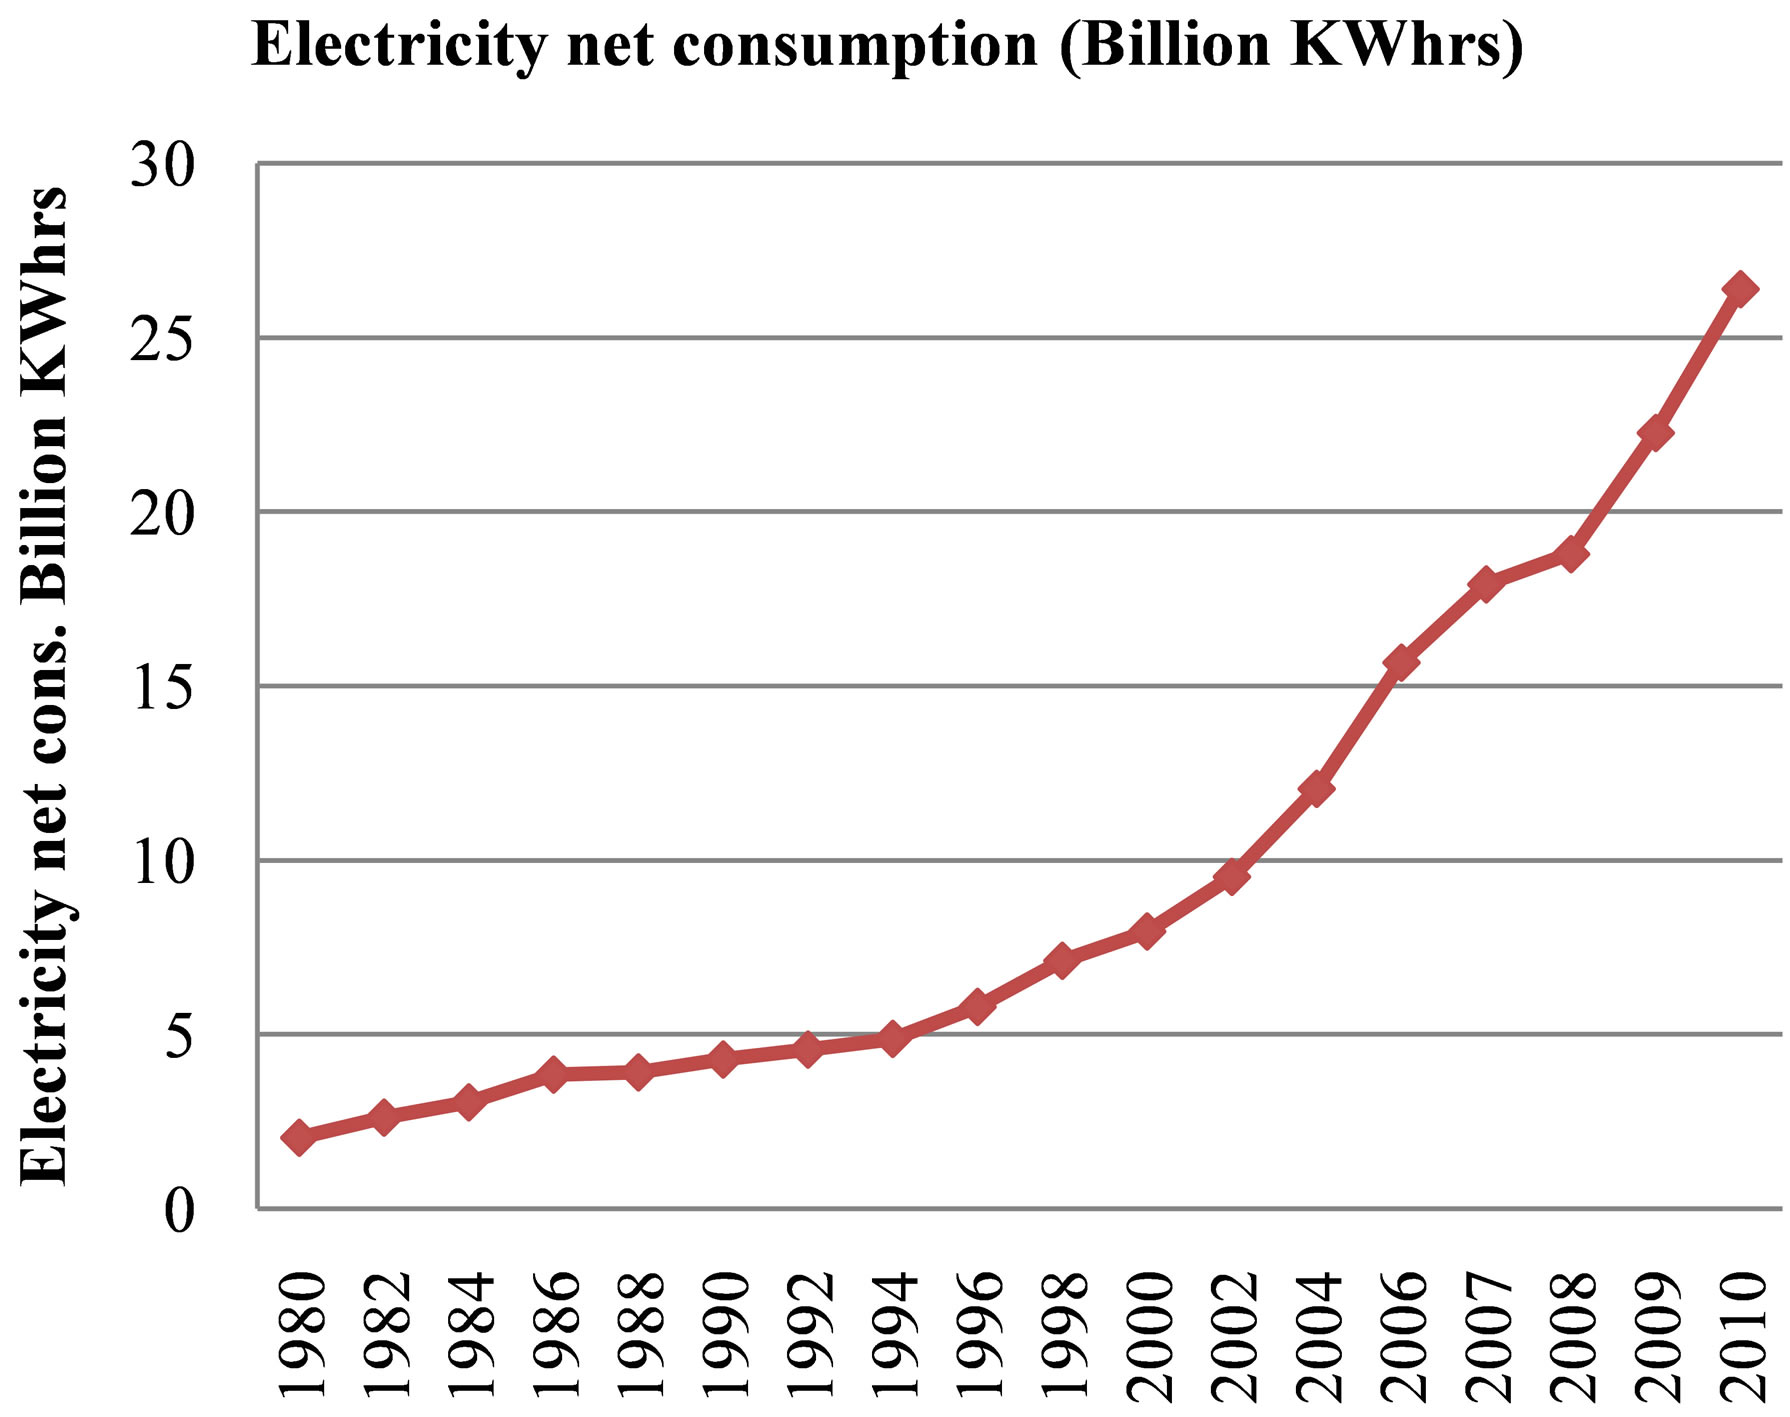
Figure 9. The EP consumption in the last 30 years, [data from Ref. 9].
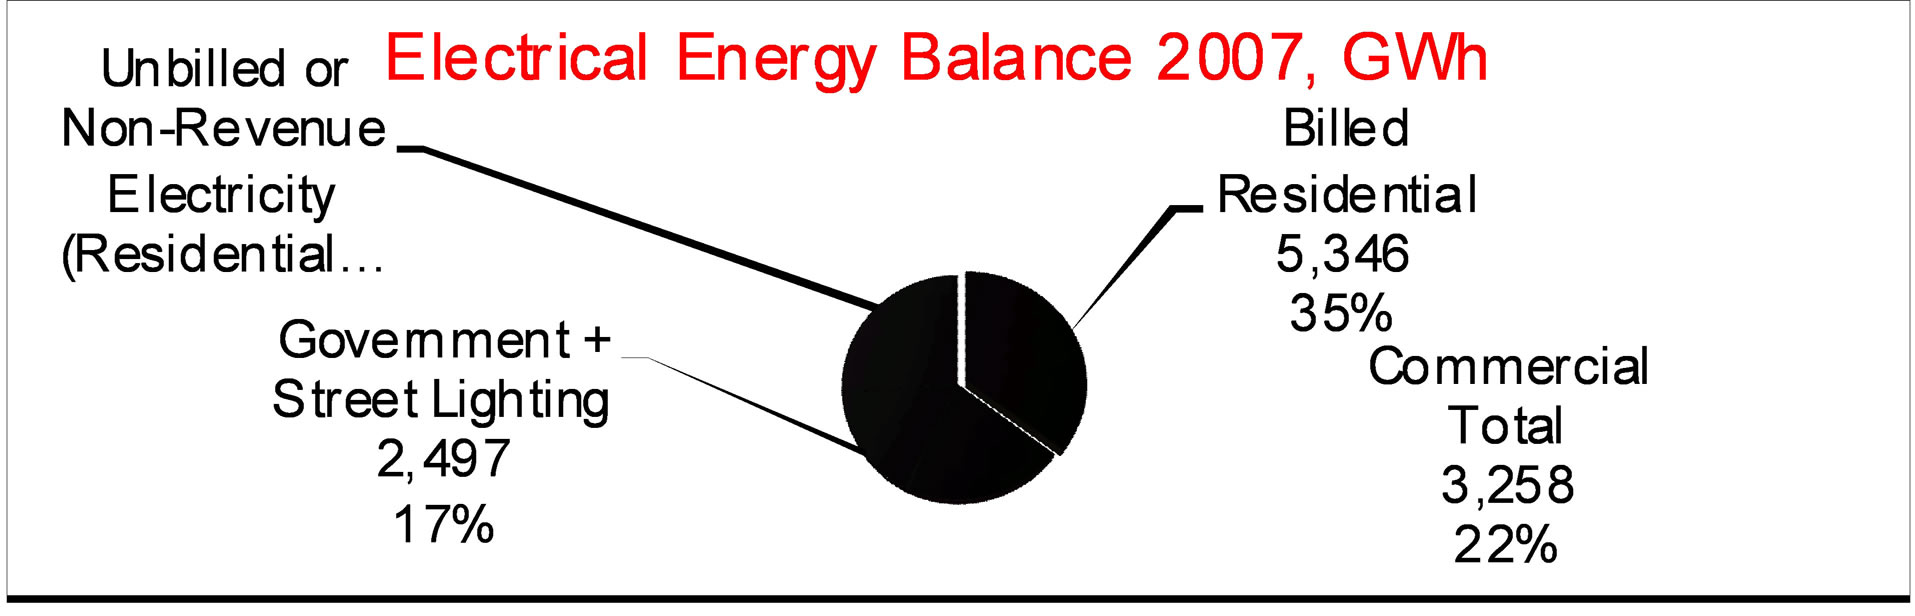
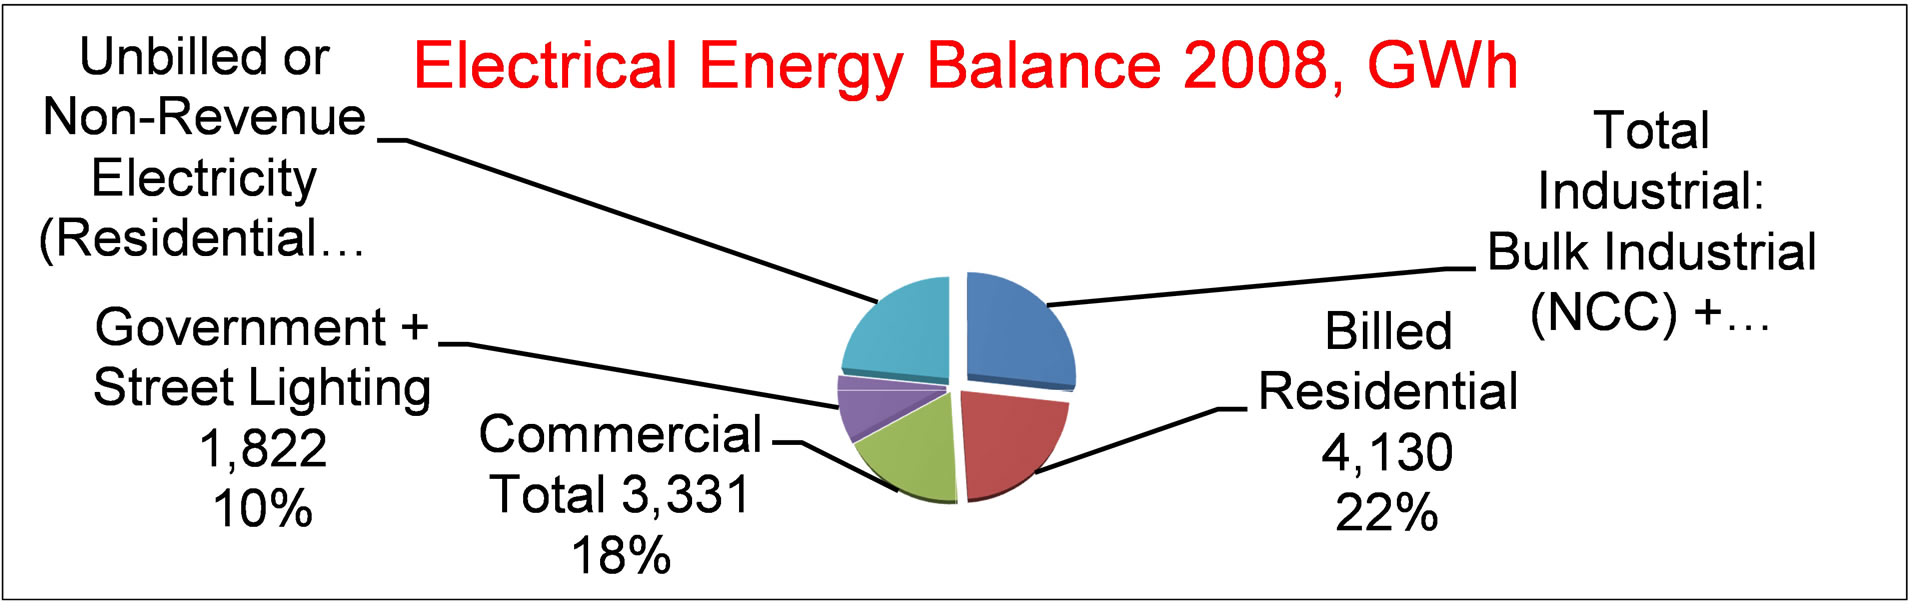
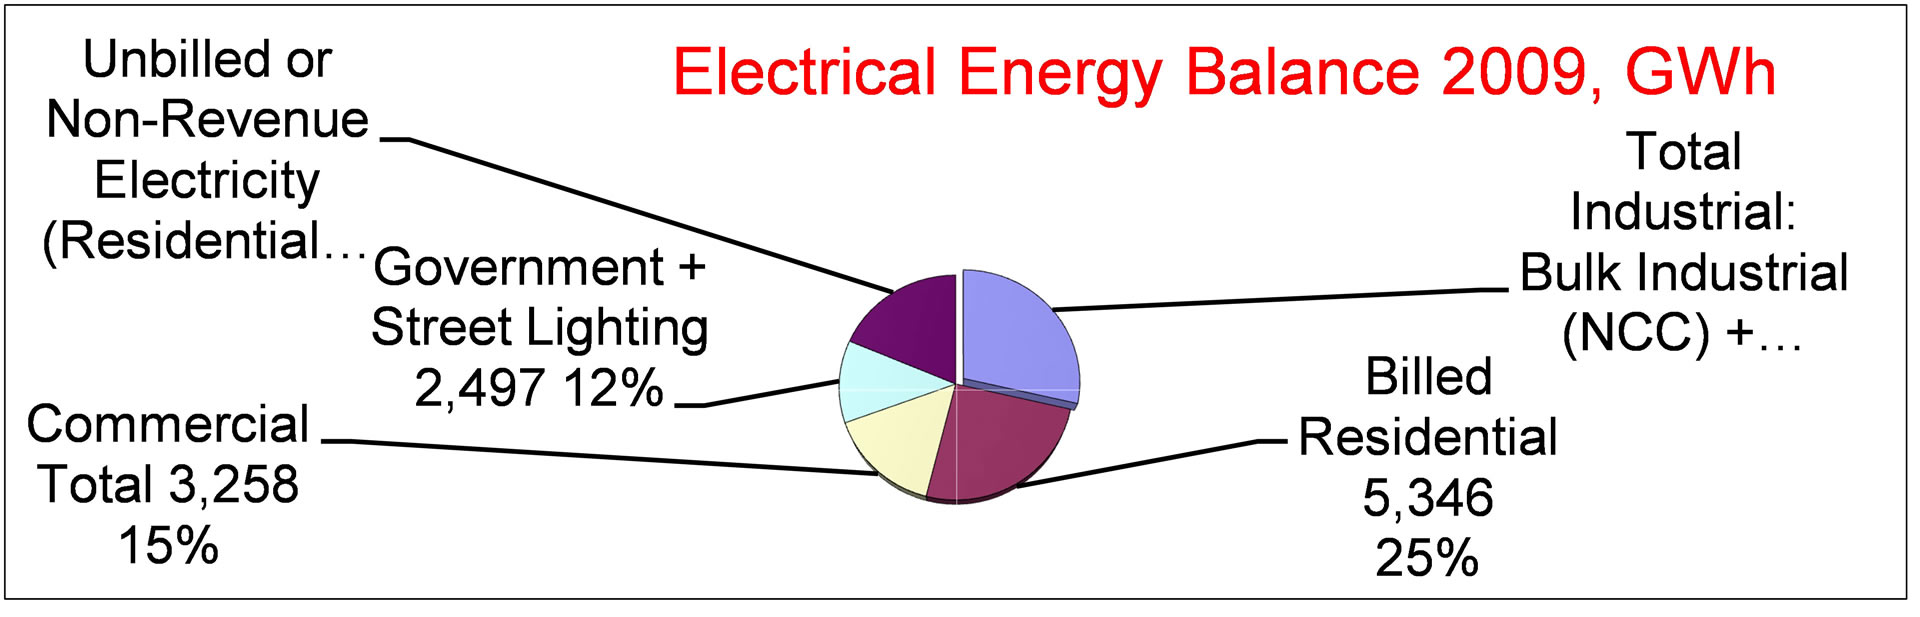
Figure 10. Electrical energy consumptions in different sectors, [10].
growing by about 7% per year , but since 2006 this has risen by 17% a year. The NG daily consumption in the power sector of 15.58 MCM/d (5.7 BCM/y) in 2010 represent 28% of the total consumed NG (20.4 BCM/y) in that year, [11].
Qatari citizens, who account for 26% of consumers and 42% of consumption, continue to receive water and power free of charge, one main reason why demand for water and power has been rising rapidly, [11].
The 4893 MW capacity in 2009 consists of 3230 MW simple Gas Turbine (GT), Figure 11, and 1650 MW GT Combined Cycle (CC) Power Plants (PP), Figure 12.
In 2010, the EP was produced in 6 main power plants (PP) of 7830 MW total capacity operated by NG. Some of these PP’s belong to:
1. The state owned utility, Qatar General Electricity and Water Corporation (KAHRAMA), including Ras Abu Fontas (RAF) A, B, B1, and, B2, Sailiya, and Doha Super South. Others belong to private companies such as.
2. Ras Laffan (RL) Power Company (RL A, B, and C),

Figure 11. Schematic diagram of simple gas turbine (GT) cycle.
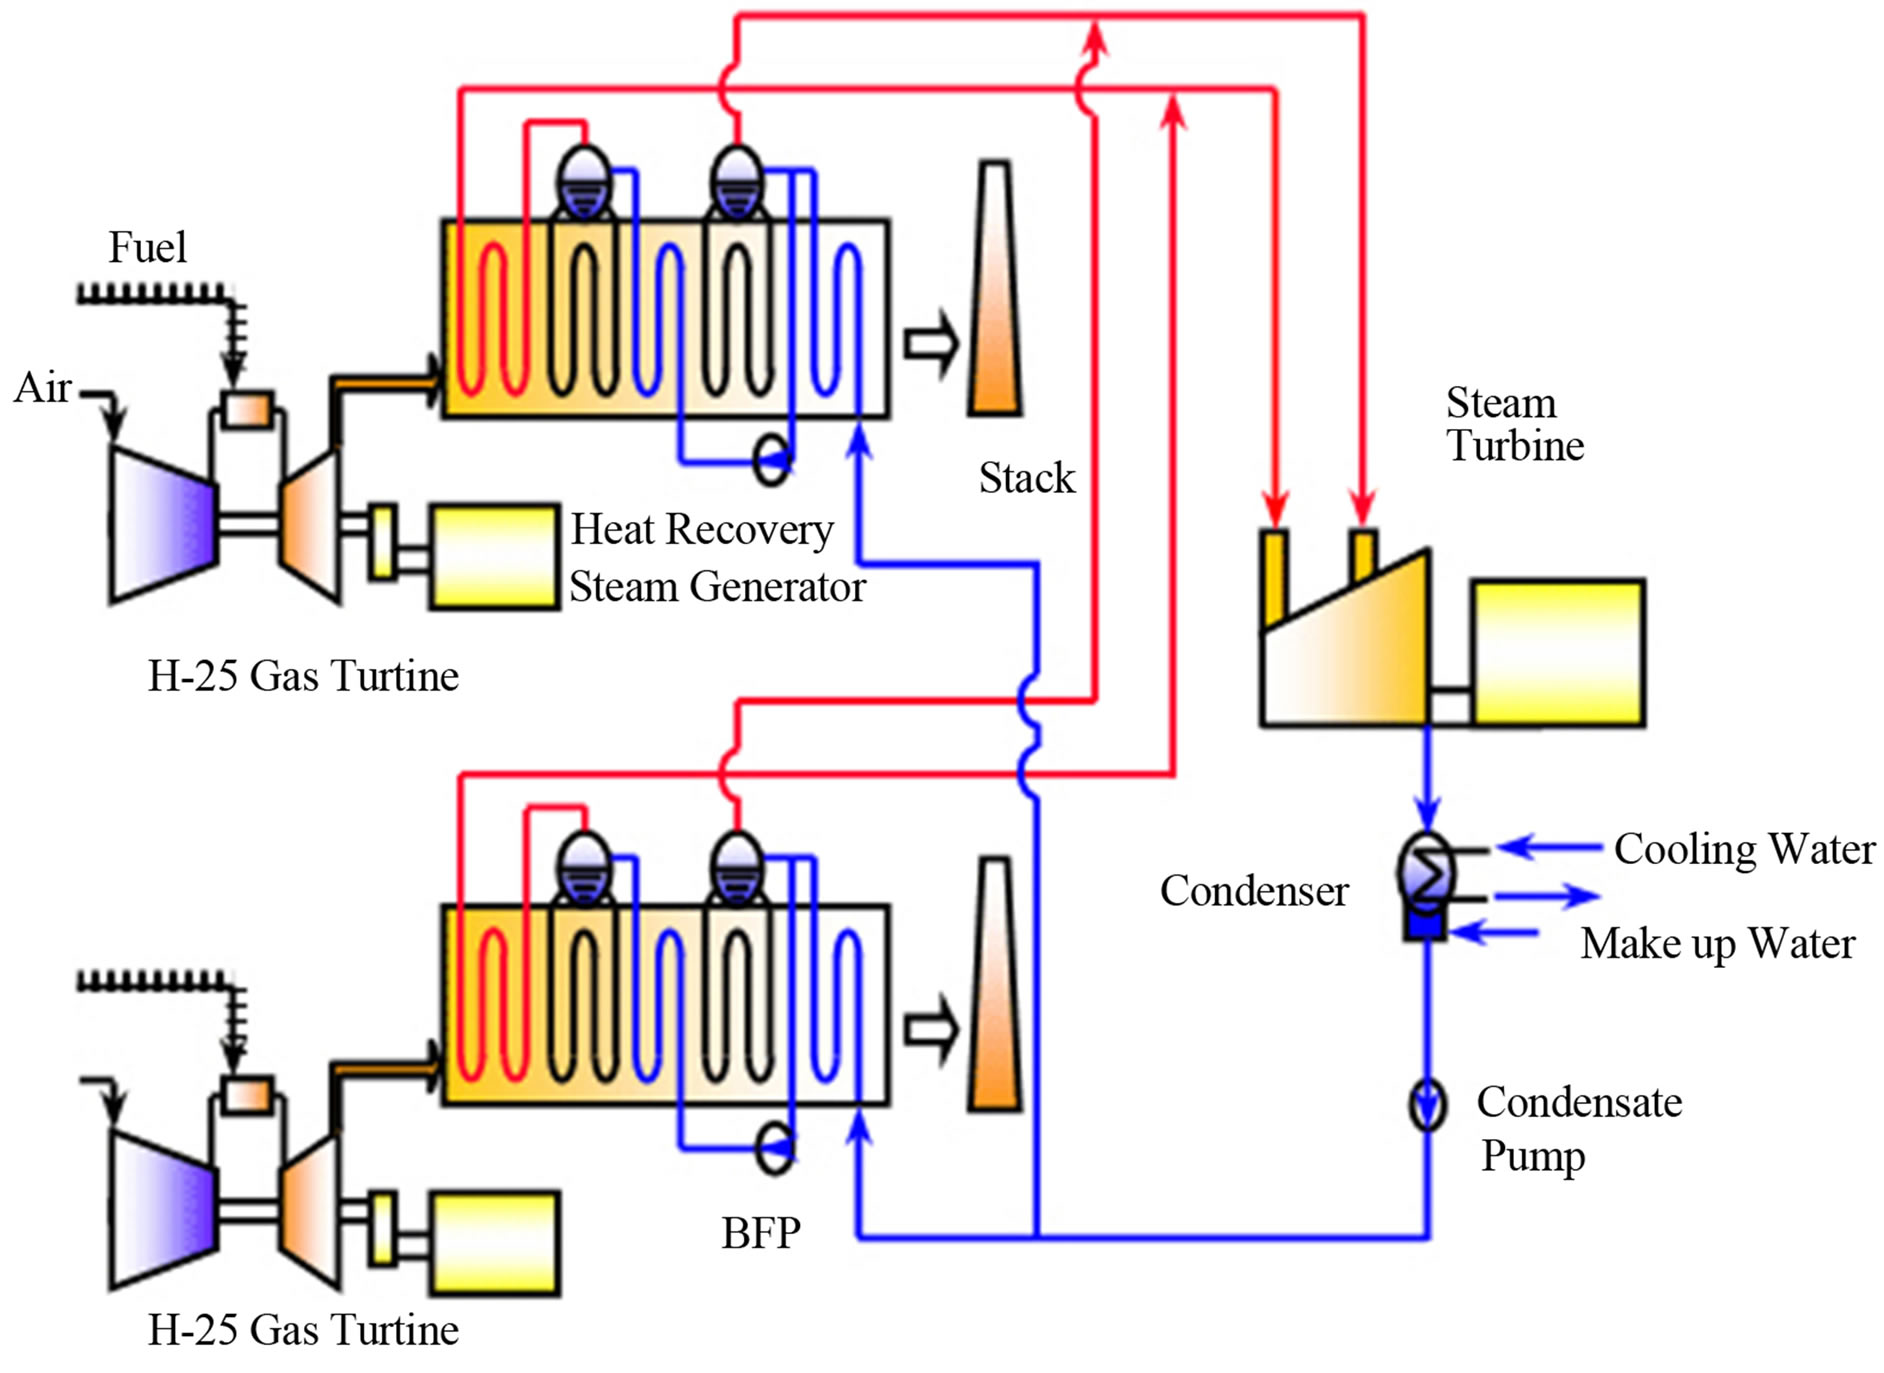
Figure 12. Combined gas turbine/steam turbine combined cycle (CC), [12].
and 3. Mesaieed Power Company.
Table 2 shows the EP shares of these companies, as 2009, [8].
3.2. Desalted Seawater Plant in Qatar
All large thermally operated Desalting Plants (DP) are combined with PP to satisfy the thermal energy needs of the DP. Desalting seawater is an energy intensive process. The Multi Stage Flash (MSF), Figure 13, is most predominantly used desalting seawater system in Qatar and all GCC. Thermal Vapor Compression-Multi Effect (TVCME), Figure 14, is another thermally operated distillation system recently introduced in the GCC. In Qatar, 80.6% of desalting capacity is by MSF system, and the balance (19.4%) is by TVC-ME system, [13]; while in Kuwait, all DP capacity is by MSF. Both consumes about 260-MJ thermal energy per each one m3 distillate product, the pumping energy for the MSF and TVC-MED are about 4 kWh/m3, and 2 kWh/m3 respectively to move their streams. However the TVC-ME use higher pressure steam (of higher value) than that used for the MSF system. The thermal energy is supplied in the form steam at moderate pressure, say of 2 to 3 bar for the MSF and about 10 bar for the TVC system.
Steam supply to the MSF (or TVC-ME) units comes either from heat recovery steam generator (HRSG) utilizing the waste heat rejected from GT; Figure 15; or steam extracted (or discharged) from the Steam Turbine (ST) of the CC, Figure 16, [15]. Steam also can be supplied from Extraction-Condensing Steam Turbine (ECST), as shown in Figure 17 in most Kuwait CPDP plants. In these plants, two DP can be combined with one or two steam turbines, Figure 18.
Most of power plants in Qatar are CPDP. Example is the RasLaffan CPDP producing 3550 MW of EP, and 163 MIGD of DW. The capacities of the five main desalting plants in Qatar are given in Table 3, [8]:
Ras Abu Aboud (RAA) had 11 MIGD, but was demolished in 2007.
3.3. CPDP in Qatar
The known PPs in Qatar are, [8,16-24]:
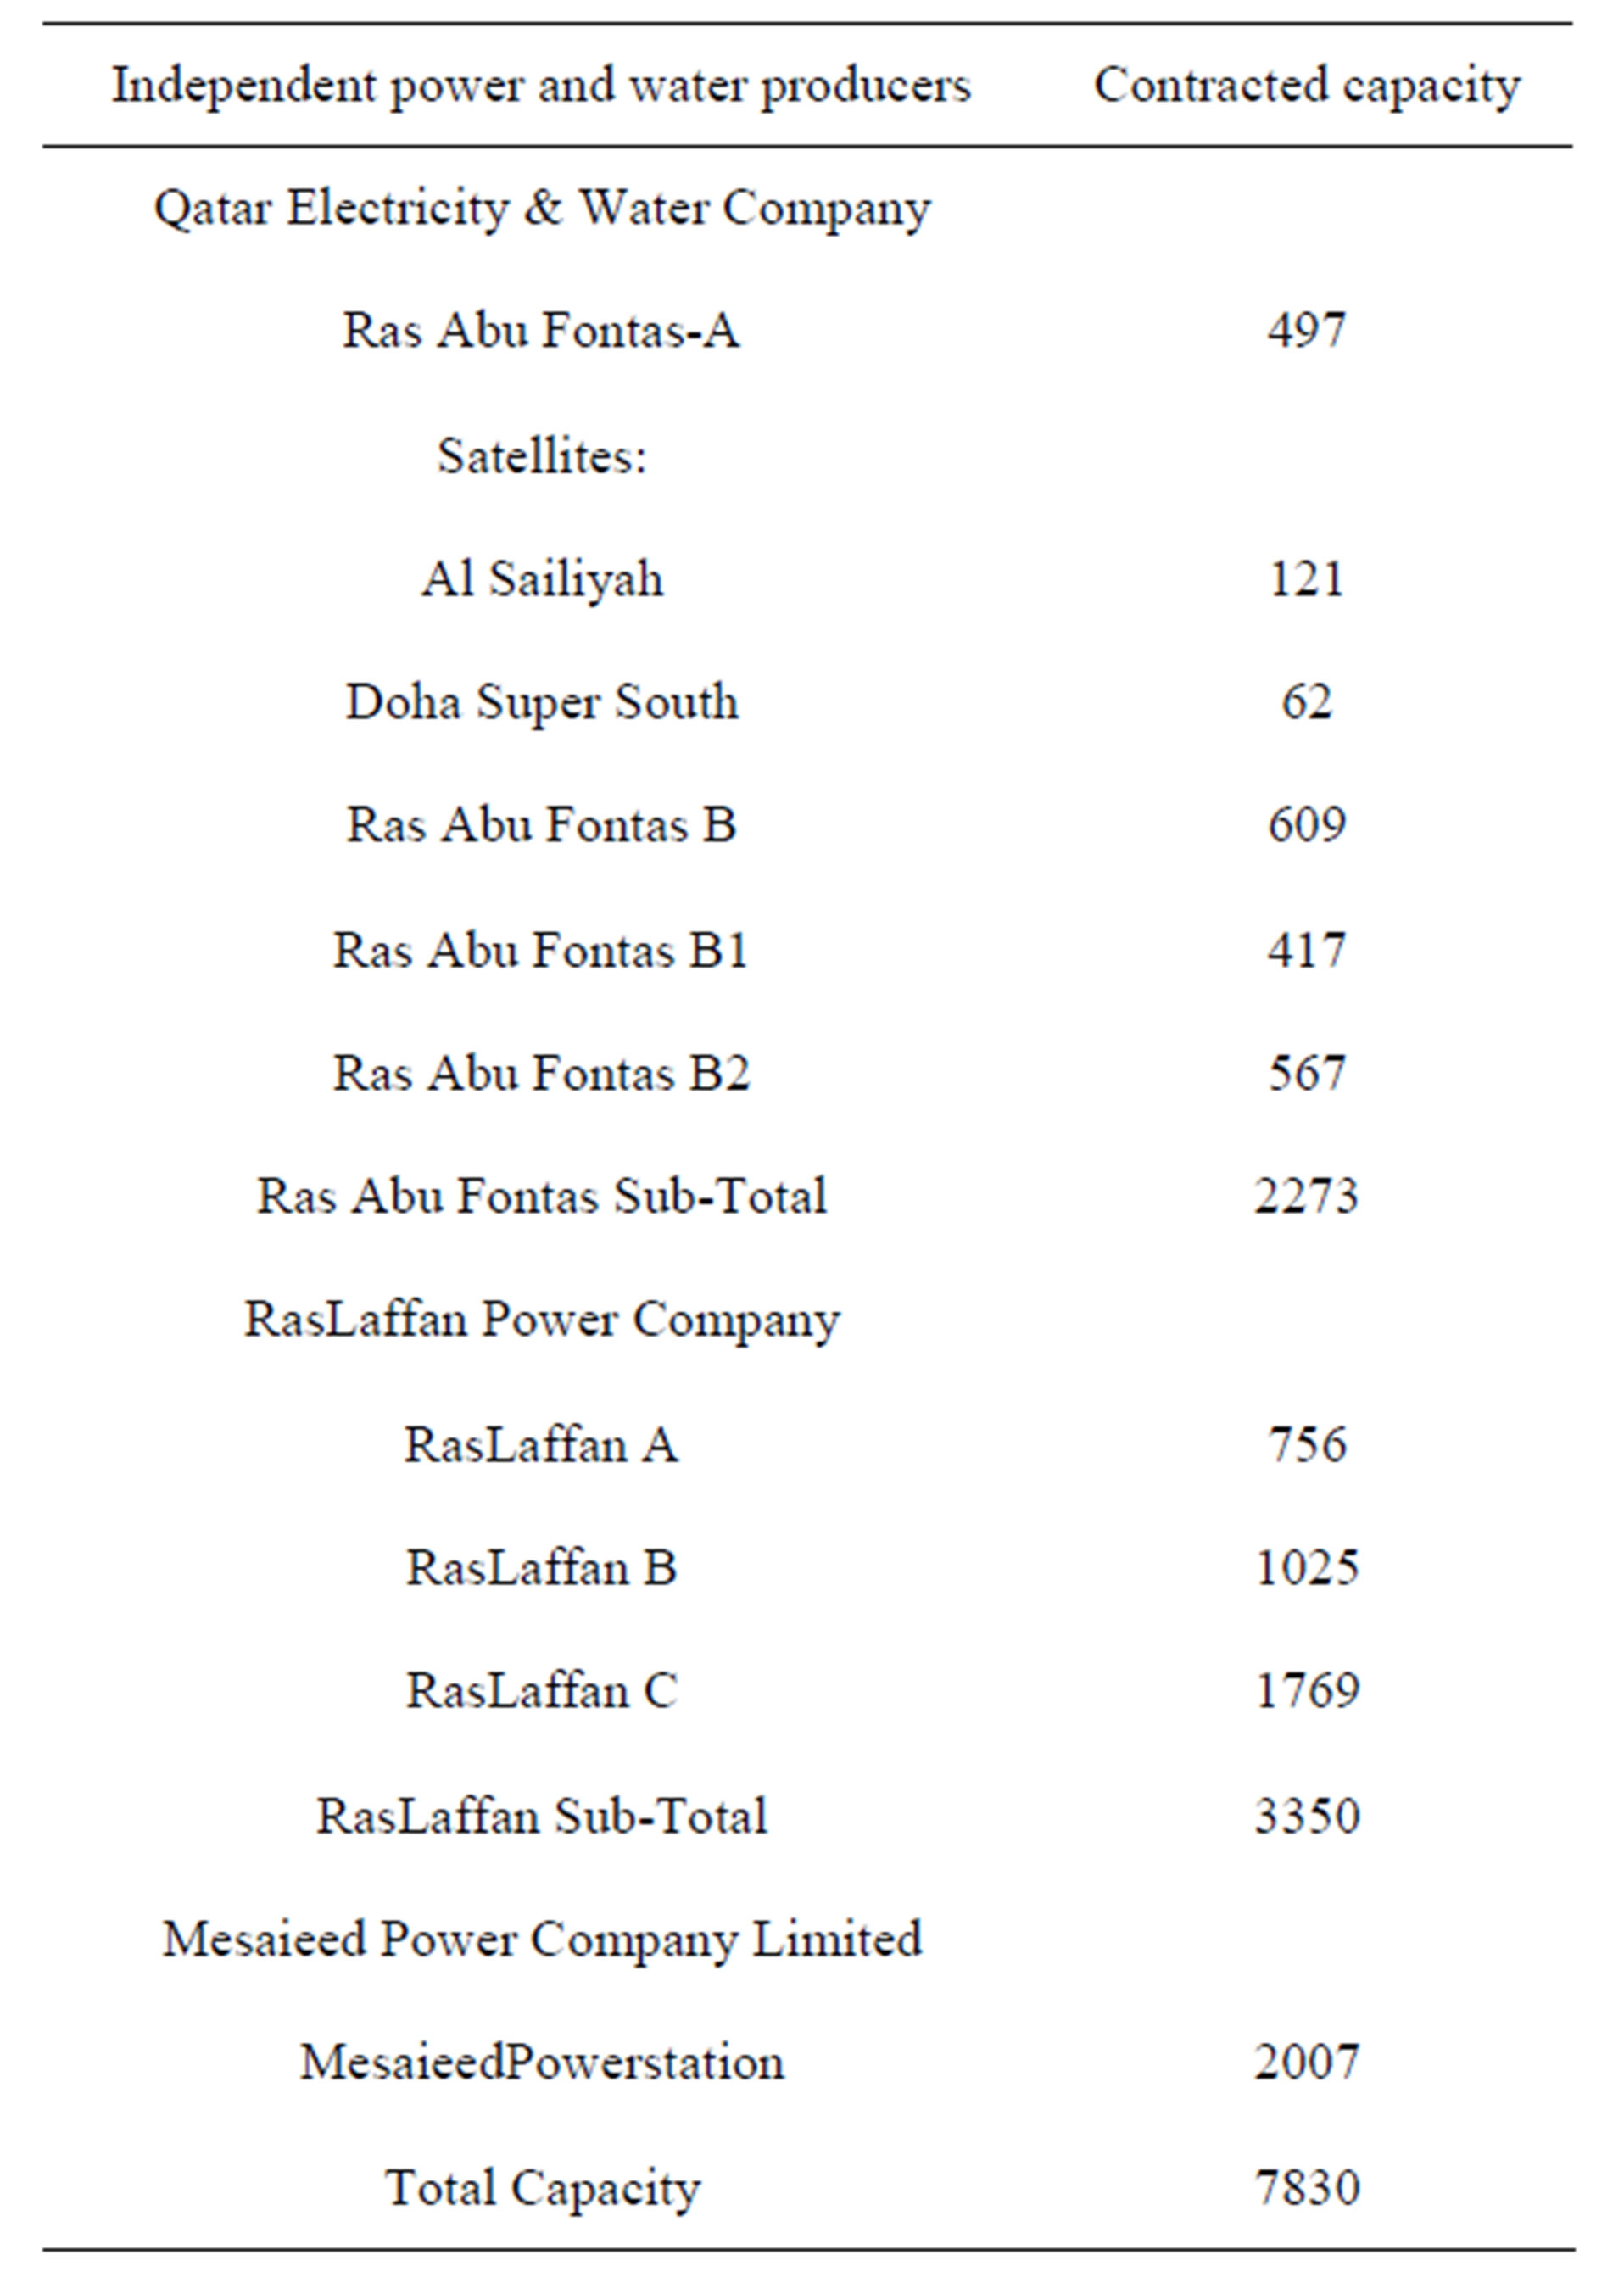
Table 2. Share of different Qatar power companies in the installed EP capacity, [8].

Figure 13. The multi stage flash desalination flowsheet.

Figure 14. Thermal vapor compression-multi effect distillation system (TVC-MED) flow of Al Taweela plant, [14].
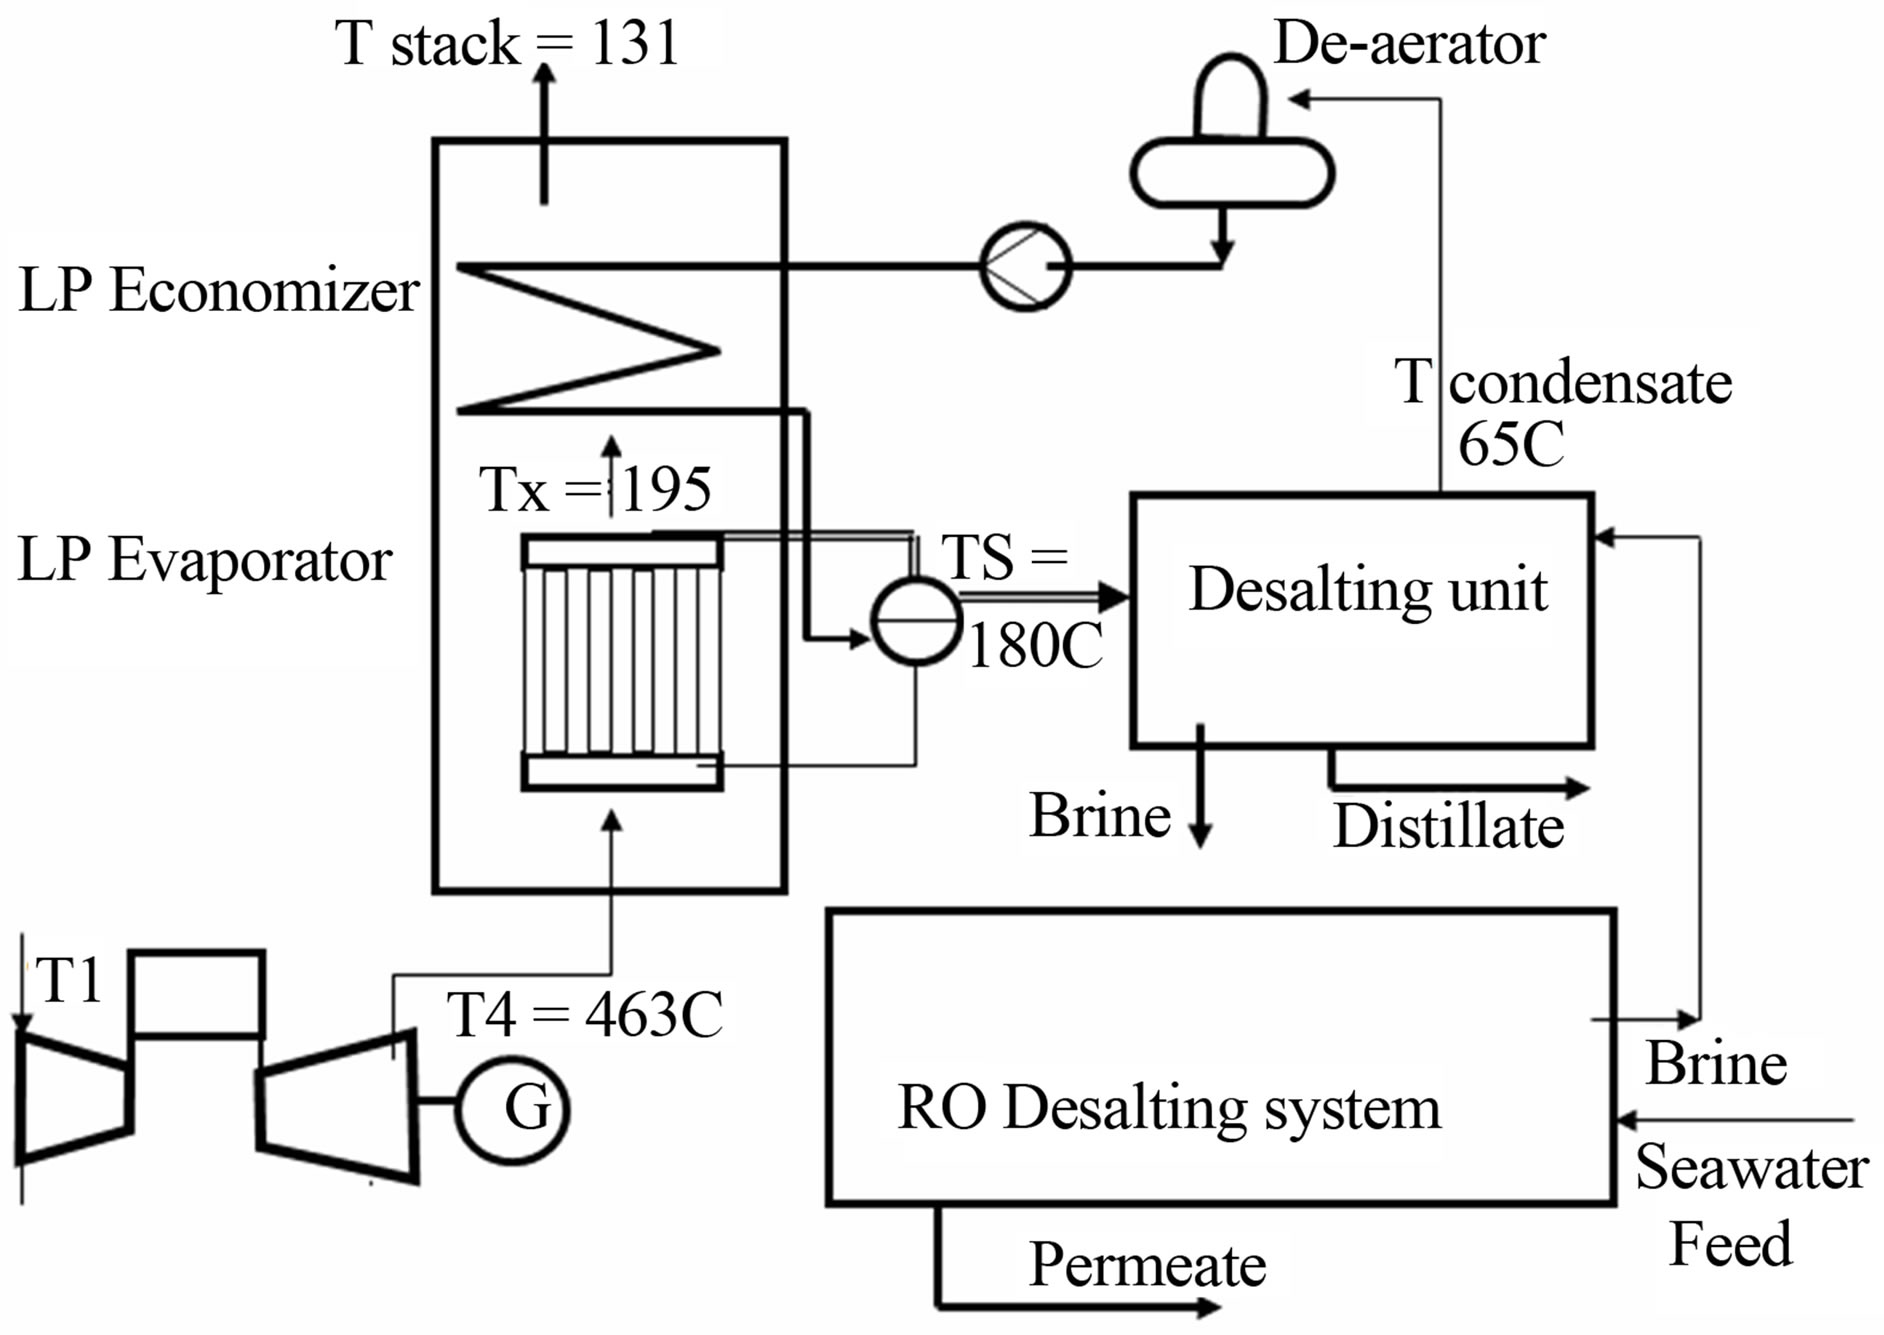
Figure 15. GT operating RO system with HRSG steam operating desalination plant.

Table 3. The capacities of the five main desalting plants in Qatar.
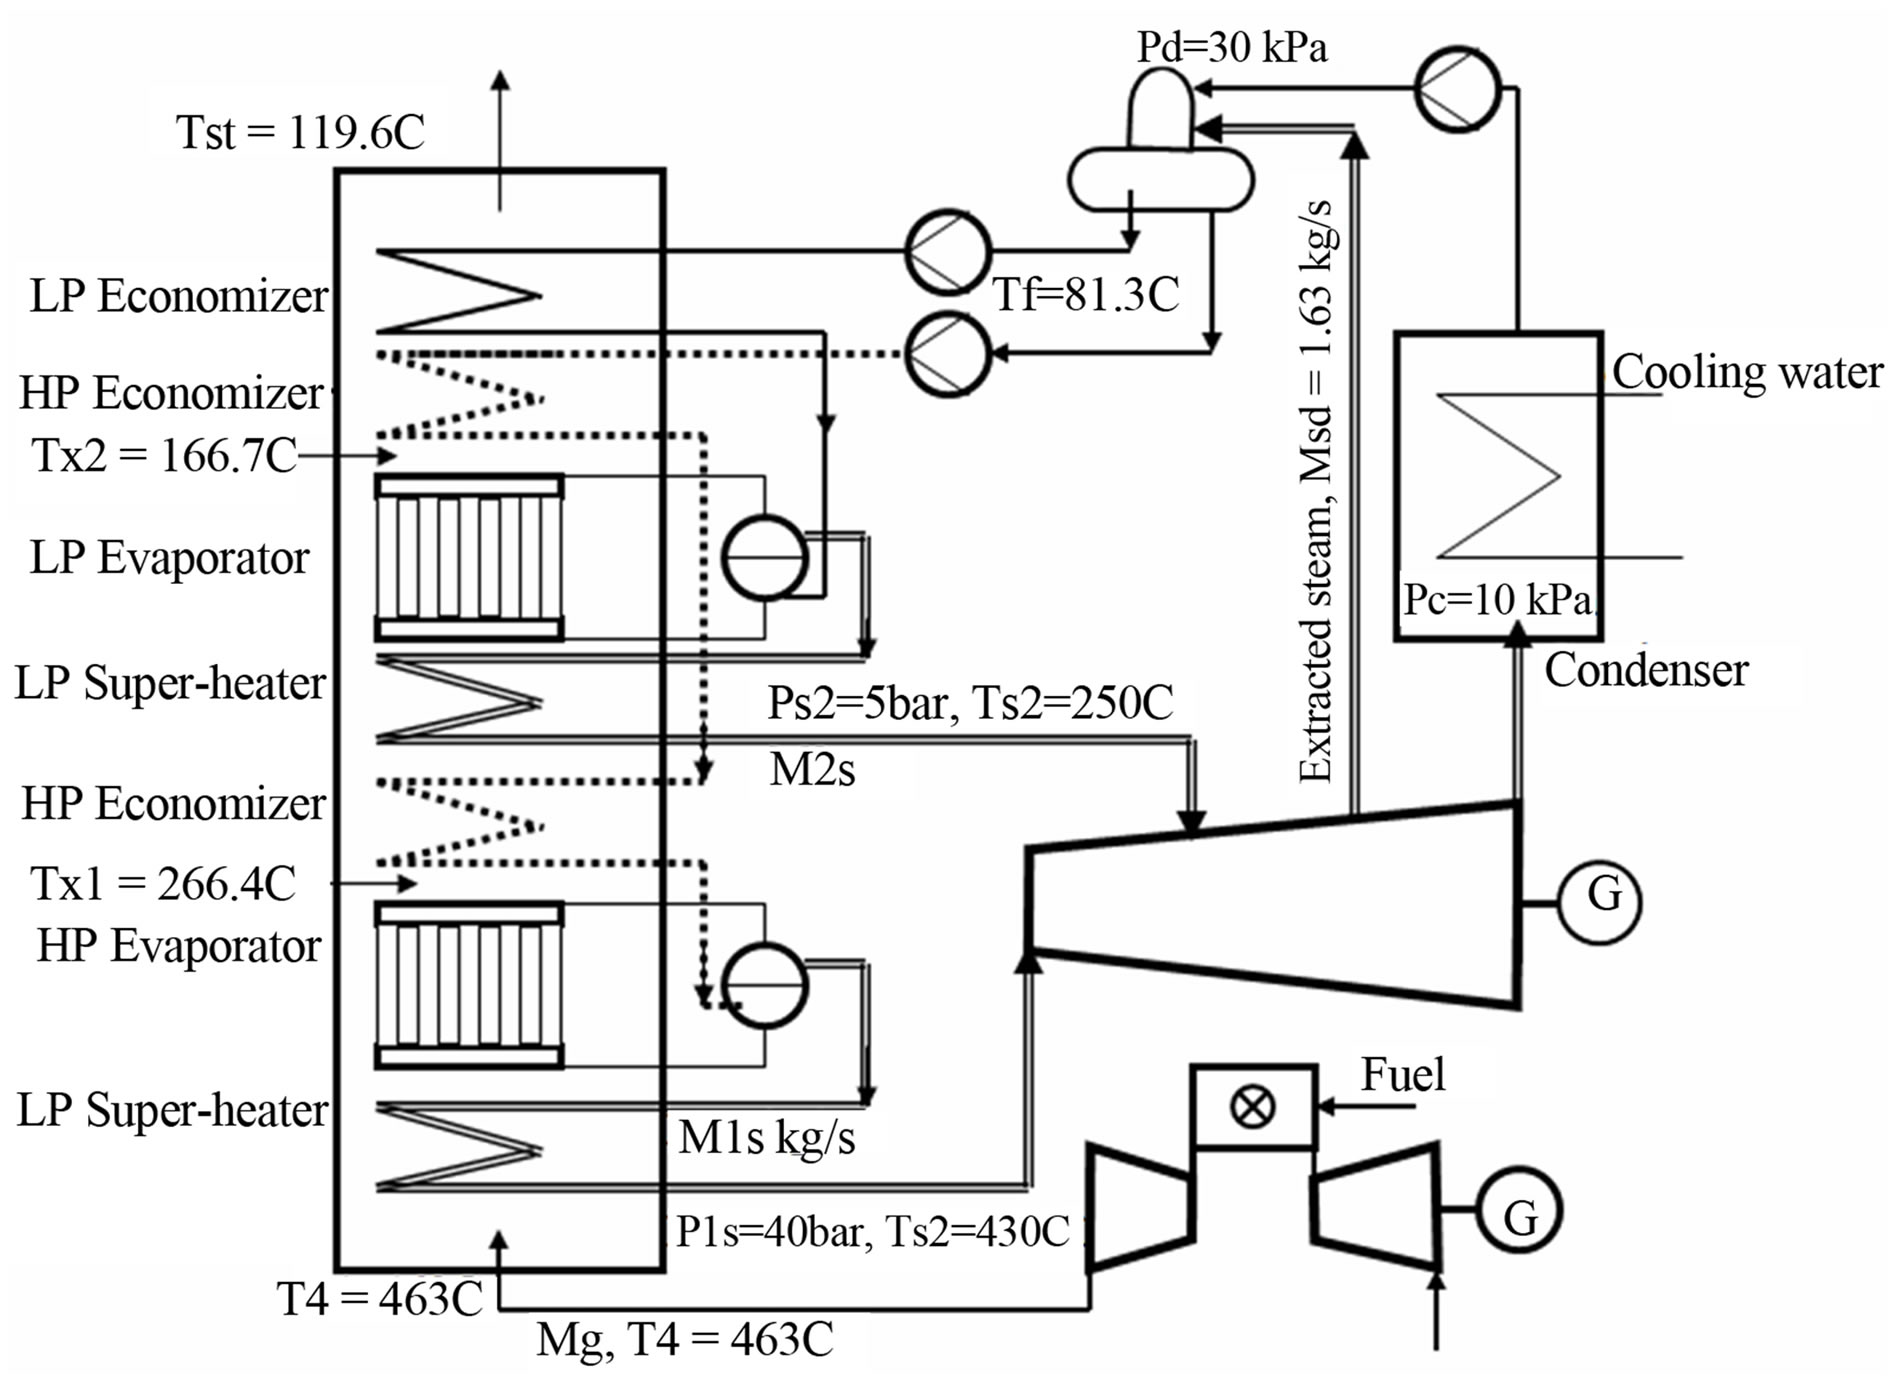
Figure 16. Combined cycle supplying steam to desalination plant.
• RasAnuFontas (RAF) A: It has EP capacityof497 MW including 6 GT × 32 MW, 6 × 48 MW, and 2 × 9 MW. It has 10 × 7 MIGD capacity MSF desalting units. The plant was commissioned in 1980. The desalting capacity was reported as 55 MIGD in 2010.
• RAF B & B1: RAF B started with 5 CC × 121.8 MW each; operated in 1995-1996 with total EP capacity of 609 MW. RAF B1 was added in 2002 by 3 GT×125.5 MW each; total 387 MW from Alstom GT13E2 gas turbines. All eight turbines are installed in one airconditioned gas turbine building. The plant has 5 × 6.6 = 33 MIGD capacity MSF desalting units. The

Figure 17. Steam supply to desalination system from steam extraction-condensing turbine.
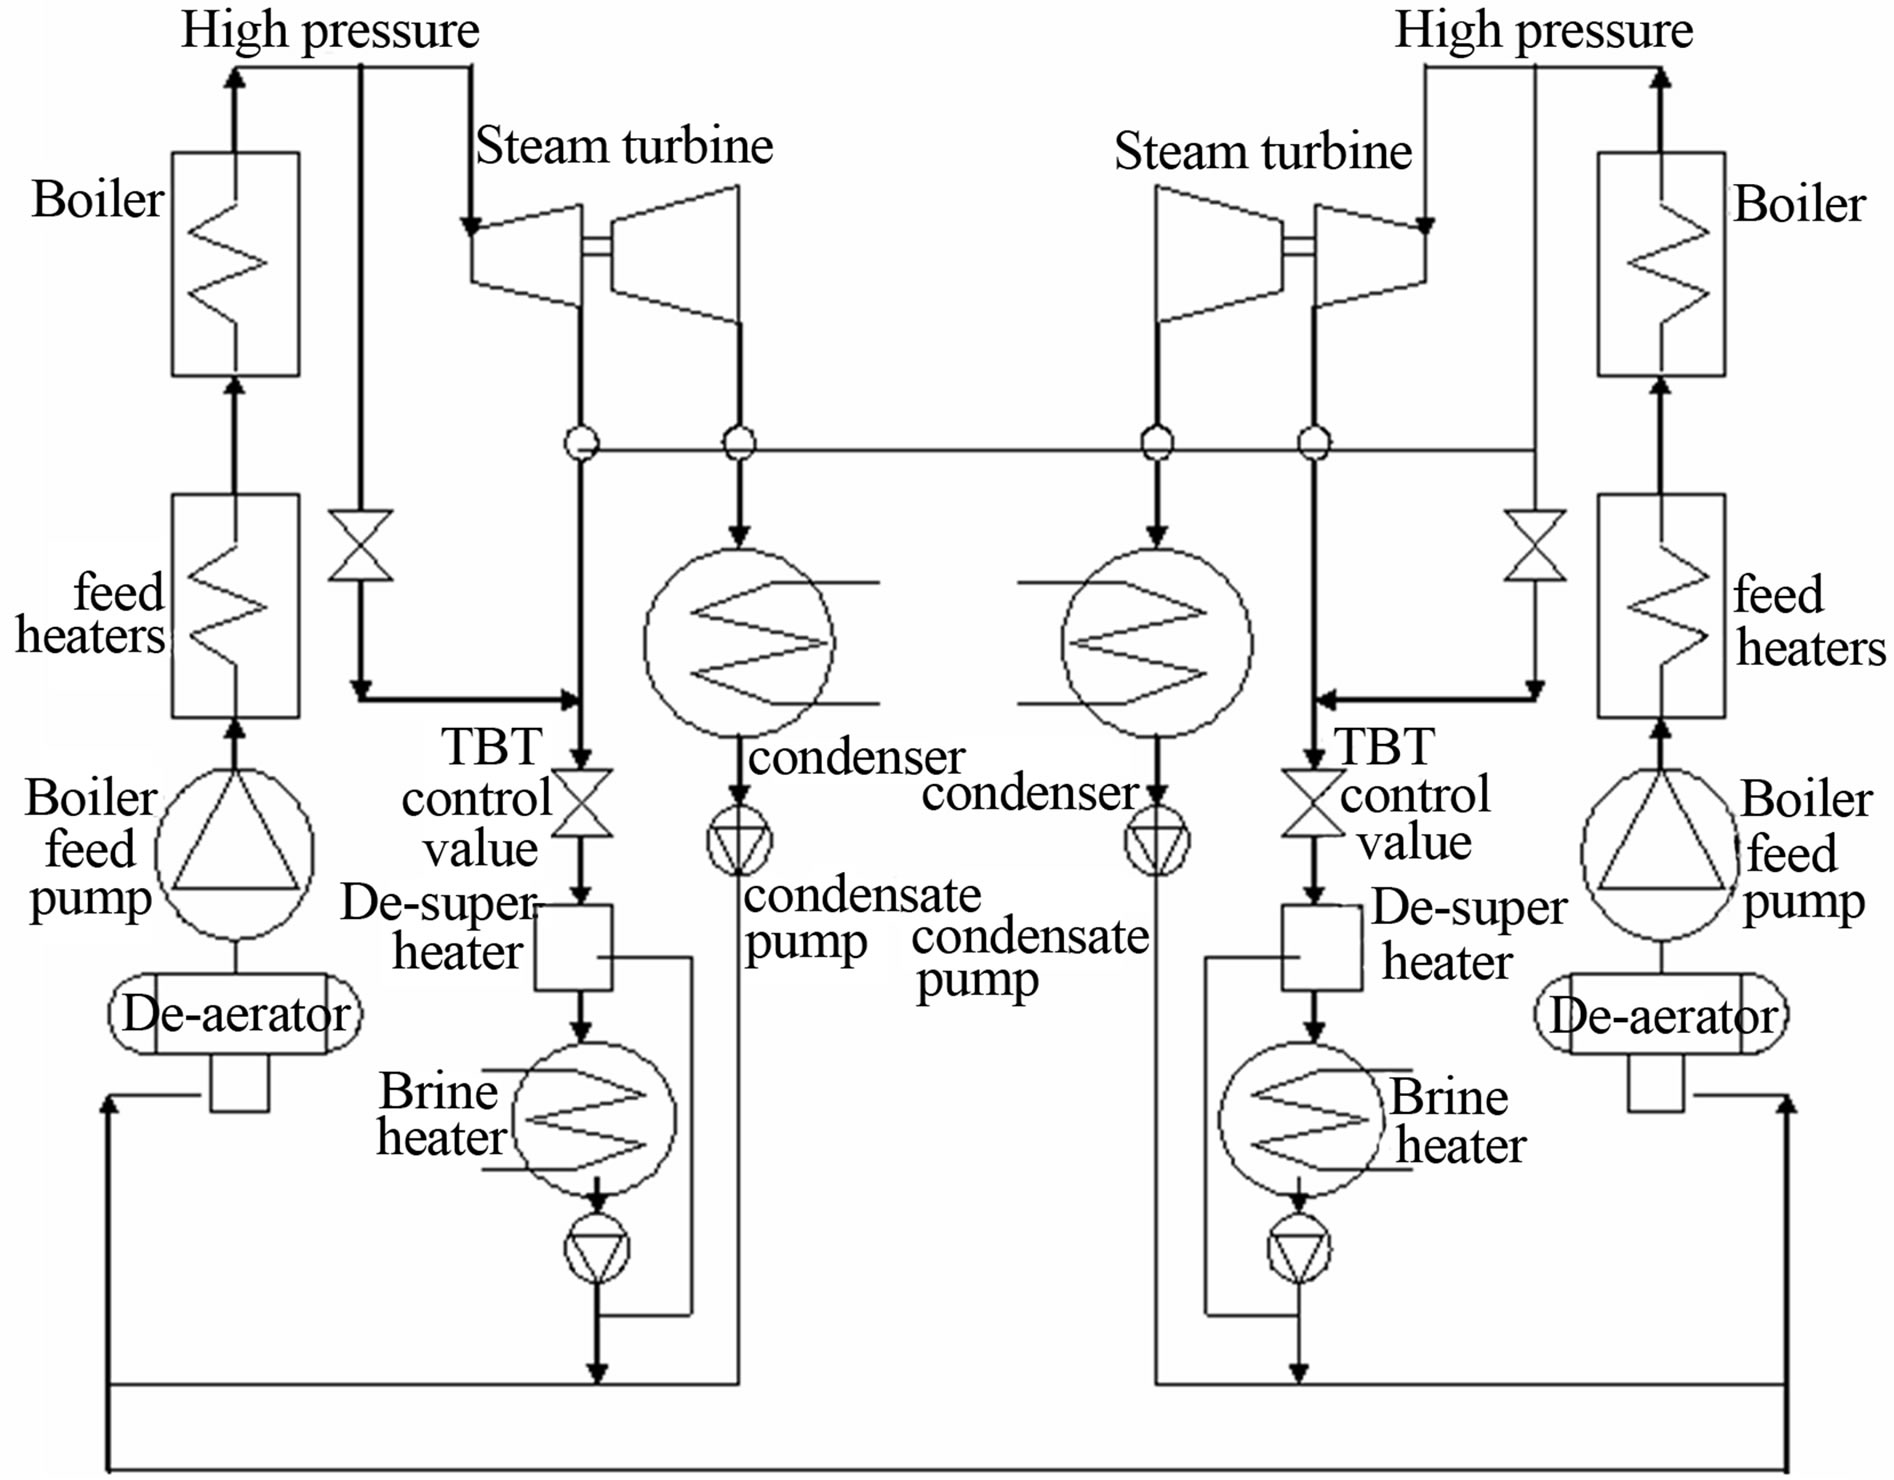
Figure 18. Steam supply to desalination system from two steam turbines.
MSF plant designed capacity is 52.7 MIGD. The Qatar Electricity and Water Company (QEWC) and the Qatari General Electricity and Water Corporation (KAHRAMAA) signed a contract on January 7, 2012 to build 2 MSF units of 18 MIGD each MSF type at total cost of $M500 in Ras Abu Fontas; and to be completed in the first half of 2015RAF B2 has 608 MW capacities consisting of 5 GT with 5 HRSG supplying steam to five MSF distillers, providing a desalination output of 33MIGD (150,000 m3/d).
• Also RAF A1 desalting plant of has 45 MIGD desalting capacity. It uses the waste heat from RasAbouFontas B1, and was commissioned in 2010, Figure 19.
• Saliyah of 2 × 67 MW 9001B gas turbines.

Figure 19. Ras abu fontas power and desalting plant, [20].
• Doha Super South has 62 MW EP capacity.
So, the total EP capacity belongs to the Qatar Electricity and Water Company is 2273 MW, and its desalting water capacity is 162 MIGD.
• RasLaffan (RL)-A has two CC of 378-MW each. Each CC has 2 GT (known as SGT5-4000F) ×100 MW plus Steam Turbine (ST) of 178 W. Each CC is combined with 2 MSF desalting unit of 10 MIGD each. So, RA has 756 MW total EP capacity and 40 MIGD desalting capacity. RL A plant started operation in May 2004, and cost of $720 m.
• RL B of electric power capacity equal 1025 MW using CC; and 4 MSF × 15 MIGD desalting plants; and cost $M900 and commissioned in 2006. The plant has three largest Siemens SGT5-4000F gas turbines, two 220MW steam turbines supplying steam to the four MSF units.
• RL C (known also as RasGirtas) is the largest power and water plant in Qatar with EP capacity of 2730 MW using CC, and was opened in May 2011; and cost US3.9 billion. It has 10 TVC-ME desalination units built by Sedimof 28,640 m3/d (6.3 MIGD) each, [25]. Besides satisfying Qatar with 30% of EP need and 20% of potable water need; it will also provide off-peak electricity to neighboring GCC countries via a planned regional power grid, [26]• Mesaieed Power plant: Its EP capacity is 2000 MW power plant. It was commissioned in 2009. The plant has three sections, and each section contains: 2 × 233 MW GT + 2HRSG + 1 × 233 MW steam turbine. All GT and Steam turbines are manufactured by GE. The plant was built by the Spanish firm IBERDROLA Ingeniería at cost $1.63 billion dollars, [27]. A5760 m3/d TVC-MED desalination plant was added by TriTech Holding Inc., [28].
The desalted seawater annual production, in Million cubic meters per year (Mm3/y) increased from 225.1 Mm3/y in 2006 to 373.6 Mm3/y in 2010, see Figure 20, [8].
Water consumption/ca is among the highest in the world. Water production in 2010 was 373.6 Mm3/y, [8] and population was 1,699,435, see Table 4" target="_self"> Table 4. This gives annual cubic meters per capita (m3/y.ca) consumption of 220 m3/(y.ca); or daily 602 liters per person (l/d.ca), [8]. A total of 1,903,447 people were inside of Qatar on Jan. 31. That’s an all-time high, surpassing the 1.85 million record set in November 2012, [29].
4. Water and Energy Relation in Desalted Seawater (DW) Production
4.1. Energy Consumed by Multi Stage Flash (MSF) Desalting System
Energy and water are closely linked. In this section, the extensive amounts of energy used in desalting seawater are calculated.
In calculating the energy consumed in the commonly used Multi Stage Flash (MSF) system, a practical example of 6 Million Imperial Gallons per Day (MIGD) MSF unit operating in Kuwait is given here.
Each desalting plant requires mechanical energy to: extract seawater from the sea, desalting process, brine discharge, and DW distribution. Thermally operated desalting units need also heat in the form of steam supply at moderate pressure (2 - 3 bar), besides the pumping energy. For the considered MSF of 6 MIGD, it has Gain ratio (Distillate product D/Supplied steam S) equal to D/S = 8, consumes 280 kJ of thermal energy/kg of distillate. The flow rates of the distillate output D is 316 kg/s (6 MIGD), the consumed steam S is 316/8 = 39.5 kg/s, the required cooling water is about 7.7D = 2433 kg/s, and the re-circulating stream is 12D. The nominal capacity and heads of used pumps are given in the following Table 5, [30].
The nominal pumping energy used to produce 316 kg/s distillate is 5250 kW, or 16.6 kJ/kg, but the actual consumed pumping energy is 14.4 kWh/m3.
If the steam supplied to the desalting unit is at high temperature Th= 127C (400 K), was supplied to Carnot cycle operating between this steam temperature and low temperature TL = 47C (320 K), the average condenser temperature in the Gulf area, the Carnot cycle would have an efficiency of

For an actual cycle, its efficiency would be lower than that of ideal Carnot cycle, say 15% less.
So the real work equivalent to the 280 kJ/kg thermal energy supplied the MFS is:
280 × 0.85 × 0.2 = 47.6 kJ/kg (or 13.22 kWh/m3), or the equivalent of work to the 280 kJ/kg of heat supplied to the MSF unit per kg of distillate. In practice this number reaches 16 kWh/m3.
So, the total equivalent work (for the heat supplied and pumping energy) is about 17.22 kWh/m3.
By knowing that the electrical energy cost is the US ranges from cheap cost $0.08/kWh in the state of Idaho,
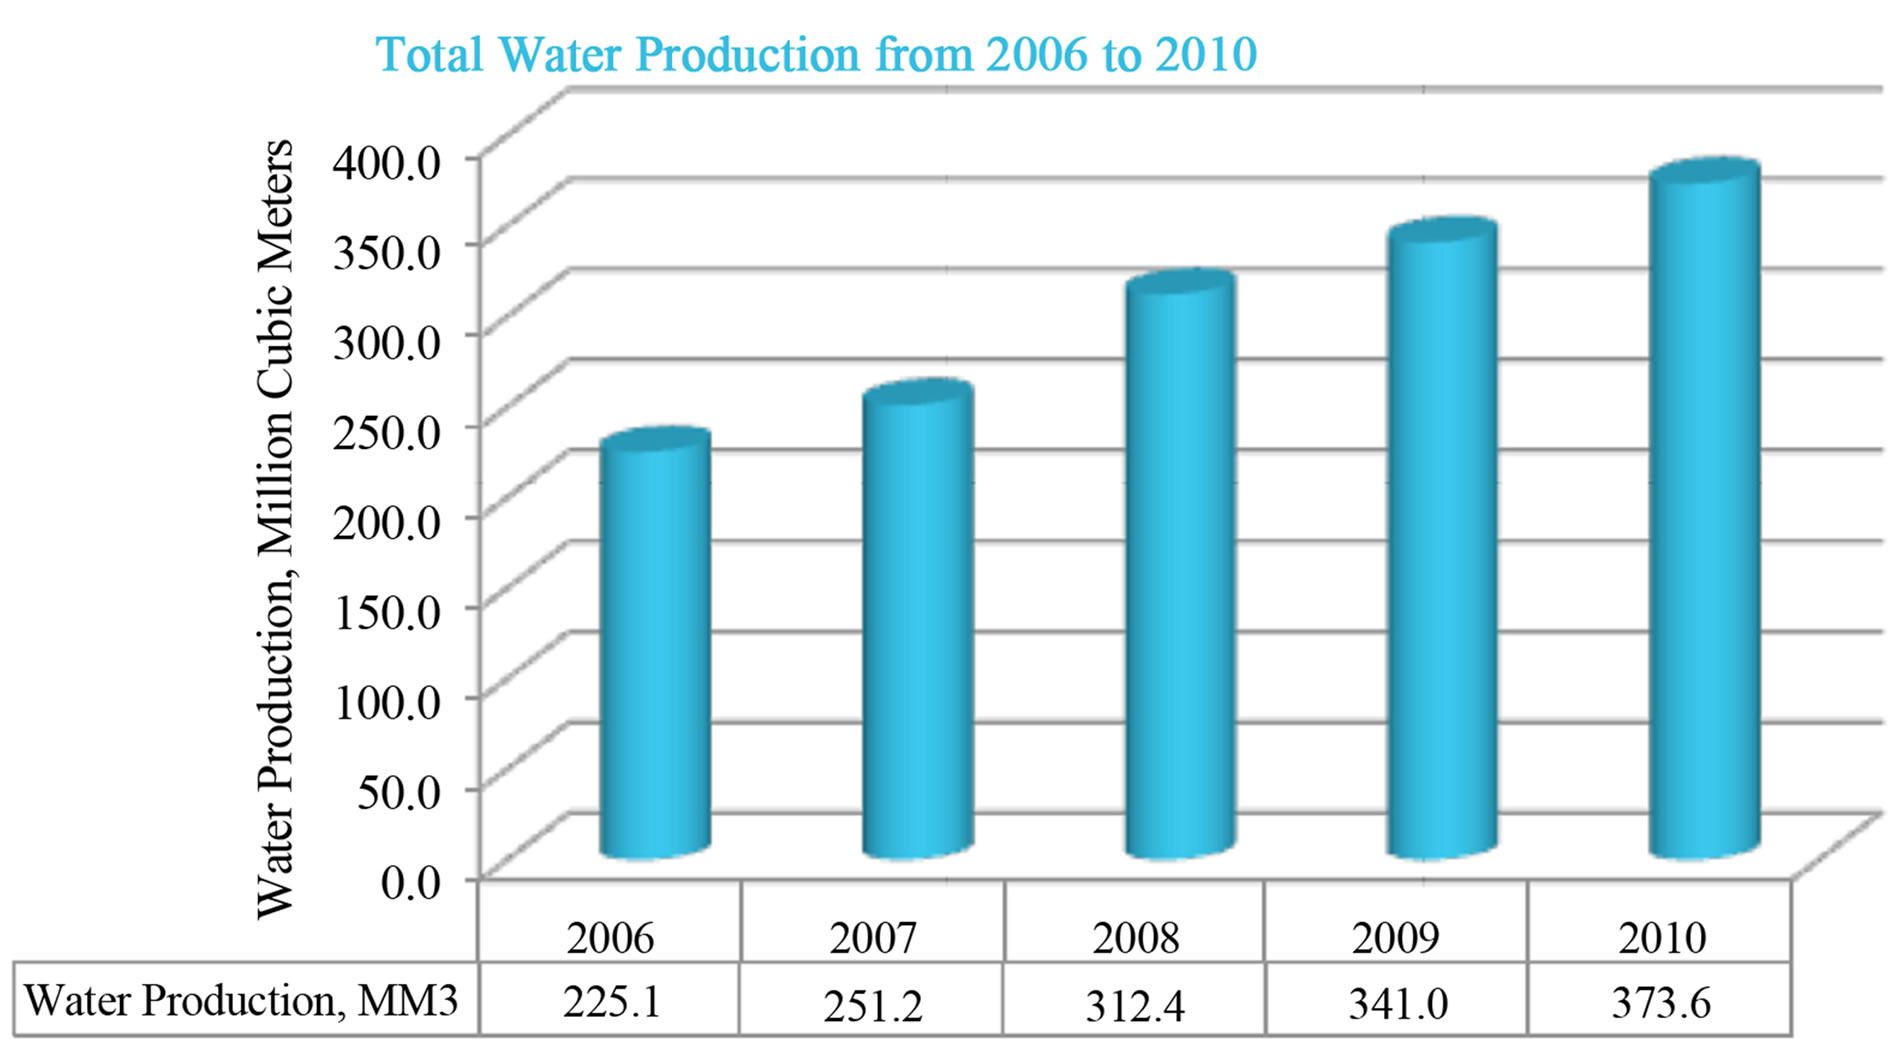
Figure 20. Desalted seawater production in Qatar; representing 99% of municipal water, [8].
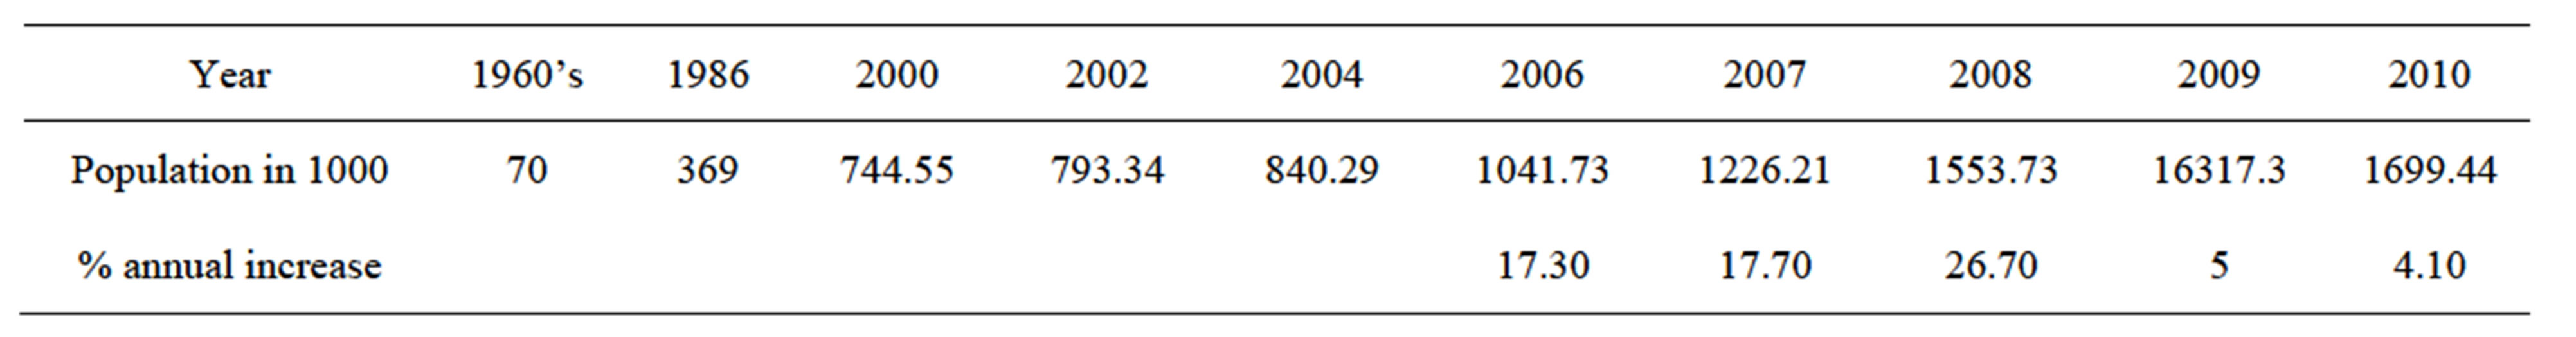
Table 4. Historical Qatar population, [29].
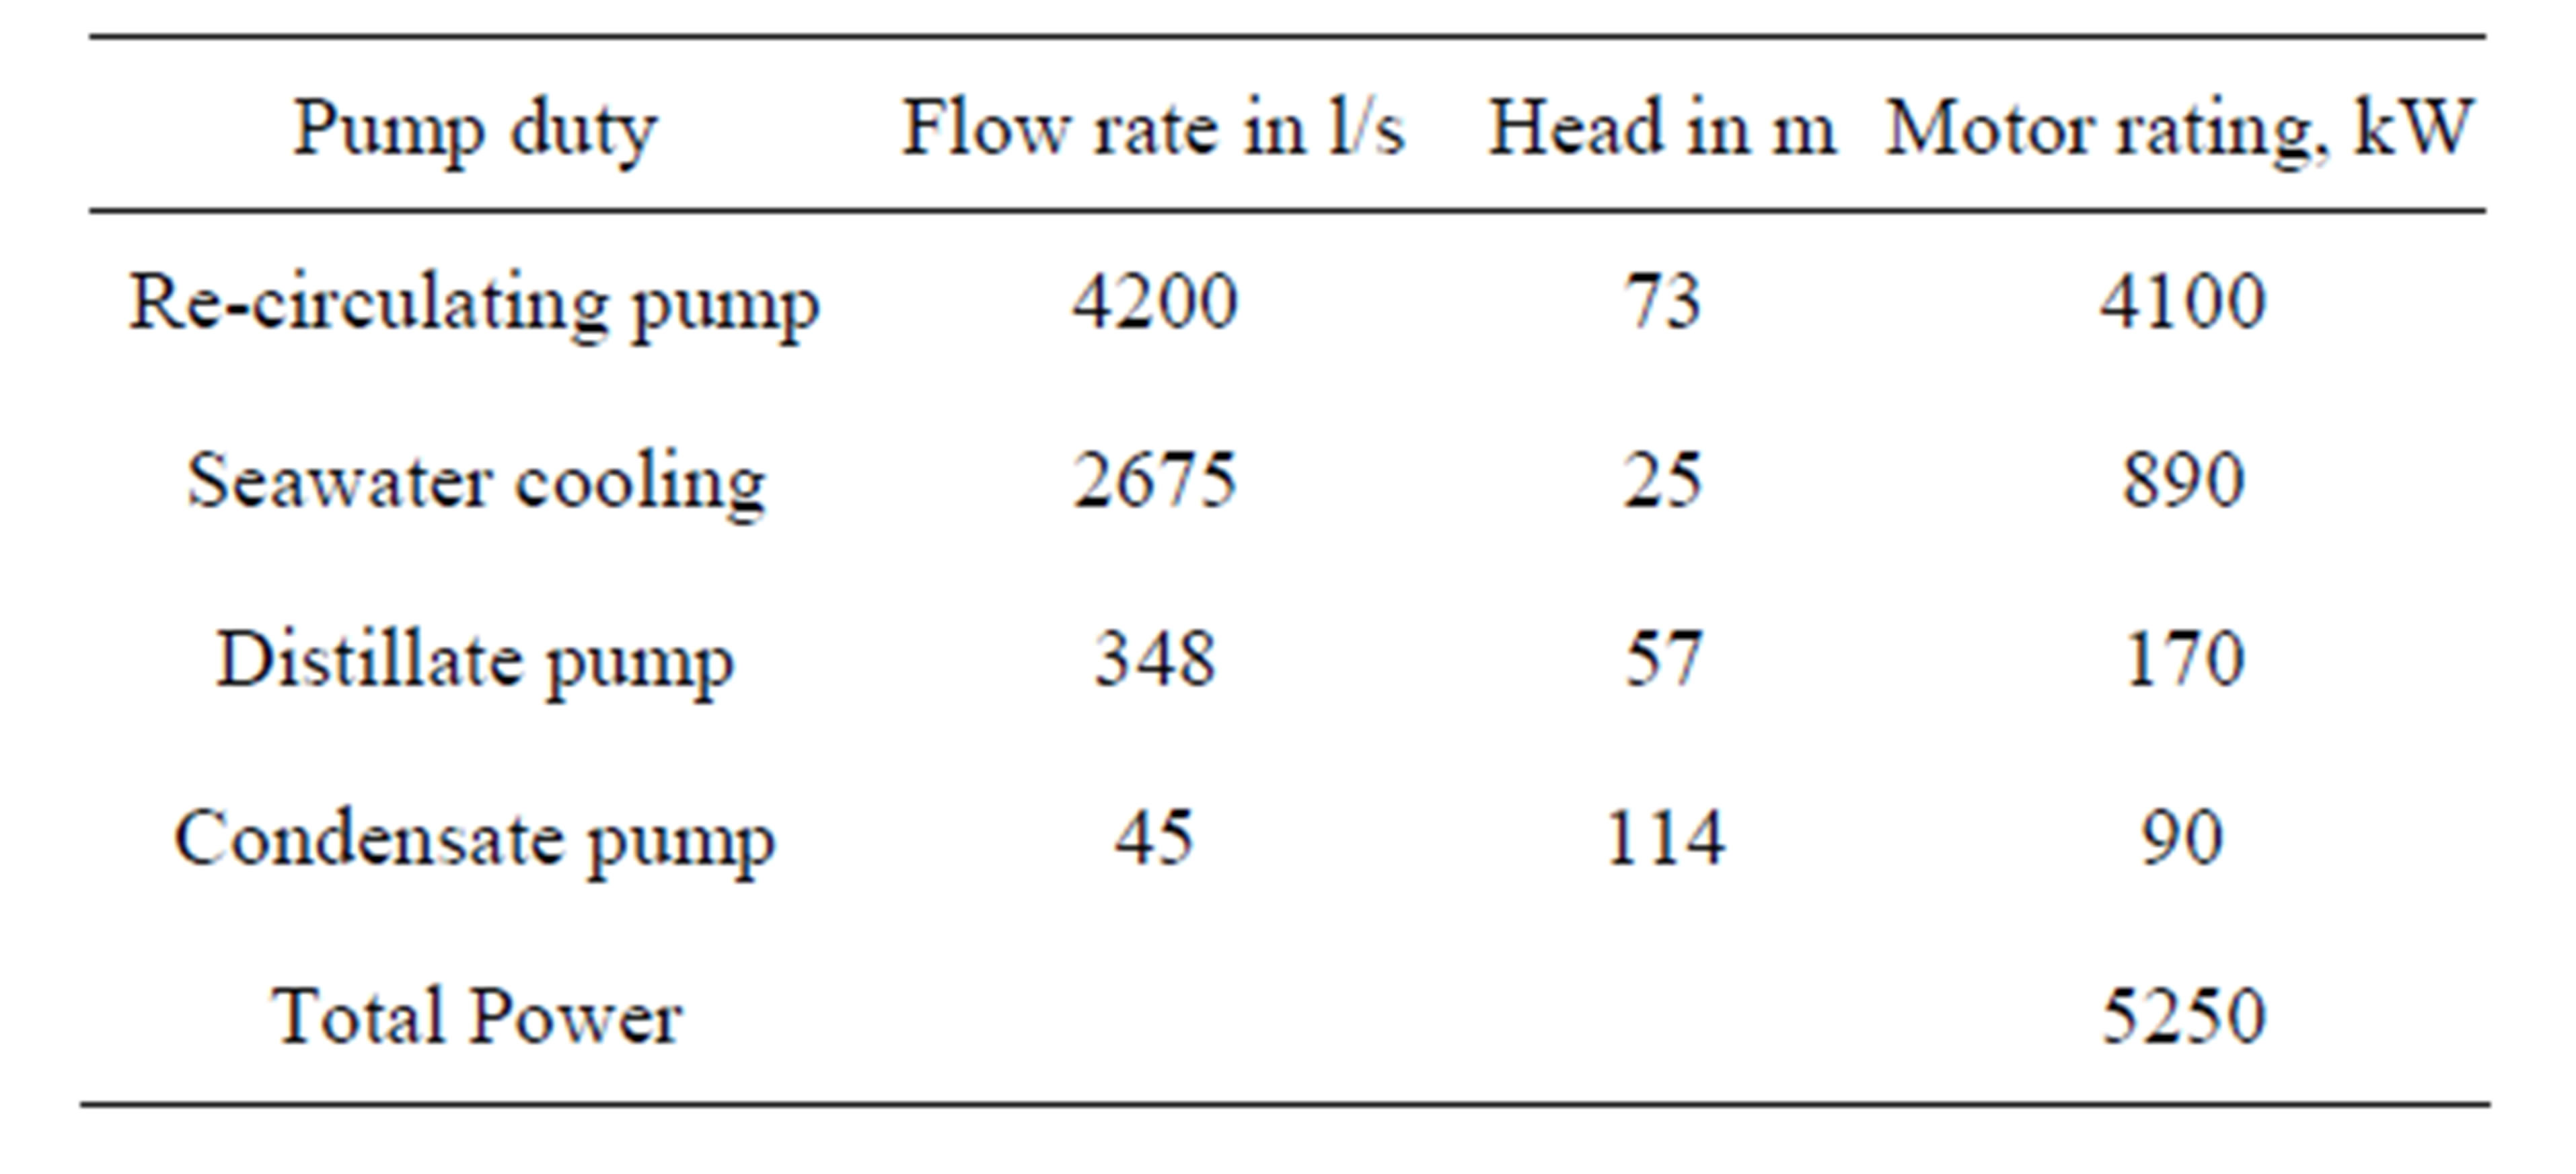
Table 5. Characteristics of several pumps in a MSF unit of 6 MIGD operating in Kuwait, [30].
where EP is generated by hydropower, to very expensive cost of 0.332/kWh in Hawaii, where EP is produced by burning oil, the average cost for most of other states can be considered equal to $0.12/kWh, and will be considered here in calculating the consumed energy of the desalting processes, [31].
If the average US EP cost is considered here, the energy cost in $/m3 of distilled water is $2.1/m3, and if this represents 60% of distilled water cost, the actual DW cost would be $3.5/m3.
The commonly used technology of MSF and newly used Thermal Vapor Compression-Multi Effect Distillation (TVC-MED) are very energy extensive, and should be stopped, and substituted by the more energy efficient Seawater Reverse Osmosis (SWRO) desalting system.
4.2. Energy Consumed by Seawater Reverse Osmosis (SWRO) Desalting System
In seawater Reverse Osmosis (SWRO) desalting system, Figure 21, membranes are used to separate fresh water from saline feed-water. Feed-water is pumped, after being pre-treated to selective semi-permeable membranes which allow water, but not salt to pass through the membranes. The pressure of the pumped feed seawater to the membranes should be much higher than the osmotic pressure for the freshwater to pass through the semipermeable membranes, leaving the solid salt behind. Examples of applied pressures at different salinities are given in Table 6, [32].
The RO plants are very sensitive to the feed-water quality (salinity, turbidity, temperature), while other distillation technologies are not so demanding in this respect. High-salinity seawater requires high feed pressure to the membranes and thus requires more energy. High-turbidity feed-water can cause fouling where membrane pores are clogged with suspended solids, and thus the SWRO needs extensive feed water pretreatment.
The energy consumed by the SWRO is calculated here for a typical example.
For one m3/second (s) of permeate (P), and recovery ratio R is:
R = P/F = 1/3, the feed (F) would be 3 m3/s.
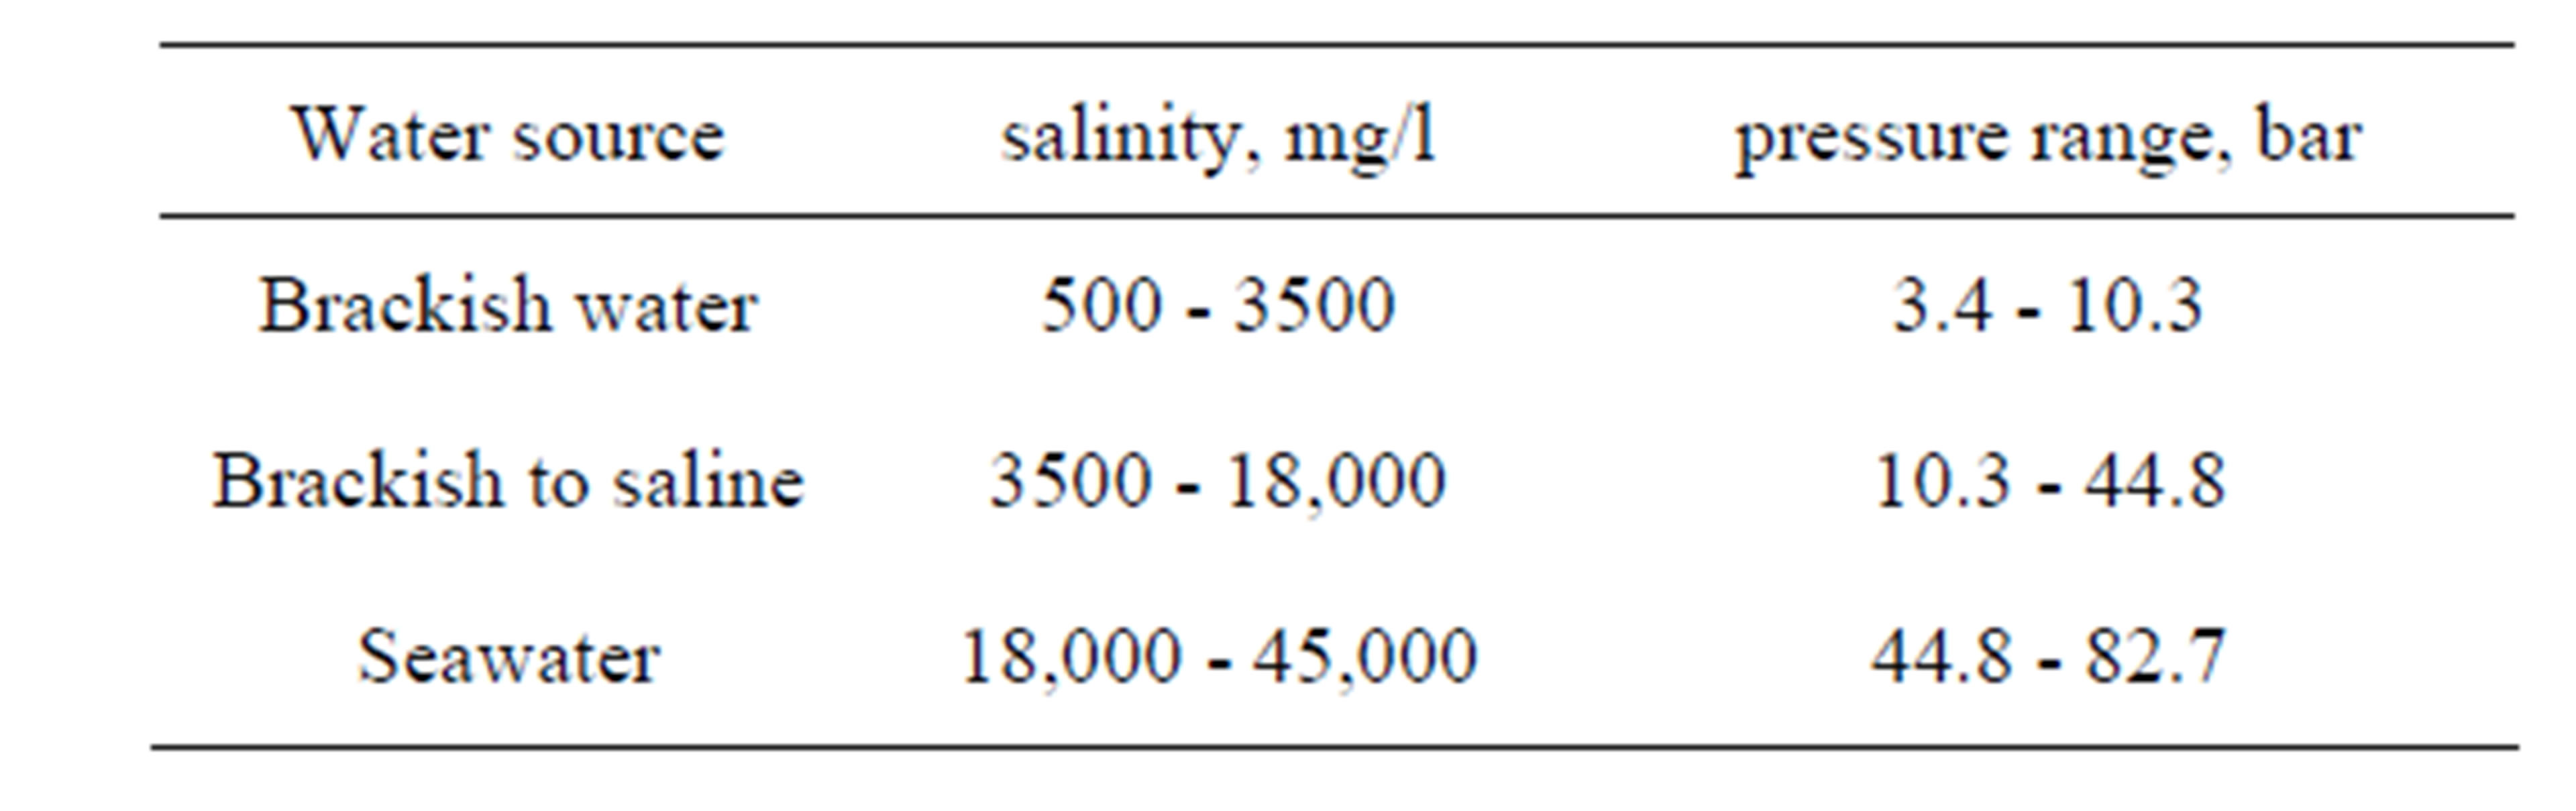
Table 6. Required Feed water (F) applied pressure for several F’s salinity, [32].
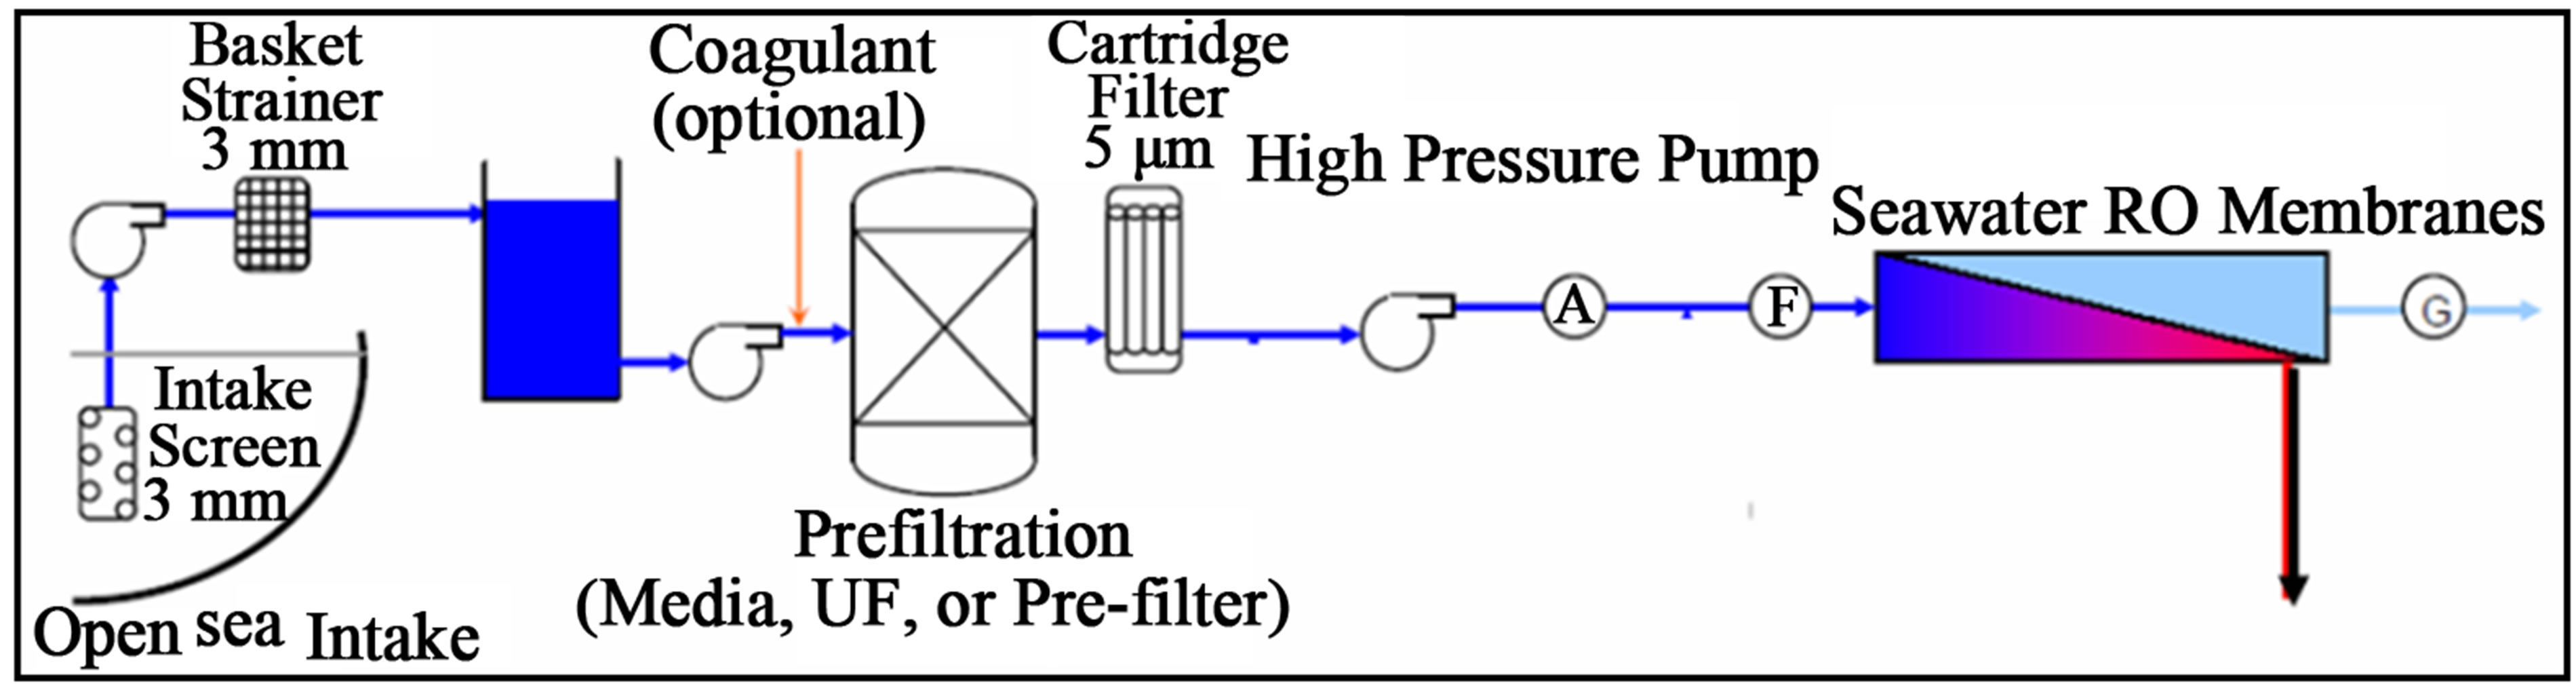
Figure 21. Simplified reverse osmosis scheme without energy recovery system.
For 70 bar applied feed pressure (Pf), typical feed pressure for high salinity water in GCC), 0.8 pump efficiency (hp), the consumed feed pump energy is:
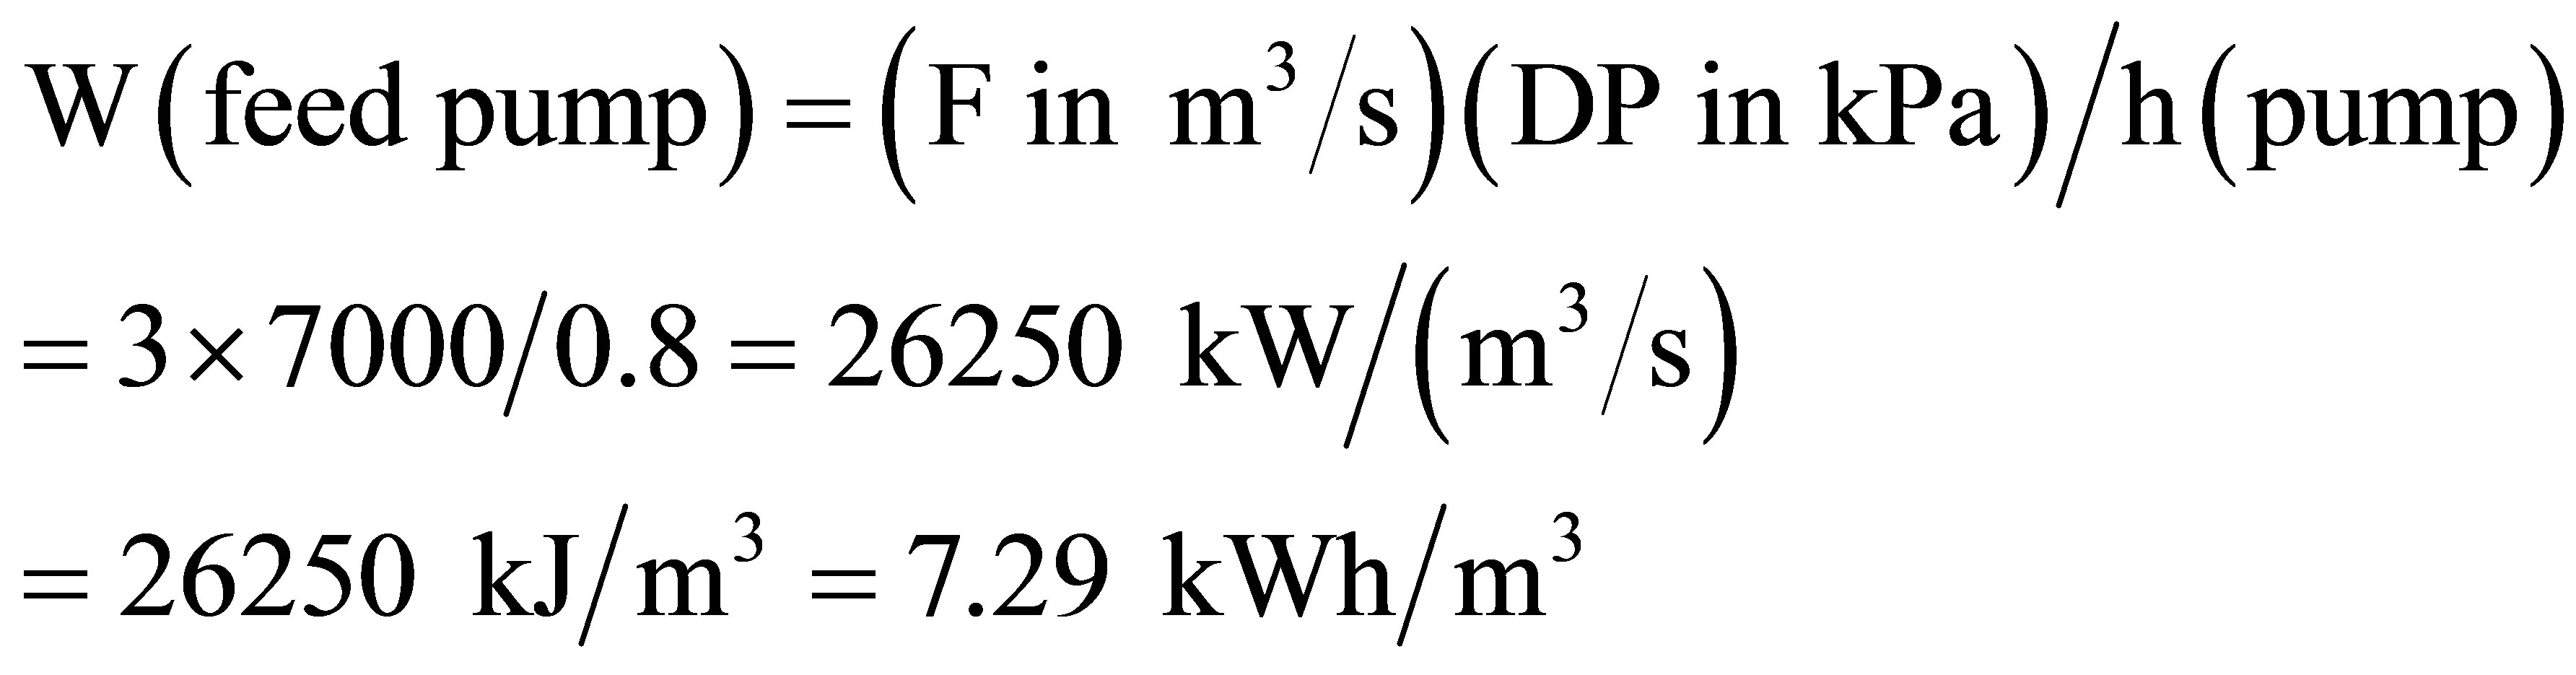
Energy recovered: the brine (B) flow rate becomes 2 m3/s, and leaves the membranes at pressure little less than the feed pressure, say 67 bar, and enter an energy recovery turbine of 0.9 turbine efficiency (ht) would give work output

So, the net feed water pump power = 7.29 − 3.35 = 3.94 kWh/m3.
The SWRO consumed energy is almost 1.2 the energy consumed by the feed water pump, or 4.728 kWh/m3.
This power consumption depends on feed water temperature, see Figure 22 and the seawater salinity, which varies with time.
The most energy efficient desalting Seawater Reverse Osmosis (SWRO) should be the only used method, where the pumping energy is only used, in the range of 4 - 6 kWh/m3, and the desalting cost is in the range of $1 - $1.5/m3.
For 5 kWh/m3 energy consumption by SWRO method, the energy cost for $0.12/kWh/m3, the energy cost is $0.6/m3. If the energy cost represents 50%, the DW cost is in the range of $1.2/m3.
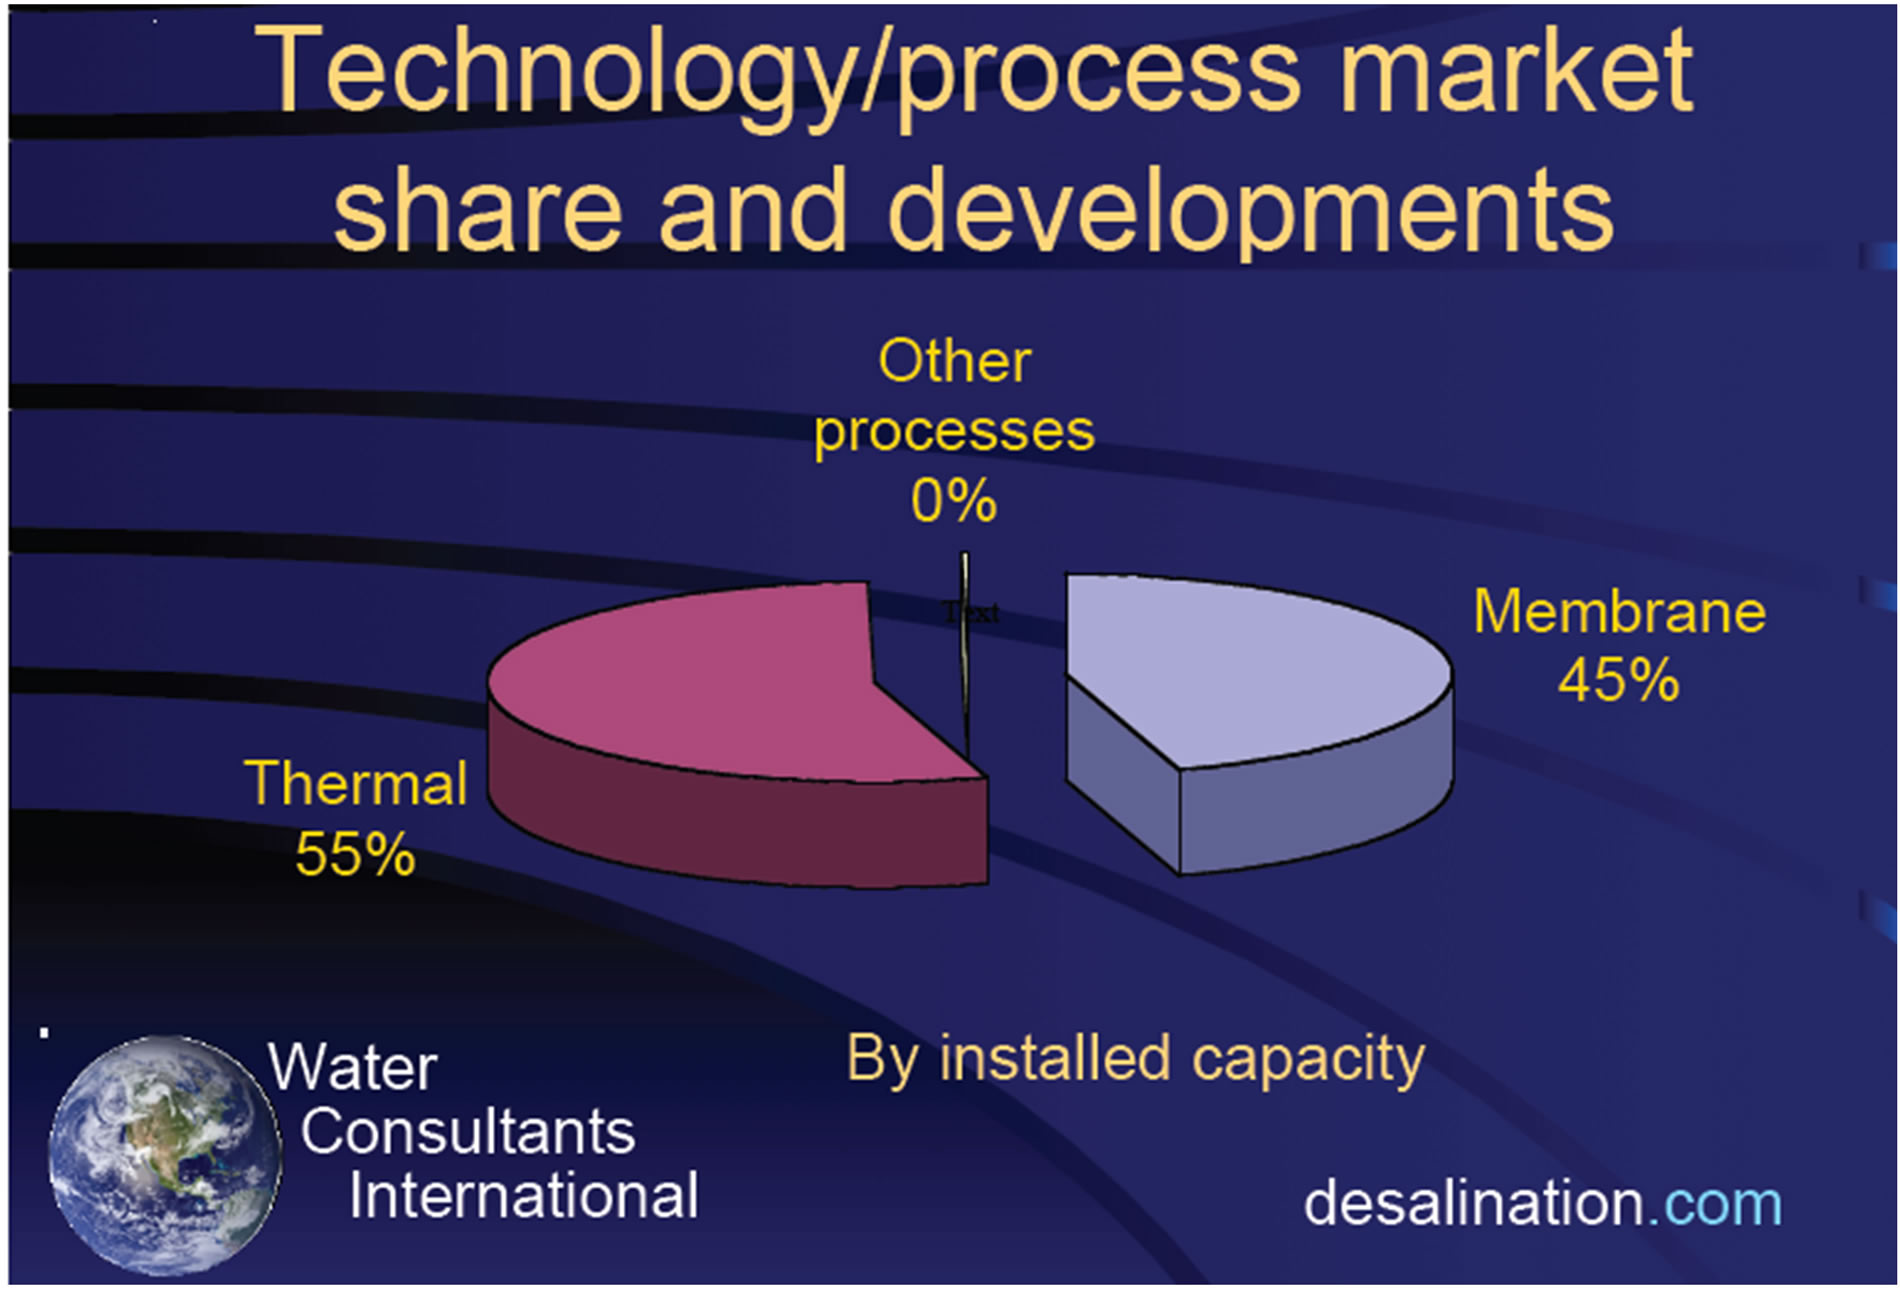
The high cost of producing DW by the thermal technology is the reason behind its decreasing share from about 55% in 2003 to 34.8 in 2012 as shown in Figure 23(a), [33] and Figure 23(b), [34].
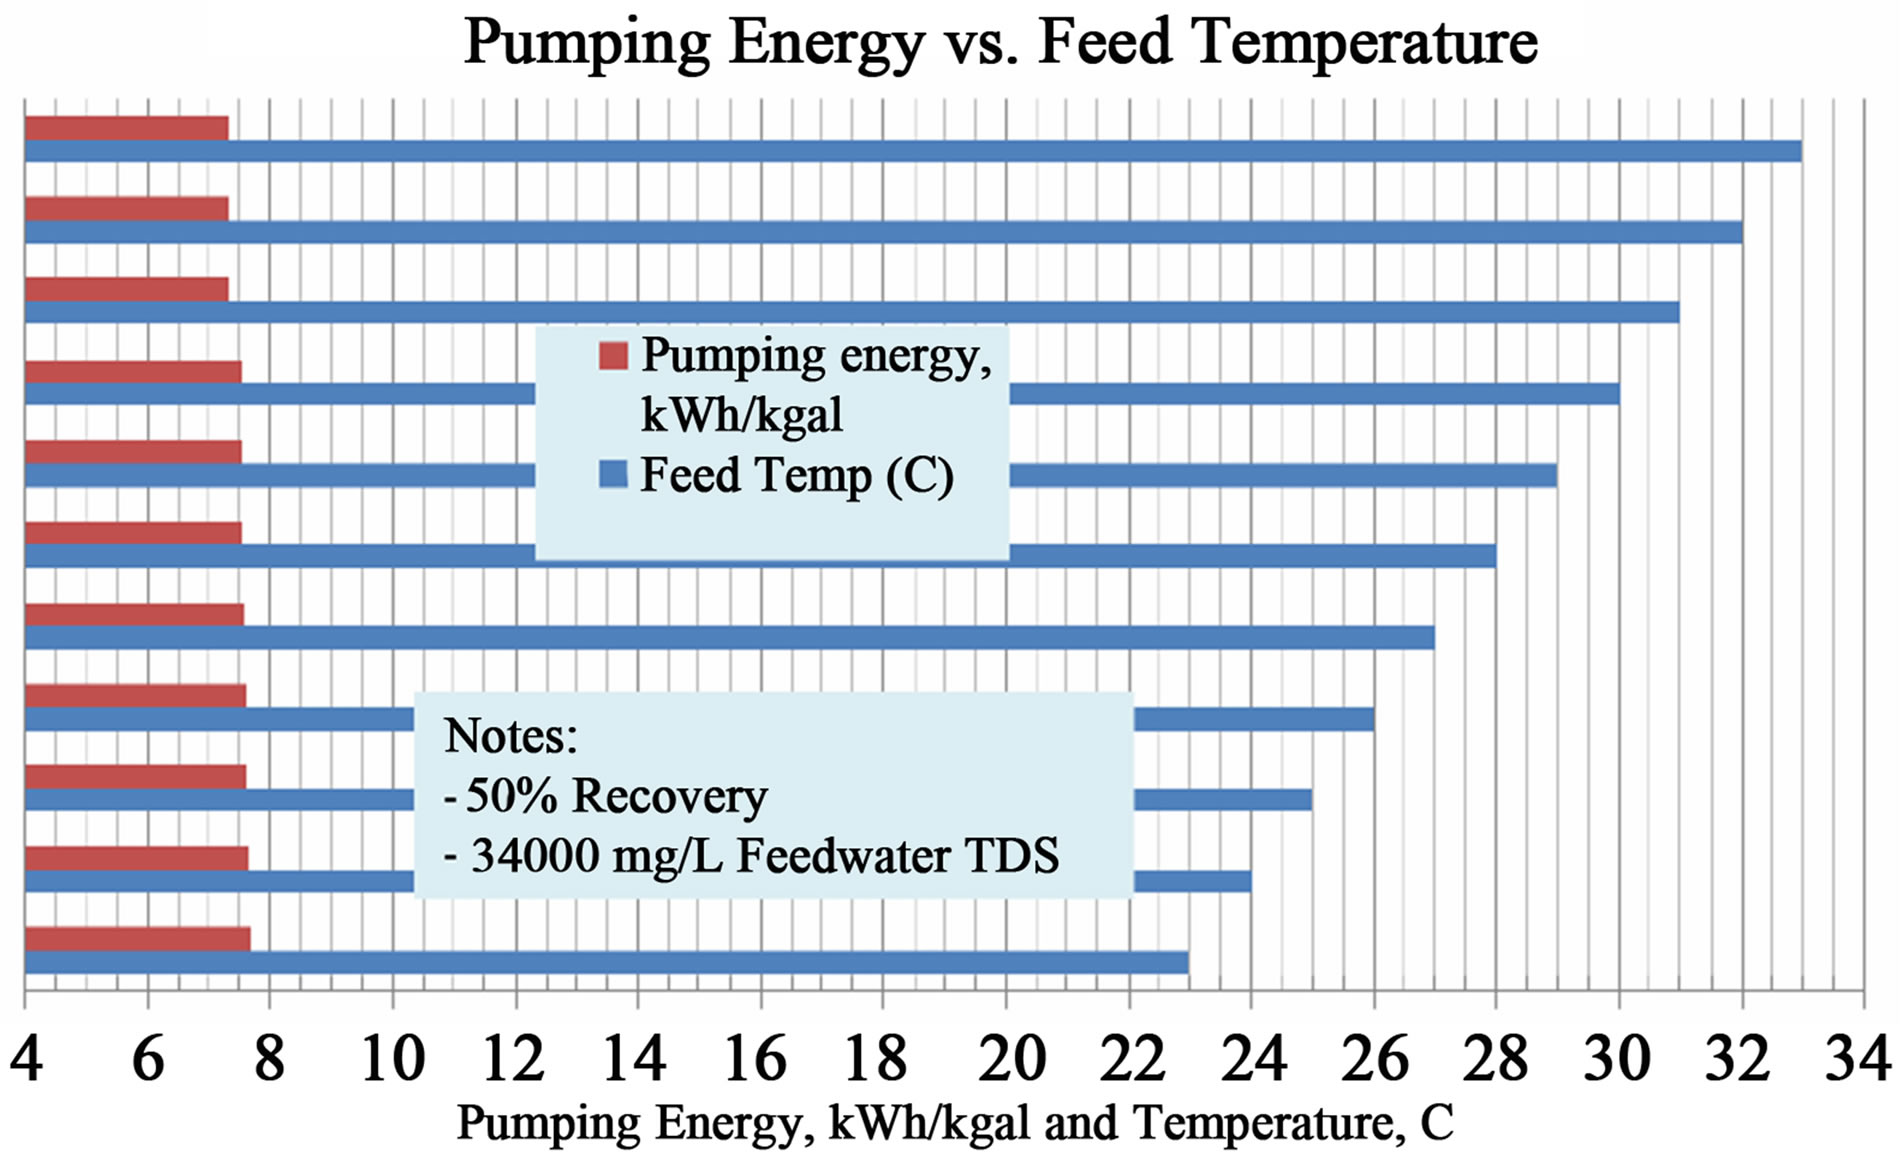
Figure 22. Dependence of pumping energy (in kWh/kgal = 3.75 kWh/m3) in SWRO on seawater temperature, [32].
 (a)
(a) (b)
(b)
Figure 23. (a) The share of different dealing technologies in 2003, [33]; (b) Desalination Technology Market (IDA in Koschikowski, 2011, [34].
This and the previous cost of the desalting from the MSF do not include the heavy cost encountered of marine environment due to disposing very high salinity brine loaded with polluted chemical back to the sea. These do not include the cost of air pollution caused by burning fuel to produce the energy required to the desalting process.
It may be noticed here at the end of COP 18 held in Doha, Qatar in Dec. 2012, two major announcements were given:
The first that HH the Amir pledged at least 2% of EP generated in Qatar should be by solar energy by 2020.
The second is by Fahad bin Mohammed Al Attiya, Chairman of the Organizing Sub-Committee for COP18/ CMP8. It stated that final design stage of putting together the solar plant which will generate 1800 MW power from 2014 onwards and would potentially produce 80 percent of our water needs through harnessing solar power”, [35].
5. Impact of CPDP Consumption on the Environment
The use of fossil fuel (NG and oil) combustion in PPs is accompanied by the CO2 emission.
In 2011, the estimated NG consumption was 21.4 M tons of oil equivalent (toe) out of the total NG production of 132.2 M toe. This means that 16.2% of the production in that year was locally consumed. Meanwhile the consumed crude oil was 8 M ton, and represents 11.25% of the oil production of out of 71.1 M ton.
The NG combustion causes the CO2 emission of (21.4 × 0.75 × 44/12) = 58.85 Mt/y of CO2.
The oil combustion of 8 M ton causes the emission of (8 × 0.85 × 44/12) = 24.93Mt/y of CO2.
So, the total emission of CO2 due to fuel combustion in Qatar in 2011 is calculated as 83.78 Mt/y of CO2. For population of 1.85 at the end of 2011, the per capita CO2 emission is 45.3 t/y.ca. This is compared with 44 t/ca reported in 2009, [36].
Desalting seawater has negative effects on the environment. A percentage of 20% - 24% of the fuel consumed in the CPDP is for DW generation; and thus the same ratio of CO2 emission from CPDP is due to seawater desalting. More than CO2 emission, the desalting of 373.6 Mm3 in 2010, means that on the average 6 times of this amount is withdrawn from the sea, and after partially desalted, 5 times of this amount is (or 1868 Mm3 of salty water rejected back to sea). The rejected water is at temperature of about 11˚C higher than that of seawater, or dumping thermal energy of 82.192 Million (M) GJ in the sea. Also, part of the rejected water (brine), about twice of the desalted water is rejected at higher salinity than that of seawater, say at 70,000 part per million (ppm), if the seawater salinity is 45,000 ppm. These affect badly the marine environment by fish impingement in the intakes, high salinity and chemical contents of the rejected brine.
6. Need of Enhancing the Efficiency of the CPDP
Qatar’s PPs are large fuel energy consumer. The consumed fuel energy to produce EP and DW can be approximately calculated. In 2010, the EP production was given as 28,144 GWh; and the DW production were given as 373.6 Mm3 (225.2 MIGD or 1.0236 Mm3/d). When the equivalent mechanical energy consumed to desalt one m3 of desalted water is assumed as 20 kWh/m3, [16], the daily equivalent EP consumed for desalting seawater is 20.47 GWh/d, or annual consumption of 7472 GWh/y. This gives total equivalent EP (for both electricity and DW productions) as 35,616 GWh/y, and the share of DW units in fuel consumption is 21%. The installed capacity of the PP in 2010 was 7830 MW, and thus the capacity factor can be estimated by 0.519. The PPs in Qatar in 2010 were simple GT of maximum efficiency of 30% and CC with maximum efficiency of 44%. When 36% average efficiency is assumed for the whole PP at all average loads, the consumed fuel energy in 2010 is 356.16 million GJ. This is equivalent to 337.57 BCF (9.563 BCM) of NG. The 2010 NG production and consumption were reported as 4121 BCF, and 772 BCF respectively. So, the NG consumed by power plants represents 43.7% of the total NG consumption and 8.15% of the total NG production in 2010. It was noticed that the NG production in Qatar increased from 3154 BCF in 2009 to 4121 BCF in 2010, amazing 30.6% in one year. The annual consumed EP/ca as shown in Table 7 is among the highest/ca in the world.
The high rate of consumed EP in reference to other countries necessitates its reduction, raising EP generation efficiency, and having demand side management (DSM) programs. The reduction of the peak load would decrease the required capacity of new power plants, and the GHG emissions. The DSM should include building capacity in the design, supervision, and assessing the DSM measures. The power plants should be checked (audit) to use fuel efficiently, and lower its energy losses. Buildings consume the largest portion of EP during the peak load (about 70%) for air conditioning equipment. So, building construction energy code should be for prepared and strictly

Table 7. Electric power consumption kWh per capita for selected countries, [37].
applied. Existing building should be audited to decrease their consumed energy. Better standards for efficient air conditioning equipment, and appliances should be established. It is clear that the performance of CPDP in Qatar can be drastically improved by several suggestions mentioned here.
7. Better Arrangements for Cogeneration-Power Desalting Water in Qatar
The performance of CPDP in Qatar can be improved by several suggestions mentioned below.
7.1. Suggestion 1: Use of GT to Operate SWRO in Winter, and Off-Peak Hours in Summer
Qatar’s electric load varies along the day, and differs daily along the year. It is generally low in winter and high in summer. However, even during the hottest day in summer with the highest peak load, there is spare capacity that can be utilized during off-peak hours. In year 2010, the maximum load reached 5090 MW in July, while the reported minimum load was 1570 MW in February. Even in the hottest days of July when the peak load of 5090 MW, the load was less than 4400 MW for about 10 hours, see Figure 24.
This means that the power plants are grossly underutilized in winter with low load factor, about 30%, as well as in summer but with less extent. The load factor can be raised by operating the unused capacity to operate seawater reverse-osmosis (SWRO) desalting plant, mainly in winter, or chilling water for district cooling in summer.
The produced desalted water can be used later, stored, or injected in aquifers. Every one MW power output can produce up to 0.88 MIGD desalted water by SWRO if its specific energy consumption is 6 kWh/m3. Moreover the GT efficiency hgt as well as their power output are higher in winter than in summer; and the efficiency increases by its operation close to nominal load.
The difference between the maximum loads between the summer and winter months (say 5100 – 2300 = 1800 MW) can be fully utilized to run Seawater reverse osmosis (SWRO) desalting plant of up to 160 MIGD. The demand for water is usually higher in summer than in winter, but the difference is not as large as the case of electricity. In 2010, it varies between 0.879 Mm3/d in February to 1.133 Mm3 in July; see Figure 25. Desalting and storing desalted seawater at low demands time can decrease the required desalting capacity to the average demand, and not the maximum water demand. It also can provide water storage capacity which is critically needed for the country water security. The country plans to build five “mega” reservoirs on the outskirts of Doha by 2016.
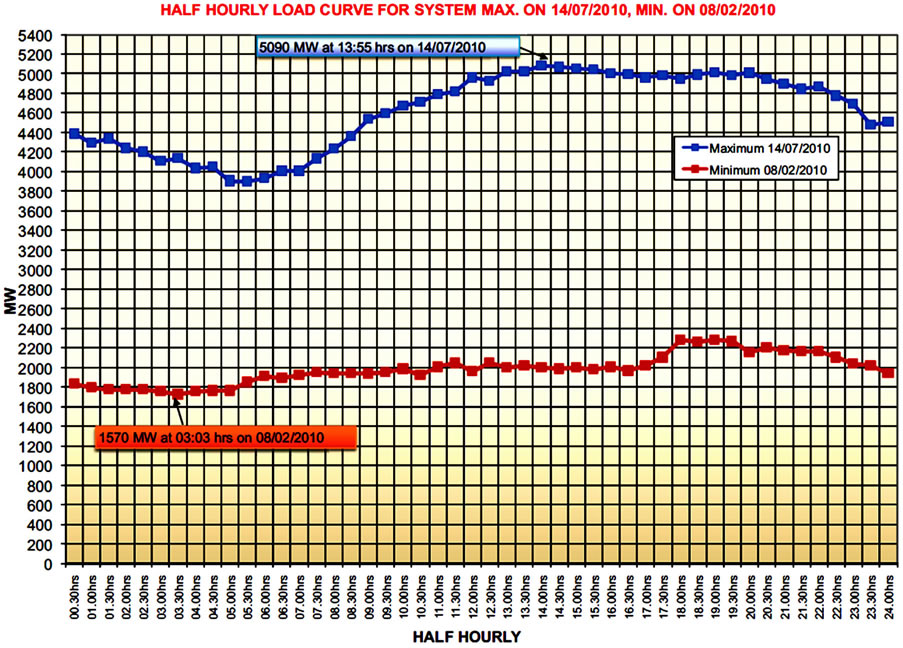
Figure 24. Qatar EP hourly load variation during the days of maximum load and minimum load in year 2010, [8].
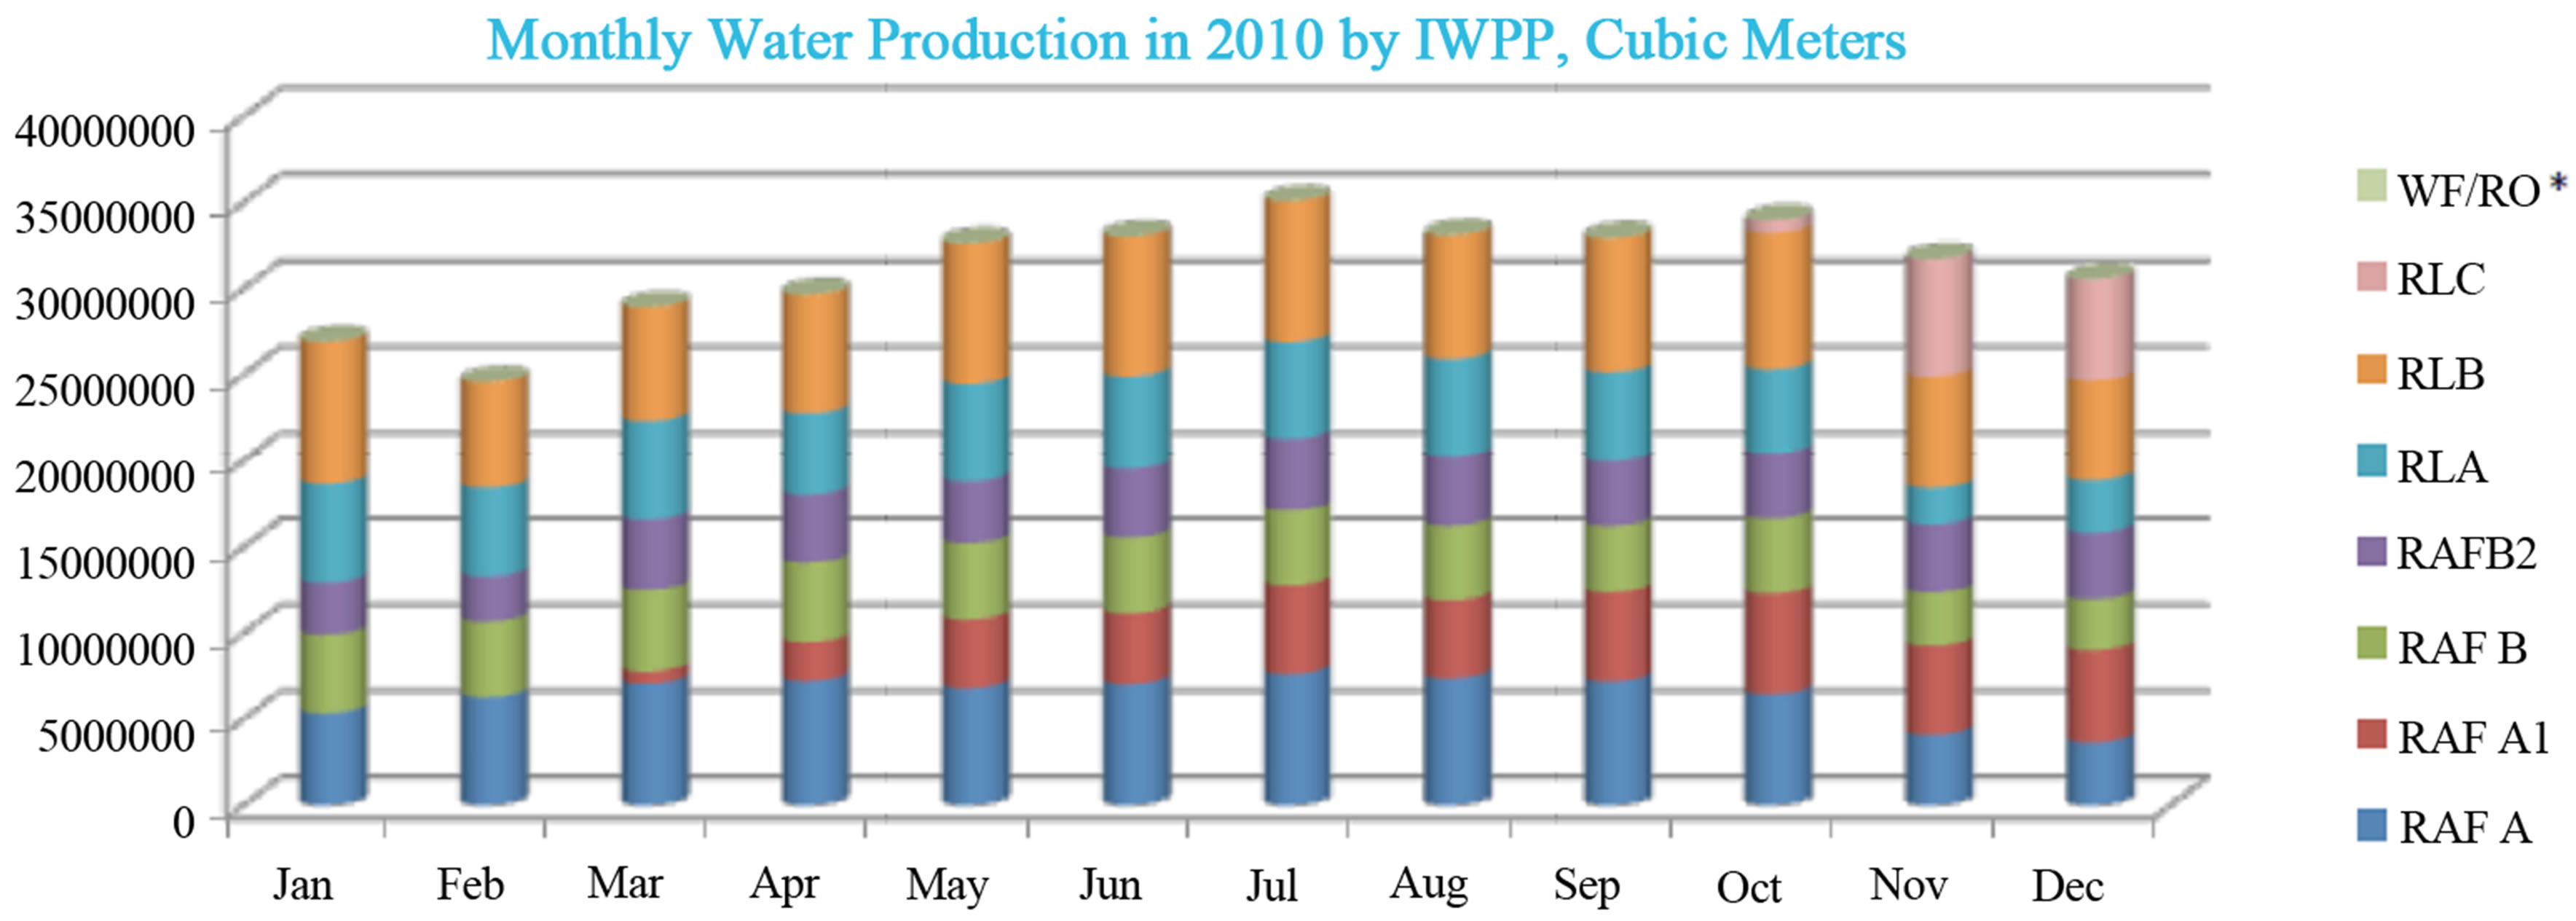
Figure 25. Monthly water production by desalting seawater and brackish (less than 1%) plants, [7].
Each reservoir will be around 200 m in diameter, 12m deep and store 73 million imperial gallons, which is around twice the size of the largest tanks ever built. Now, the storage capacity is sufficient for only two days, [38]. The planned increase in the storage fresh water capacity is shown if Figure 26, [39].
The main advantage of this suggestion is saving the energy consumed for desalting. In the present practice of using MSF desalting system, the average consumed thermal energy is 270 MJ/m3 plus pumping energy of 14.4 MJ/m3 (4 kWh/m3). The total MSF thermal and pumping energies can be expressed by equivalent mechanical energy of 20 kWh/m3. Meanwhile, the SWRO with energy recovery devices (ERD) from the rejected brine consumes only about 5 kWh/m3 pumping energy, or about one fourth of the MSF system. The average daily DW production is more than one Mm3/d; and this can be easily doubled in 7 years, if the annual increase in DW is 7% prevails. Desalting one Mm3 daily by SWRO can save 15 GWh/d, or 5475 GWh/y. This saving can be expressed by saving of fuel energy equal to 65.7 MGJ (62.415 BCF of NG). This is more than 15% of all con-
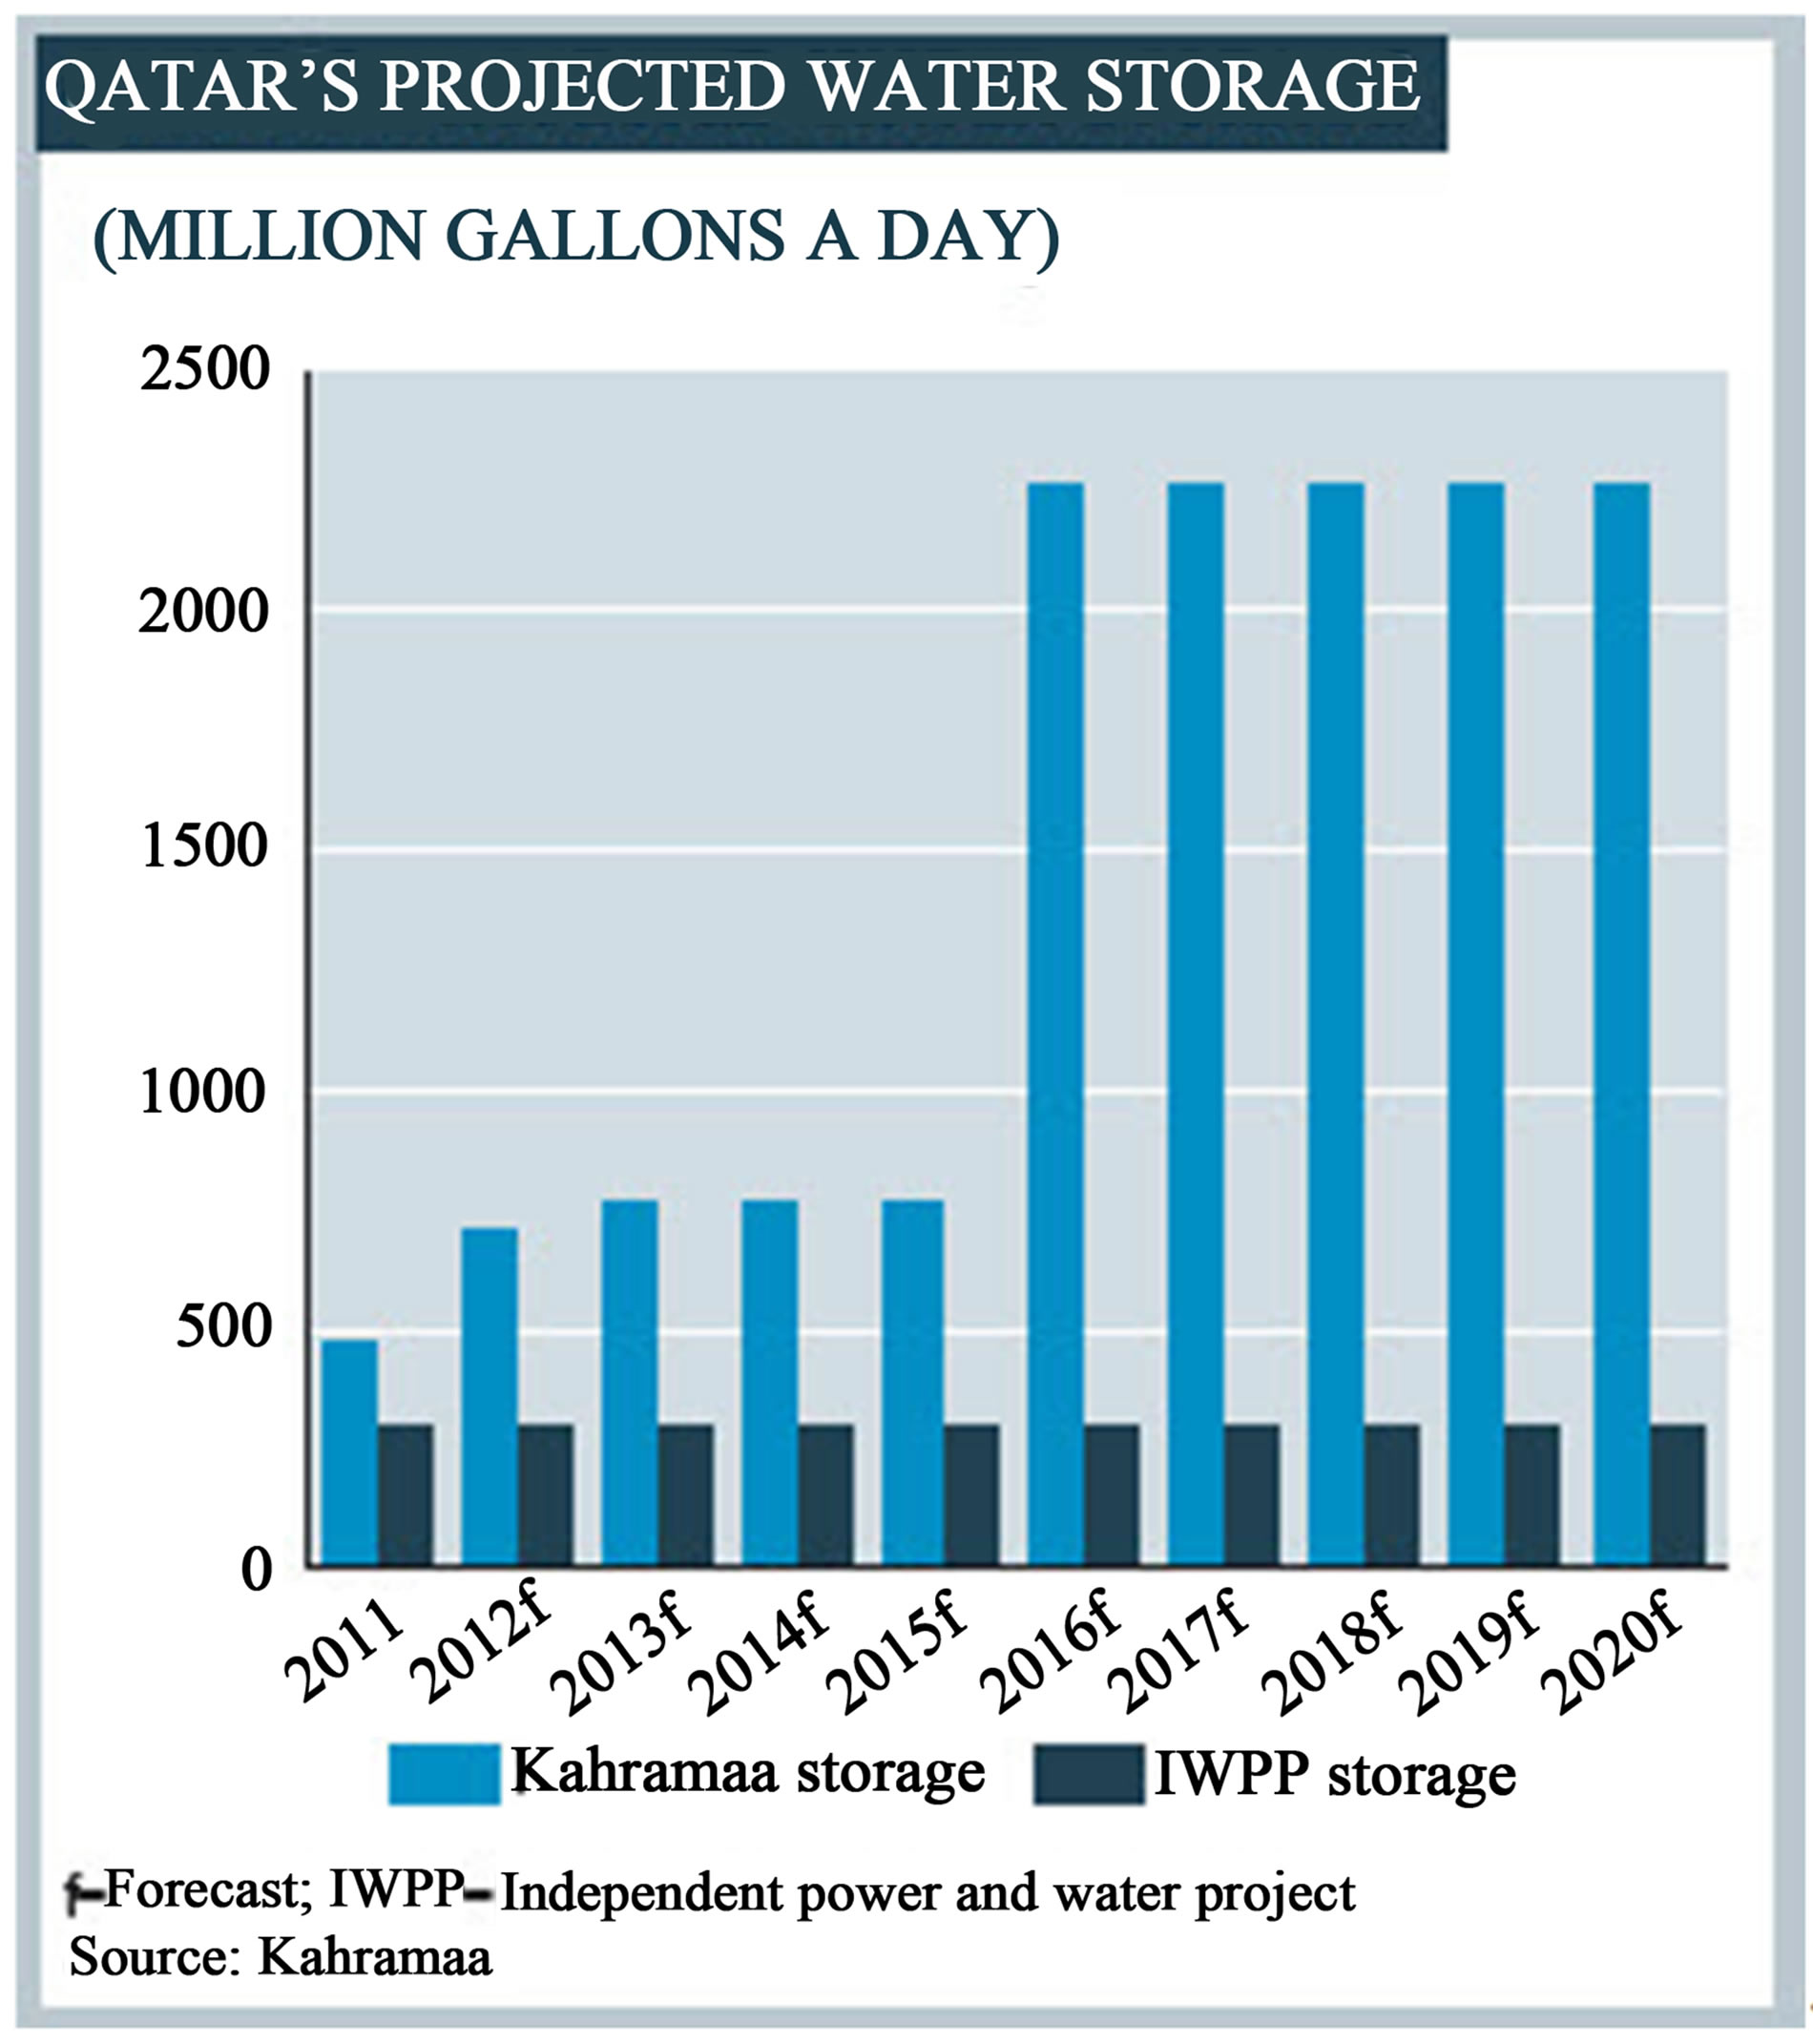
Figure 26. Planned increase in fresh water storage capacity, [39].
sumed fuel energy in 2010, and the corresponding CO2 emission. This also satisfies the needed increase of installed desalted water capacity to face its increasing demand.
7.2. Suggestion 2: Transferring the Simple Gas Turbine to Combined Cycle
This is common and known practice to increase the output of the simple gas turbine (GT) by adding heat recovery steam generator (HRSG) utilizing the heat content of the hot gases leaving the GT. Then steam turbine is added to utilize the steam generated from the HRSG and forming with the GT and the HRSG a combined gas/ steam cycle (GTCC. The added steam turbine produces about 50% of the original GT output, without consumption of additional fuel, and thus can raise their efficiencies from that of simple GT, in the range of 30% - 35%, to that of the GTCC in the range of 45% - 50%.
The objective is to convert the simple GT cycle to a combined cycle plant in order to address the future electricity needs of Qatar, provide additional electrical capacity, utilize existing simple GT infrastructure to reduce environmental impacts and costs, and enhance the reliability of the state’s electrical system by providing power generation near the centers of electrical demand.
The project would include the addition of two heat recovery steam generators, a steam turbine generator, an auxiliary boiler, an air-cooled dry condenser unit, and a 115-kilovolt (kV) electrical switchyard. The proposed project would use existing infrastructure, including the existing natural gas pipeline, water supply pipeline and electric transmission line.
Some major components and features of the proposed project include:
• Addition of two new heat recovery steam generators (HRSG), each receiving the exhaust from one of the existing General Electric Frame 7EA combustion turbine generators (CTGs), and equipped with 324 MMBtu/hr, HHV capacity, natural gas-fired duct burners.
• Addition of a new 85 MMBtu/hr capacity natural gas-fired auxiliary boiler equipped with ultra low NOx burner(s) and 50-foot-tall, 48-inch-diameter stack.
• Addition of new nominal 145 MW (net output) condensing steam turbine generator (STG).
8. Conclusions
Giving the high oil and NG productions in Qatar, energy conservation may look to be unnecessary, and why should the Qatar worry about conserving energy resources? The answer should be that conserve energy is a must. The oil and NG resources are finite, and conservation makes financial sense since their local usage means having less available for export. The UAE turns from NG exporter to importer in 30 years. All the GCC, except Qatar for the time being, are in short of NG used in generating EP due to the EP staggering increase.
Though Qatar’s petroleum production has grown steadily since 2002, Qatar’s fields are maturing, and output at Dukhan—formerly the largest producing field—is in decline. In 2009, Qatar consumed approximately 147,000 bbl/d of petroleum. Although still relatively small compared to total production levels, consumption has more than tripled since 2000. The Electric power generation increased from 19.08 Billion kWh in 2009 to 22.28 Billion kWh in 2010. The CO2 emission increased from 63.62 Mt/y in 2009 to 64.68 Mt/y in 2010.
This paper presents the status of energy (both fuel and EP), and DW productions and consumptions. It shows that energy should be conserved to sustain life in Qatar, and to save its environment from continuous deterioration.
REFERENCES
- “Initial National Communication to the United Nations Framework Convention on Climate Change,” Ministry of Environment, State of Qatar 2010.
- Cia World Factbook and Other Sources, “Qatar Economy,” 2012. http://www.theodora.com/wfbcurrent/qatar/qatar_economy.html
- “The GCC in 2020: Resources for the Future,” A Report from the Economist Intelligence Unit Sponsored by the Qatar Financial Centre Authority. http://graphics.eiu.com/upload/eb/GCC_in_2020_Resources_WEB.pdf
- Qatar, Overview/Data. http://www.eia.gov/countries/country-data.cfm?fips=QA
- BP Statistical Review of World Energy, 2012, bp.com/ Statistical Review. http://www.bp.com/assets/bp_internet/globalbp/globalbp_uk_english/reports_and_publications/statistical_energy_review_2011/STAGING/local_assets/pdf/statistical_review_of_world_energy_full_report_2012.pdf
- G. Sarraf, W. Fayad, T. El Sayed and S.-P. Monette, “Unlocking the Potential of District Cooling, The Need for GCC Governments to Take Action,” Booz & Company, New York. http://www.booz.com/me/home/thought_leadership_strategy/40007409/40007869/50737873
- Qatar Weather Averages. http://www.worldweatheronline.com/Doha-weather-averages/Ad-Dawhah/QA.aspx
- Qatar General Electricity and Water Corp, (KAHRAMAA) Statistical Yearbooks 2007, 2008, and 2010.
- Annual Statistical Report 2010, Organization of Arab Petroleum Exporting Countries (OAPEC).
- Personal Communication with Dr. Youssef El Gendy from KAHRAMAA.
- QATAR—The Power Sector. http://www.thefreelibrary.com/QATAR+-+The+Power+Sector.-a0265495758
- Hitachi Combustion Turbines. http://www.hitachipowersystems.us/products/combustion_turbines/index.html
- A. S. Al Malki, “Business Opportunities in Water Industry in Qatar”. http://www.siww.com.sg/pdf/Biz_Opps_in_Water_Industry_in_Qatar.pdf
- A. O. B. Amer, “Development and Optimization of METVC Desalination System,” Desalination, Vol. 249, No. 3, 2009, pp. 1315-1331. http://dx.doi.org/10.1016/j.desal.2009.06.026
- A. A. Alsairafi, I. H. Al-Shehaima and M. Darwish, “Efficiency Improvement and Exergy Destruction Reduction by Combining a Power and a Multi-Effect Boiling Desalination Plant,” Journal of Engineering Research, Vol. 1, No. 1, 2013, pp. 289-315.
- Ras Abo Fontas B1. http://globalenergyobservatory.org/geoid/5020
- Ras Abu Fontas “B” Power and Desalination Plant. http://midmac.net/projects_details.asp?project_id=12&cat_id=9
- Ras Abu Fontas B-2. http://globalenergyobservatory.org/geoid/5021
- Ras Abu Fontas A1. http://www.impregilo.it/public/impregilo/en/engineering_key_current_projects.php?s=&d=&p=367
- Ras Abu Fontas Power Station. http://www.panoramio.com/photo/1922664
- RasLaffan A. http://globalenergyobservatory.org/geoid/5022
- RasLaffan B. http://globalenergyobservatory.org/geoid/5023
- RasLaffan C. http://globalenergyobservatory.org/geoid/42860
- Mesaieed CCGT Power Plant. http://globalenergyobservatory.org/geoid/42859
- MED/TVC Desalination Plant Inaugurated in Qatar. http://www.desalination.biz/news/news_story.asp?id=5939&title=MED/TVC+desalination+plant+inaugurated+in+Qatar
- RasQatras Energy Plant. http://en.wikipedia.org/wiki/Ras_Qartas_Energy_Plant
- Mesaieed Power Plant. MPCL-IBERDOLA INGENIERIA & CONSTRUCCION (Mesaieed). http://wikimapia.org/13712833/Mesaieed-Power-Plant-MPCL-IBERDOLA-INGENIERIA-CONSTRUCCION
- Tri-Tech Infrastructure LLC, the Chinese company’s US Subsidiary, Was Awarded a US$8.3 Million Contract for the Seawater Desalination Unit for the Utility Plant of Qatar Petrochemical Co. Ltd. (QAPCO) at Mesaieed Industrial City in Doha. http://www.desalination.biz/news/news_story.asp?id=6254&title=Qatar+MED%2FTC+desalination+plant+goes+to+Tri-Tech
- Qatar Population Surpassed 1.9 Million. http://dohanews.co/post/42188848936/qatars-population-surpasses-1-9-million-three-years
- M. A. Darwish, et al., “Technical and Economical Comparison between Large Capacity Multi Stage Flash and Reverse Osmosis Desalting Plants,” Desalination, Vol. 72, No. 3, 1989, pp. 367-379. http://dx.doi.org/10.1016/0011-9164(89)80018-9
- J. Jiang, “The Price of Electricity in your State,” Planet Money. http://www.npr.org/blogs/money/2011/10/27/141766341/the-price-of-electricity-in-your-state
- “Seawater Desalination Power Consumption,” White Paper, Water Reuse Association, 2011. http://www.watereuse.org/sites/default/files/u8/Power_consumption_white_paper.pdf
- J. Tonner, “Desalination Trends,” Water Consultants International. Siteresources.worldbank.org EXTWAT/Resources/4602122-1213366294492/5106220-1213366309673/6.2JohnTonner_PPT_Desalination_Trends.pdf
- Water Desalination Using Renewable Energy, Technology Brief, International Renewable Energy Agency, IRENA. http://search.fastaddressbar.com/web.php?s=Water+Desalination+Using+Renewable+Energy%2C+Technology+Brief&fid=65017
- Qatar to Get Solar-Powered Desalination Plant, 2012. http://thepeninsulaqatar.com/qatar/216388-qatar-to-get-solar-powered-desalination-plant.htmlsiteresources.worldbank.org/EXTWAT/Resources/4602122-1213366294492/5106220-1213366309673/6.2JohnTonner_PPT_Desalination_Trends.pdf
- “CO2 Emissions (Metric Tons per Capita),” The World Bank. http://data.worldbank.org/indicator/EN.ATM.CO2E.PC
- “Electric Power Consumption (kWh per Capita),” The World Bank Data. http://data.worldbank.org/indicator/EG.USE.ELEC.KH.PC
- C. McElroy, “Quenching Qatar’s Thirst,” Construction Week on line.com, by Cathal McElroy on April 7, 2012. http://www.constructionweekonline.com/article-16307-quenching-qatars-thirst/1/
- Verity Ratcliffe Doha Shifts Focus to Water Security, Issue 2, 13-19 January 2012. http://www.agentschapnl.nl/sites/default/files/bijlagen/MEED%20-%20Doha%20shifts%20focus%20to%20water%20security.pdf