Advances in Remote Sensing
Vol.2 No.2(2013), Article ID:32767,6 pages DOI:10.4236/ars.2013.22010
Detection of Fronts from Ocean Colour Monitor Images Using Entropic Technique: A Case Study of Mesoand Micro-Scale Chlorophyll Mapping in Bay of Bengal, India
1Cobb County Government, Marietta, USA
2Department of Earth Sciences, Indian Institute of Technology, Mumbai, India
Email: *ramakrish@iitb.ac.in
Copyright © 2013 R. Vinuchandran, D. Ramakrishnan. This is an open access article distributed under the Creative Commons Attribution License, which permits unrestricted use, distribution, and reproduction in any medium, provided the original work is properly cited.
Received February 4, 2013; revised March 6, 2013; accepted March 14, 2013
Keywords: Ocean Colour Monitor; Edge Detection; Jhensen-Shannon Divergence
ABSTRACT
This paper discusses a robust technique using entropy-based detection for delineating edges in ocean colour images. The detection process relies on Jhensen-Shannon divergence based image segmentation, which has been found to be the most suitable for noisy ocean colour images. In the attempted technique, partial removal of the noise in the images is performed and the edges are detected using entropic method. In our approach, Jhensen-Shannon divergence for the images is calculated, and the divergence image is arrived at after applying an appropriate threshold and filter to estimate the gradients. An attempted case study on retrieving chlorophyll front edges using this technique indicates that entropic method is far superior to conventional edge-enhancement tools, in terms of its insensitivity to impulsive noises and, capability in detecting mesoand micro-scale changes. This procedure would largely decrease the ambiguities associated with the ocean colour edges and hence has promising application potential in targeting fishing zones, sediment dispersion modeling and climate related studies.
1. Introduction
Study of ocean colour fronts is important for various oceanographic applications like climate change, carbon cycle, algal blooms, and sediment dispersion-related studies. Chlorophyll and suspended sediment fronts in the open ocean vary from small-scale features to very large scale eddies and meanders. The edges of these features show gradients that are of practical importance in the above-mentioned applications. Sometimes these features are also indicators of different water masses. In case of chlorophyll, gradients of ocean colour features can be very strong and sharp during the growth phase of phytoplankton or diffused when the phytoplanktons are in the decaying phase. Many of the current satellites monitoring the oceans are capable of measuring chlorophyll and sediment concentration. For many of the applications including Potential Fishing Zone (PFZ) forecasts, the analyst derives the ocean colour fronts manually from the chlorophyll maps. This is mainly because automatic detection of edges by using generic algorithms yields many false edges resulting from noise. Ocean colour sensors measure the top of atmosphere radiance (TOA) in which a major contribution of the radiance measured is from the atmosphere. The chlorophyll signals are separated from strong signals from the atmosphere by the process of atmospheric correction, and this often results in a noisy image. Conventional noise-reduction techniques often smoothen out the image and hamper the estimation of edges and ocean colour parameters. For statistical and continuous observation and extraction of ocean colour fronts, precise and automatic edge detection techniques are of immense significance. Statistical methods of edge detection not only help in delineating the edges more accurately but also detect edges with weak gradients which otherwise cannot be resolved visually. Moreover, manually derived edges are highly subjective, and cannot be used for comparison with other temporal data and outputs from different researchers. Computer-assisted data processing for edge detection reduces the effort in routine analysis of edges and in processing huge volumes of data.
Besides the chlorophyll-related applications, ocean colour fronts are also of importance from climatological as well as oceanographic point of view. Synergistic analysis of ocean colour and Sea Surface Temperature (SST) gradients helps in studying various oceanographic phenomena related to circulation and water masses. It also helps in understanding the highly productive zones in the oceans. Phytoplankton in the ocean plays a major role in the global carbon cycle and oceanic productivity. Demarcating and matching the edges between SST and chlorophyll images helps in understanding the relevance of these two important biophysical parameters towards primary and secondary productivity. Edge detection using many statistical techniques such as Laplacian [1], Sobel [2] and Prewitt [3] has been used earlier for detecting SST fronts. While these derivative-based techniques are easy to code and use, they are very sensitive to impulsive noise [4]. Although significant improvements in algorithm development on noise insensitive edge detection at macro-scales (>10 km2) have been made [5-7] there are still noise related issues to be addressed while detecting the edges associated with meso (1 - 10 km2) and micro-scale (<1 km2) features. Thus, an ideal edge detector should not only resist the impulsive noise, at different scales, present in the satellite imagery [8] but also find the edges at mesoand micro-scales. In case of ocean colour images, this characteristic is very essential for meaningful retrieval of several physical (sediment load, density, SST) and biological parameters (chlorophyll concentration) that are used in estimation of primary and secondary productivity. In this study, we demonstrate a divergence-based approach for delineating meso-, microscale ocean colour features in chlorophyll images obtained from Ocean Colour Monitor (OCM).
2. Data and Methodology
In this study, chlorophyll images from OCM onboard IRS-P4 satellite covering north-west Bay of Bengal is used (Figure 1). OCM sensor has eight bands spanning from 402 nm to 885 nm, with 360 m spatial resolution. The satellite data were atmospherically corrected by single scattering approach [9].
In Case-1 waters, ocean colour is determined primarily by variability in abundance of phytoplankton and their associated pigments. The most dominant pigment is chlorophyll-a, which is used by the phytoplankton to absorb light energy. Hence, chlorophyll-a is one of the essential parameters for ocean colour frontal studies. This pigment has two wavelength peaks of absorption (440 nm and 665 nm). Bands 3 and 5 (440 and 555 nm respectively) are commonly used for the computation of chlorophyll concentration [10-12]. In this study, after correcting the OCM data for atmospheric interferencesreflectance values for each band was calculated following the procedures described by Mohan et al. (1998). Chlorophyll concentrations for each image were then calculated using Ocean Colour-2 (OC2) empirical algorithm [12]. This algorithm (Equation (1)) operates with five coefficients.
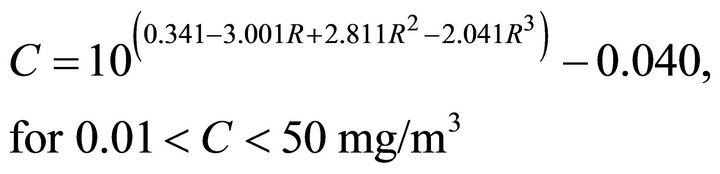 (1)
(1)
where,  chlorophyll concentration in mg/m3
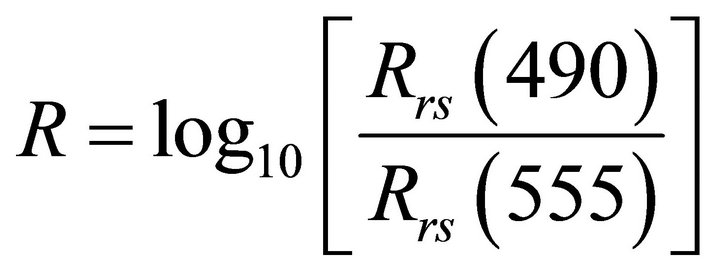
where, Rrs (W) is the remote sensing reflectance at 490 and 555 nm wavelengths.
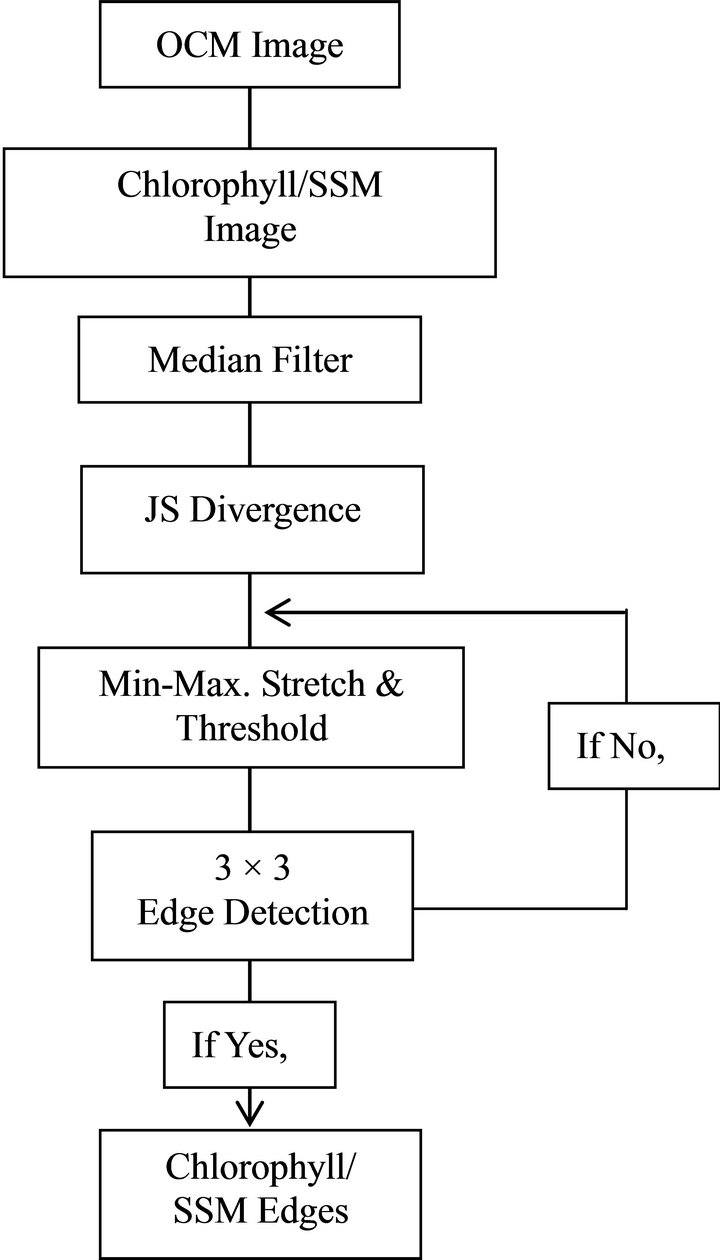
The Chlorophyll image thus derived is subjected to entropy-based edge detection technique for estimating the gradients at mesoand micro-scales. It is based on the Jensen-Shannon divergence between histograms provided by a sliding window over an image. This technique provides clean boundary line between two homogeneous fields of chlorophyll concentration. The workflow details of image processing are given below:
Jensen-Shannon divergence [13,14] concept is used in the present study since it is highly resistant to noise. It is a measure of the cohesion of a set of probability distributions having the same number of probability realizations. Jensen-Shannon (JS) divergence is mathematically represented in Equation (2).

Figure 1. Filter windows used for computing the JensenShannon divergence in the ocean colour images. Each 20 × 10 window is divided into equal-sized adjacent 10 × 10 subwindows. Four different window orientations as shown in the figure are used to compute edges oriented in the four possible directions viz. vertical (a), horizontal (b) and two diagonals ((c) & (d)). Divergence values were written to the output image on the location of the grey pixel.
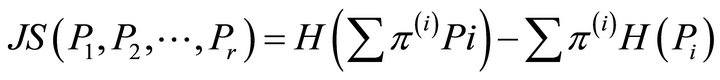 (2)
(2)
where  are discrete probability distributions (in image processing context, these are the normalized histograms). π(i) is the distribution weight.
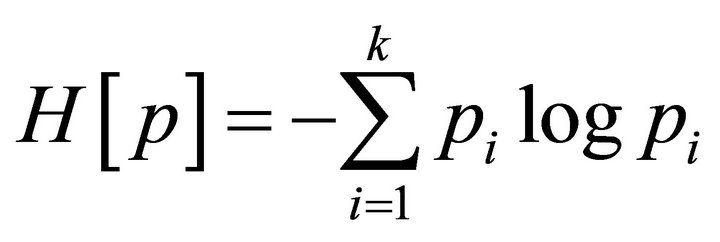
 is the Shannon entropy for the distribution pi.
 measures the diversity of events distributed in p.
 is zero only for degenerate distributions (one sure event), is maximum for the uniform distribution (equiprobable events) and hence, this algorithm is very resistant to impulsive noise. For the noisy chlorophyll images that have a wide range of values, filter windows need to be designed and sized appropriately. The output divergence map is then filtered preserving the frontal features to delineate the edges.
Divergence at different locations of the image was calculated using sliding windows. Geometrically, within a small window, edges may be aligned in four directions viz. vertical, horizontal or of the two diagonals (Figures 1(a)-(d)). A 20 × 10 window (W) is divided in to two 10 × 10 windows (w1 and w2) as shown in Figure 1. Thus the distribution weights are equal . Out of several attempted combinations, the 10 × 10-window size was found to be very effective in suppressing the noise and delineating large-scale features. Four such filter windows to detect different edge orientations mentioned earlier were designed to calculate the maximum diversity for the four directions. The normalized histograms p1 and p2 for each of the sub-windows were calculated for the image values. When the windows are slide over the edge, JS becomes maximum when the middle of the window is aligned over the edge, and each sub-window lies completely within one texture. Hence, one of the four windows gives the maximum JS value for a particular position. Matrices of JS from all the four window orientations were calculated separately, and the maximum value was assigned to the pixel in the final diversity map. Depending upon the size of the target feature (micro-/meso-/macro-scale features) of interest, an appropriate threshold value needs to be applied on the diversity map. In this study, a threshold value of 6 was arrived to detect a meso-scale feature of 10 by 10 pixels dimension. Subsequent to this, a majority filter and a 3 × 3 non-directional edge detection kernel were applied (over the diversity image) to smoothen the output, and arrive at the edges of meso-scale features. By increasing or decreasing the threshold value, detection of large scale or small-scale edges can be achieved.
3. Results
It is often very difficult to discern the gradients of oceanic parameters such as chlorophyll, sediment-load concentrations, and surface temperature directly from the processed images (Figures 2(a) and (b)). This is mainly attributed to presence of impulsive noises that degrade the edges associated with the gradient changes. In this study, two IRS P4 OCM-derived chlorophyll images, for the periods January and April 2001 with typical macro-, mesoand micro scale chlorophyll bloom features were used to delineate the gradients (Figures 3(a) and (b)) by JS entropy technique. To evaluate the efficacy of this method in delineating the gradients, attempt is herein also made to compare the edges derived from other conventional gradient-enhancement filters such as Kirschnon directional, Prewit and Sobel filters for a meso-scale chlorophyll front (Figures 4(a)-(c)). The studied chlorophyll feature (86˚E and 19˚20'N) has a typical gradient of 0.44 mg/m3/km near the edge and spread across 40 pixels (20 kms) with a maximum concentration of 0.74 mg/m3 in the centre. The Prewitt and Sobel filters could not effectively detect the edges. The Kirsch-non directional (Figure 4(a)) portrays the gradient changes but could not detect the outer edges with lower concentration of chlorophyll. Resultantly, the spatial extent representing the chlorophyll bloom is under estimated. Where as, the JS divergence-based approach prominently brings out the edges at both meso and micro scales due to diagnostic changes in divergence values. Overlay of edges derived using JS divergence on the Kirsch-non directional edge enhanced images (Figures 5(a) and (b)) indicates that the JS is much sensitive to the changes in gradients and
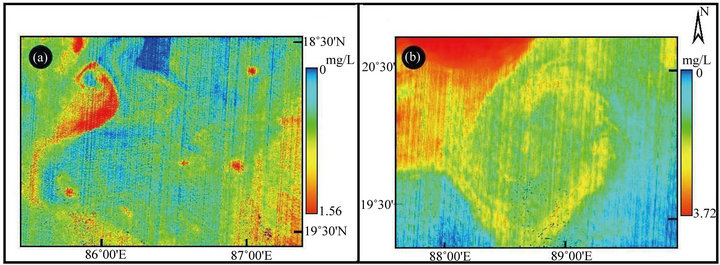
Figure 2. Pseudocolour-coded chlorophyll images for the period January (a), and April (b), 2001.
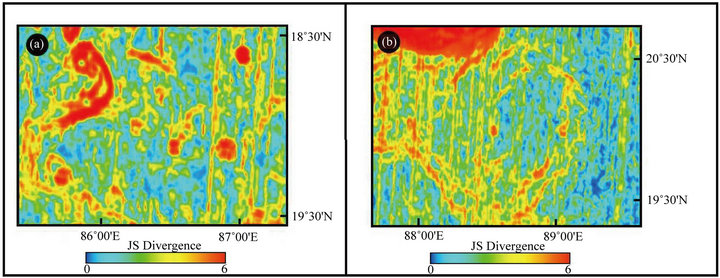
Figure 3. (a) & (b) Pseudocolour-coded JS divergence images depicting the micro, meso and macro scale chlorophyll features and associated edges.
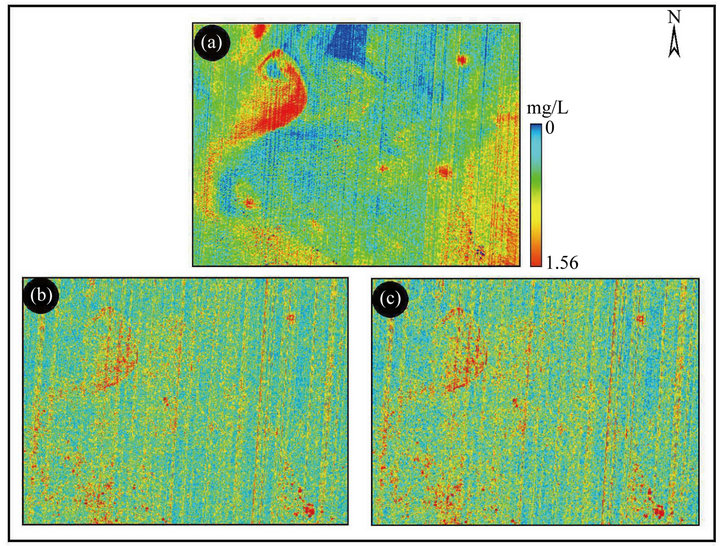
Figure 4. Pseudocolour-coded images of (a) Kirsch-non directional; (b) Prewit and; (c) Sobel filter enhanced images with noisy chlorophyll features and associated edges.
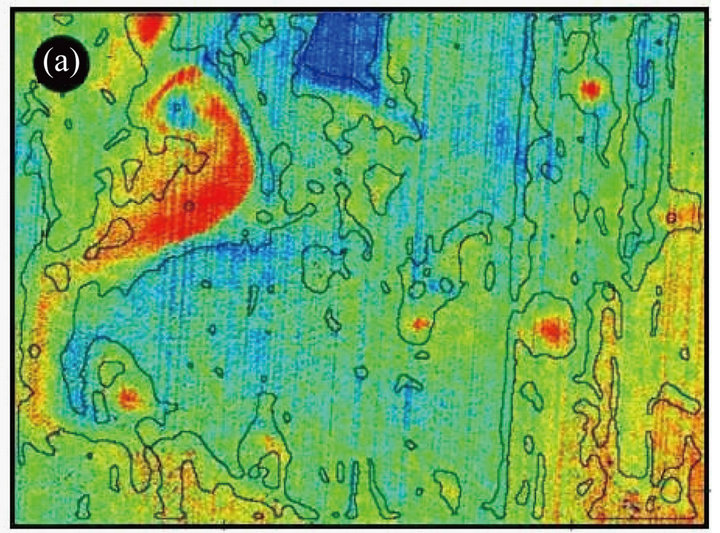
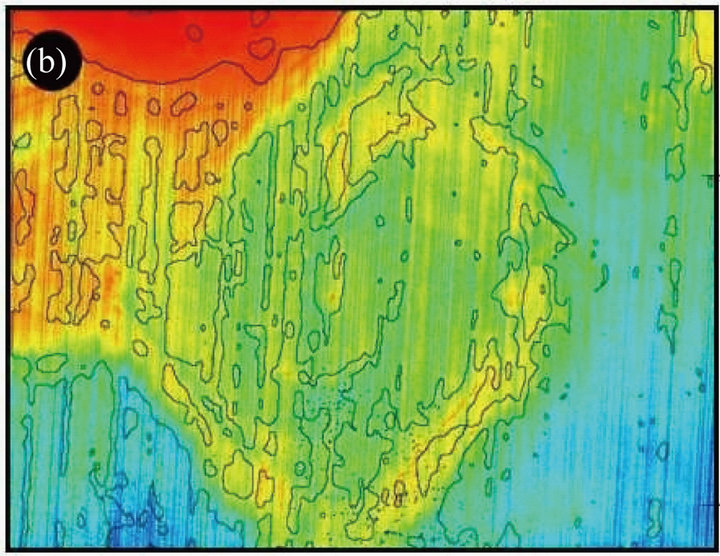
Figure 5. Overlay of edges derived using JS divergence on kirsch-non directional edge enhanced pseudo colour image.
hence, could detect outer edges effectively. This property of JS divergence permitted delineating several mesoand micro-scale bloom features, which could not be detected by other methods. Since this study involved coarse spatial resolution satellite images, we selected a coarse window of  pixel size for estimating the JS divergence. However, for high resolution images, the window size can be narrowed down. Validating the chlorophyll fronts identified in this study by way of J-S divergence require simultaneous fieldand satellitemeasurements. This is often impractical. However, based on the prevailing works at laboratory [15,16] and field scales [17,18] it is apparent that the adopted methodology is superior to other procedures in detecting the edges based on gradient changes.
4. Discussion and Conclusions
The conventional methods for edge detection are based on the first and second order derivatives or differences of gray levels of the pixels of image such as the gradientand Laplacian-operators [19]. Variants of such gradient operators include Roberts, Prewitt and Sobel filters which use 2D spatial convolution masks to approximate the first-order derivative of an image. The detected edges by gradient operators are thick and are not suitable for many applications like chlorophyll-, sediment front-detection. Further, these filters fail to detect the outer most contour of an object or feature. But, the Shannon entropy is the most important among several measures of information and this property permits the extraction of edges on the borders between different homogenous areas. Since entropy measures the randomness of intensity distribution, the value of entropy is low for homogenous areas and is high where the diversity of gray level of pixels is large [20].This property enabled to discriminate the edges of even minor chlorophyll features effectively (Figures 5(a) and (b)). Though Laplacian edge detector (a second derivative filter) is widely used in many image processing applications, in this study, we observed that the J-S divergence based approach is advantageous. This is attributed to high sensitivity of Laplacian filter to noises in the image. Further, the magnitude of the Laplacian produces double edges which are an undesirable effect in image segmentation [21].
It is evident from our study that JS divergence based approach effectively demarcates gradual and sudden changes in chlorophyll concentrations over a large area by suppressing the spurious changes associated with noise. This property of JS divergence is of critical importance in precisely demarcating the spatial extent of chlorophyll, Suspended Sediment Concentrations (SSC) and Sea Surface Temperature (SST) fronts for modeling and forecasting.
REFERENCES
- C. R. Savage, R. J. Petrell and T. P. Neyfeld, “Underwater Fish Video Images: Image Quality and Edge Detection Techniques,” Canadian Agricultural Engineering, Vol. 36, No. 3, 1994, pp. 175-183.
- D. Sauter and L. Parson, “Spatial Filtering for Speckle Reduction Contrast Enhancement, and Texture Analysis of GLORIA Images,” IEEE Journal of Oceanic Engineering, Vol. 19, No. 4, 1994, pp. 563-576. doi:10.1109/48.338392
- M. F. Janowitz, “Automatic Detection of Gulf Stream Rings,” Office of Naval Research Technical Report, Massachusetts University, Amherst, 1985.
- T. Shimada, F. Sakaida, H. Kawamura and T. Okumura, “Application of an Edge Detection Method to Satellite Images for Distinguishing Sea Surface Temperature Fronts Near the Japanese Coast,” Remote Sensing of Environment, Vol. 98, No. 1, 2005, pp. 21-34. doi:10.1016/j.rse.2005.05.018
- S. Mallat and S. Zhong, “Characterization of Signals from Multiscale Edges,” IEEE Transactions on Pattern Analysis and Machine Intelligence, Vol. 14, No. 7, 1992, pp. 701-732. doi:10.1109/34.142909
- F. Song and S. Jutamulia, “New Wavelet Transforms for Noise-Insensitive Edge Detection,” Optical Engineering, Vol. 41, No. 1, 2002, pp. 50-54. doi:10.1117/1.1424877
- C.-P. Huang and R.-Z. Wang, “An Integrated Edge Detection Method Using Mathematical Morphology,” Pattern Recognition and Image Analysis, Vol. 16, No. 3, 2006, pp. 406-412. doi:10.1134/S1054661806030102
- D. P. Vazques and C. Atae-Allah, “Entropic Approach to Edge Detection for SST Images,” Journal of Atmospheric and Oceanic Technology, Vol. 16, No. 7, 1998, pp. 970- 979. doi:10.1175/1520-0426(1999)016<0970:EATEDF>2.0.CO;2
- M. Mohan, P. Chauhan, A. Mathur and R. M. Dwivedi, “Atmospheric Correction of MOS-B Data Using Long Wavelength and PCI Based Approaches, IRS-P3 MOS Validation Experiment: Ocean Applications,” Space Application Centre, Ahmedabad, 1998, pp. 14-22.
- P. Chauhan, M. Mohan, R. K. Sarangi, B. Kumari and S. Nayak, “Surface Chlorophyll-a Estimation in the Bay of Bengal Using IRS-P4 Ocean Colour Monitor (OCM) Satellite Data,” International Journal of Remote Sensing, Vol. 23, No. 8, 2002, pp. 1663-1676. doi:10.1080/01431160110075866
- P. Cipollini, G. Corsini, M. Diani and R. Grasso, “Retrieval of Sea Water Optically Active Parameters from Hyperspectral Data by Means of Generalized Radial Basis Function Neural Networks,” IEEE Transactions on Geoscience and Remote Sensing, Vol. 39, No. 7, 2001, pp. 1508-1524. doi:10.1109/36.934081
- J. E. O’Reilly, S. Maritorena, B. G. Mitchell, D. A. Scigal, K. L. Carder, S. A. Graver, M. Kahru and C. R. McClain, “Ocean Colour Chlorophyll Algorithms for SeaWiFS,” Journal of Geophysical Research, Vol. 103, No. C11, 1998, pp. 24937-24953.
- J. Lin, “Divergence Measures Based on the Shannon Entropy,” IEEE Transactions on Information Theory, Vol. 37, No. 1, 1991, pp. 145-150. doi:10.1109/18.61115
- L. V. Barranco, P. E. Luque, J. A. Martinea and R. R. Roldan, “Entropic Texture-Edge Detection for Image Segmentation,” Electronics Letters, Vol. 31, No. 1, 1995, pp. 867-869. doi:10.1049/el:19950598
- B. Singh and A. P. Singh, “Edge Detection in Grey Level Images Based on the Shanon Entropy,” Journal of Computer Science, Vol. 4, No. 3, 2008, pp. 186-191. doi:10.3844/jcssp.2008.186.191
- M. A. El-Sayed and T. A. Hafeez, “New Edge Detection Technique Based on the Shannon Entropy in Grey Level Images,” International Journal on Computer Science and Engineering, Vol. 3, No. 6, 2011, pp. 2224-2232.
- V. B. Lopez, P. L. Escamilla, J. M. Aroza and R. R. Roldan, “Entropic Texture-Edge Detection for Image Segmentation,” IEEE Electronic Letters, Vol. 31, No. 11, 1995, pp. 867-869. doi:10.1049/el:19950598
- J. F. Gomez-Lopera, J. M. Aeoza and A. M. Perez, “An Analysis of Edge Detection by Using the Jensen-Shannon Divergence,” Journal of Mathematical Imaging and Vision, Vol. 13, No. 1, 2000, pp. 35-56. doi:10.1023/A:1008325607354
- M. Wang and S. Y. Yuan, “A Hybrid Genetic Algorithm based Edge Detection Method for SAR Image,” IEEE Proceedings of the Radar Conference, Arlington, 9-12 May 2005, pp. 503-506.
- A. E. Hassanien, “Fuzzy Rough Sets Hybrid Scheme for Breast Cancer Detection,” Image and Vision Computing, Vol. 25, No. 2, 2007, pp. 172-183. doi:10.1016/j.imavis.2006.01.026
- R. Zhang, G. Zhao and S. Li, “A New Edge Detection Method in Image Processing,” IEEE Proceedings of the Communications and Information Technology, Arlington, 12-14 October 2005, pp. 445-448.
NOTES
*Corresponding author.