American Journal of Plant Sciences
Vol.4 No.5A(2013), Article ID:32249,11 pages DOI:10.4236/ajps.2013.45A005
Seeds as a Source of Carbon, Nitrogen, and Phosphorus for Seedling Establishment in Temperate Regions: A Synthesis

Department of Environment and Agriculture, Curtin University, Perth, Australia.
Email: *b.lamont@curtin.edu.au
Copyright © 2013 Byron B. Lamont, Philip K. Groom. This is an open access article distributed under the Creative Commons Attribution License, which permits unrestricted use, distribution, and reproduction in any medium, provided the original work is properly cited.
Received February 25th, 2013; revised March 15th, 2013; accepted April 1st, 2013
Keywords: Cotyledons; Drought-Avoidance; Nutrient Transport; Photosynthesis; Root Elongation; Seed Mass; Seed Nutrient Content; Seedling Growth
ABSTRACT
Seeds are a source of organic (carbon, C) and mineral (nitrogen, N and phosphorus, P) nutrients for the growing seedling. There is much information on seed mass and N and P contents, and the relationship between these and seedling mass. Within the world’s temperate regions, these collectively show that N and P concentrations remain constant or rise with increase in seed mass and that seeds are larger and more nutrient-enriched in poorer soils. Seed N and P were more important than seed C in accounting for seedling mass in 85% of studies we assessed. In nutrientand water-limited environments that are not light-limited, large seeds routinely provision the seedling with N and P that enhance C-fixation and thus general growth in the first wet season. This system is so efficient that growth response to soil nutrients may be negligible in first-year seedlings arising from seeds > 15 mg mass, N content > 5 mg and P content > 1.6 mg. The elongating taproot system absorbs nutrients and maintains water uptake as soil water retreats, enhancing the chances of survival in the first dry season. We outline an interpretative scenario for the special role of large seeds (>15 mg) in nutrientand water-limited environments that recognizes the critical role of N and P for photosynthesis in ensuring sufficient C-supply to the rapidly descending roots for effective drought-avoidance by the young plant.
1. Introduction
Seeds contain organic and mineral nutrients for nurturing the young seedling. Prior to becoming photosynthetic and developing root hairs all the nutrient requirements for the germinant must be met from seed stores, but in resource-limited environments this role can be expected to continue well into the first growing season. Organic nutrients (C compounds) can be used for immediate growth needs (where light is limiting), while mineral nutrients provide essential cofactors for photosynthesis and respiration for subsequent growth (where soil nutrients are limiting). In addition, the cotyledons of many germinants are carried aloft, expand, become green and can photosynthesise. This process can supplement stored carbohydrate supply to the young seedling but usually makes little contribution compared with photosynthesis by the new shoot [1-3]. In temperate climates, light is rarely limiting but nutrient and water supply are, so that photosynthesis is still suboptimal for growth. Thus it can be expected that seeds will serve as a source of mineral nutrients that will supplement early soil supply, enhancing shoot (light acquisition) and thus root (nutrient and water acquisition) growth and increasing the chance of successful establishment in the first year.
If stored minerals are critical for seedling establishment, then as seed size (mass) increases, mineral content should rise proportionately. If stored minerals are more important than seed mass, then mineral content should rise exponentially. It follows that seed-stored mineral concentration should be as high, or higher, in the more nutrient and water-impoverished regions. Here, we outline technical issues of quantifying seed nutrient content, seedling nutrient transport and utilization, and appropriate statistical analyses. We examine the relationship between seed mass (as an index of C) and seed nitrogen (N) and phosphorus (P) content in a world survey of temperate climate species. We then review experiments on the contribution of these three seed-based resources to seedling growth, and compare their relative importance on seedling growth and survival. Finally, we outline an adaptive scenario for large seeds on seedling growth in nutrientand water-limited environments.
2. Quantifying Seed Nutrient Content, Transport and Utilization
Diaspores are considered seeds when they are the dispersal unit and comprise one embryo and protective coat including appendages. Air-dry seeds may contain as much as 20% water when fresh but most dry to 1% - 5% moisture over time. Air-dry seeds are usually used when comparing seed sizes, but oven-dry when determining nutrient concentrations. Most oven-dry (60˚C - 70˚C for 24 h) seeds comprise >95% organic and <5% mineral nutrients, though N and P alone can reach 12.4% and 2.5% in some species on nutrient-impoverished soils [4]. The organic component of seeds is made up of units of CH2O (and sometimes CHO for those that store fats and oils), so that seed mass is a good index of plant investment in seed C. Not all stored nutrients are available for transferring to the germinant/seedling as the seed coat accounts for <1% - 82% of seed mass and <1% - 12% of N and P contents [5,6] and this is not remobilizable. Recyclable nutrients are stored in the endosperm (often absorbed by the cotyledons during maturation) and cotyledons (~95%), and embryo axis (~5%). Thus, the seed coat is omitted in some functional studies. Nevertheless, there is an argument for including whole seed nutrient content when examining the extent to which it correlates with seedling growth, especially as the fraction actually transported to the seedling is smaller again and depends greatly on the type of nutrient and growing conditions. In fact, there are many instances of a net gain in mass and sometimes even nutrient content of the cotyledons during seedling growth [7,8].
There are several techniques for gauging the contribution of seed resources to seedling growth. One is to compare seed nutrient content (including seed coat) at the start and end of the experiment. Another is to remove the storage tissues soon after germination and compare nutrient content of control seedlings (with remnants of the seed removed at the end) with that of the minus-storage-tissue seedlings. As a cross-check, nutrient content of the parts removed at both stages should be included. If not grown in an inert medium with distilled water the technique may also be used to compare the contribution of the rooting medium and seed to seedling mineral content [3]. This indicates the extent of nutrient transfer between seed and seedling. How seedling mass and mineral content vary with seed resources provides a clue to the nutritional significance of large seeds and curve-fitting helps here.
But comparison of relative content or transfer efficiency of nutrients between seed and seedling does not necessarily coincide with their relative contribution to seedling growth. Identification and ranking of those stored mineral nutrients that have the most impact on growth is best done with single-nutrient-omission experiments [9]. Seedlings are grown in an inert medium under various nutrient regimes. The controls receive distilled water only, while treatments include a full (balanced) nutrient solution, and individual nutrients are omitted from the otherwise balanced solution in others. The contribution of that seed nutrient to seedling mass is obtained by dividing mean mass for the particular nutrient-omission treatment by that for the balanced solution.
While this technique does not quantify how much of the nutrient is transferred, it can be used to approximate the seed mass that must be reached for the seedling to be independent of soil supply for the seedling to grow as well in the presence or absence of that nutrient in an otherwise full nutrient solution. Here, growth in the balanced nutrient solution is divided by growth in the omission treatment for a range of seed sizes and plotted against (log) seed mass, as shown in Figure 1 where P is omitted [9]. As seed mass increases the ratio approaches 1 until at Y = 1, P in the nutrient solution no longer has any benefit on growth, as P seed stores are sufficient, though of course they might continue to accumulate in the seedling and prove of later benefit as the seedling grows.
3. Statistical Approaches
Fundamental to analysing gradients of change is curvefitting. Because attributes such as seed size and nutrient
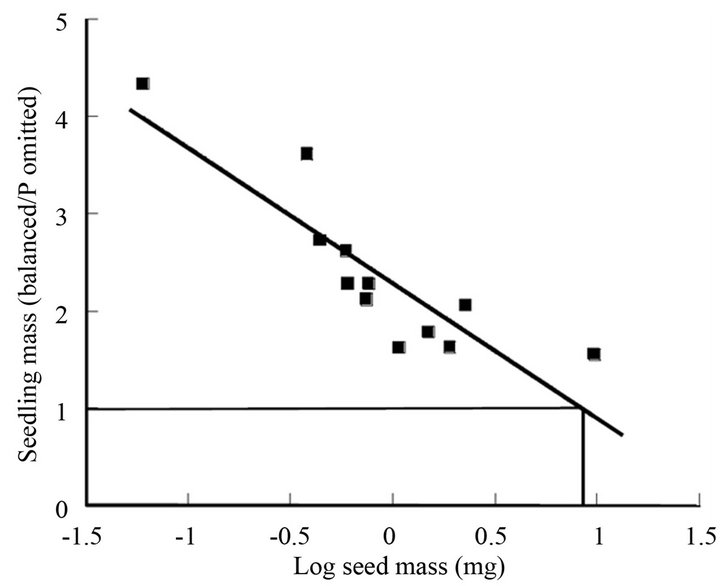
Figure 1. Relationship between seed mass and ratio of seedling mass in a balanced nutrient solution to that in the same solution but P omitted. As seed mass increases the ratio approaches 1 until at Y = 1, P in the nutrient solution no longer has any benefit on growth, i.e. P seed stores are sufficient (equivalent here to a seed mass of 9 mg). Raw data from [9]. Relationship equation is Y = −1.39X + 2.29, r2 = 0.755.
contents of seeds and seedlings may vary over orders of magnitude in particular studies it is often advisable to take their logarithms before analysis. This not only usually succeeds in normalising the data it also linearizes the relationships (power function), and there is meaning in the slope (b) of the line. In the studies described here, relative errors in determining Y values (nutrient content, seedling mass) will exceed those for X values (seed mass) by up to ten times, making minimum-triangular-area regression (geometric mean technique) least prone to error in estimating b [10]. If b is close to 1, the unlogged pairs of values are linearly related (Y is a constant multiple of X). If b > 1, the unlogged pairs of values are exponentially related, with increasing efficiency in “use” of X. If b < 1, the unlogged pairs of values are logarithmically related, with decreasing efficiency in “use” of X. Statistical tests are available for determining if any departure of b from 1 is significant.
How the slope of this line compares between seedling mass (Y) regressed against seed mass (as an index of stored C) and mineral nutrient content is used as an indication of which is more critical (greater b) for seedling establishment [5,11]. Statistical tests are also available for comparing two b values. The scatter about the line (often gauged as the coefficient of determination, r2) indicates the closeness of the relationship, i.e. the extent to which other variables affect the outcome, Y, so is also an important consideration. Finally, to avoid “spurious” correlation, absolute rather than relative values are used. Thus, seedling mass is regressed against total amounts of a particular nutrient rather than concentrations, which are total divided by mass, so are correlated by definition (Y/X will be a (negative) function of X even when they are random numbers). Interestingly, the slope of this relationship is equivalent to concentration, and values above the line for example indicate higher concentrations than expected from the overall relationship. Bias can be introduced by the phylogenetic relations and growing conditions of the species used in the analysis, making a case for using such large sample sizes that trends overwhelm the “noise” or recognizing groups and analysing them separately—we use both approaches here.
4. Nutrient Storage as a Function of Seed Mass
Early work on Hakea sericea showed that plants growing on experimentally nutrient-enriched soils produced smaller fruits and seeds, compared with plants growing on nutrient-impoverished soils [12]. This occurs not just within, but also between, species on different soil types [13, 14]. Investing less dry mass, and by implication less nutrient mass, into seeds when soil nutrients are not a growthlimiting factor suggests that seed nutrient reserves may be less important for establishment in nutrient-enriched sites [15-17]. Early growth of larger-seeded species (>15 mg) is independent of soil-nutrient supply, made possible through the high levels of cotyledon-stored nutrients [3,8, 17,19].
On a log-log scale between seed mass and total N or P content the gradient (b) can be used as an index of nutrient concentration (see above) that may vary within or between species. For example, Banksia marginata shows an almost linear relationship (data from [20]) between seed mass (4 - 13 mg) and total N (b = 1.02) and P (b = 0.90). For B. cunninghamii (4 - 20 mg), one population has b = 1.13 for N, and 1.09 for P, and another, on much poorer soil, has a clearly exponential relationship (b = 1.24 and 1.27) [21]. Among temperate species on a world scale, Figures 2(a) and (b) shows that there is a tight overall relationship (b ≥ 1; P < 0.002) between seed mass and N and P contents. This contrasts with the findings of earlier studies using smaller data sets (ash content for Asteraceae [5]; SW Australia seeds [36]) where b < 1. These wider ranging results suggest that stored mineral nutrients play an increasingly important role for larger seeds in accounting for seedling mass in temperate regions. This impression needs confirmation by correlating mineral content or transport against actual seedling mass or indirectly via nutrient-omission experiments (see below).
Seeds tend to be larger (by an order of magnitude) and more nutrient-enriched (by 1.5 orders of magnitude) in regions with poorer soils (Australia and South Africa in the upper half of Figures 2(a) and (b) compared with Europe and New Zealand in the lower half), pointing to the greater value of seed nutrients in seedling establishment there. At a finer scale, the data show that for three regions considered highly nutrient-impoverished among temperate regions and for a family well-represented in all three (Proteaceae), b remains ≥ 1 (Figures 2(c) and (d)). There is a rising gradient in mean seed mass, and N and P contents, concentrations and coefficient of determination, from the sandstones in eastern Australia (EA), to the sands and limestones of the Cape of South Africa, to the sands and laterites of SW Australia (SWA) (Figures 2(c) and (d)). This suggests that nutrients are more limiting for growth in SWA than EA or the Cape, consistent with relative soil nutrient values where the Proteaceae abounds in SWA and EA [23], though EA is not clearly more nutrient-impoverished than the Cape [40,42]. An alternative interpretation is that moisture is more limiting in SWA [43,49] so that seed nutrients are used to supplement soil nutrients (also limiting) for promoting photosynthesis that ensures rapid growth and descent of the taproot before the onset of periods of drought [27] as discussed further below.
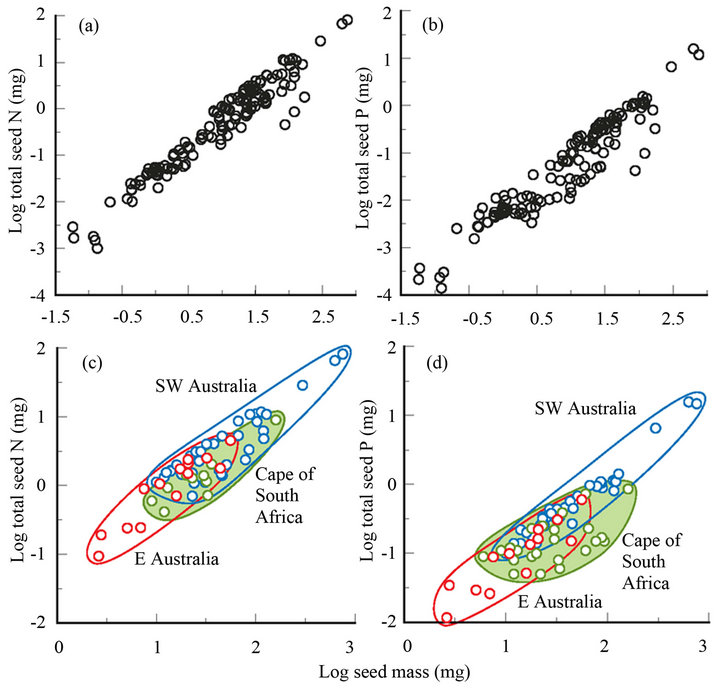
Figure 2. Relationship between seed mass and total (a) seed-N and (b) seed-P content for worldwide temperate regions [8,13,14,17,18,20,22-34], (N: b = 1.02, r2 = 0.93, n = 133; P: b = 1.10, r2 = 0.90, n = 133) and the equivalent (c), (d) for southwestern Australia [3,8,17,25,26,28,34-36] and eastern Australia (33), and the Cape of South Africa [13,29,31,37-39] for Proteaceae (subfamilies Grevilleoideae and Proteoideae) (N: b = 1.04, r2 = 0.84, n = 61; P: b = 1.01, r2 = 0.72, n = 79).
Seed nutrient content may also be linked to levels of on-plant seed storage (serotiny) where seeds of serotinous species are larger and P concentrations higher than those of non/weakly-serotinous seeds [49]. This is achieved through serotinous seeds taking longer to mature (up to 3 y) and therefore receiving more resources as a function of time. This no doubt increases competitiveness in the postfire environment following massive germination in the litter microsites [44] and is worthy of further study. Resource costs (essentially C) of producing a woody fruit/infructescence to protect the stored seeds have to be taken into account but they appear small compared with the fitness advantages of only releasing seeds postfire in nutrient-impoverished environments [15,39, 45]. The greatest incidence of serotiny in SWA among the mediterranean regions (in fact, world) adds further support to the notion that SWA soils are the most nutrient-impoverished, tempered by its reliably wet winter [46].
5. Seedling Growth as a Function of Seed Mass and N and P Contents
The positive relationship between seed and seedling size is well established, but there is no universal shape to the power function line, with b varying from 0.18 to 1.02 for the nine data sets that we were able to locate. Within species, seedling mass may vary with seed mass linearly (b = 1) or logarithmically (b < 1) [21]. For batches of taxonomically or regionally-related species at various times since germination, either b approaches 1 (data from 15) or, more commonly, b < 1 (data/values from [4,5,17,30, 47,48]). There is a logarithmic relationship (b = 0.79) between cotyledon mass (independent variable, varying over four orders of magnitude) and seedling mass treated as the dependent variable (derived from [4]).
For N, b ranges from 0.19 to 1.50, using the results of experiments based on nutrient content of the seed, actual nutrient transfer from seed to seedling, and N-omission vs full-nutrient solutions (Table 1). For P, b ranges from 0.63 to 1.26. Table 1 for the total data set shows that b for seed mass (C) only exceeds the equivalent slopes for N and P in two of 15 comparisons, and b for N exceeds the equivalent value for P in only two of seven paired comparisons, indicating that P is usually more limiting for establishment than N. The slope b is >1 for mass in one of eight studies, for N in three of seven studies, and for P in five of eight studies. Thus, we conclude that seed-stored C is rarely as important as stored nutrients in accounting for seedling growth in temperate systems. Further, in marked contrast to their nutrient stores, many cotyledons do not decrease in mass over time so that they are not a net source of C for seedlings [3,7,8]. While b for the major nutrients is rarely <1, that for mass usually
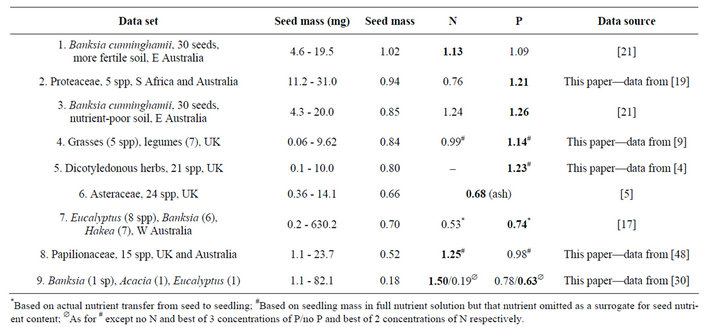
Table 1. Slopes (b) of power function fits to seedling mass grown in absence of added nutrients vs the independent variables, seed mass, and N and P contents of the seed. Ordered from highest to lowest b for seed mass. Slopes in bold are the largest of the three obtained in that study. r2 ranged 39.1% - 96.7% for all curve fits.
is. However, there is no special significance in the value of b relative to 1, only how they compare with each other as a measure of the relative functional significance of the relationship.
Thus, in almost every case seedling mass is more responsive to seed nutrients than to seed mass. However, seed reserves of some nutrients are more valuable to seedlings than others. For the data above, available P is usually more important than N. But the exceptions are intriguing: in more fertile soil, the critical nutrient switches from P to N for the same species and seed-size range [21]. For seed content, N has a much sharper relationship with seedling mass than P (correlative) but the associated omission study (causative) shows the reverse [30]. Such vacillation supports the view of seeds as a general store of remobilizable nutrients with the identity of the most critical for early growth depending on soil supply, the group of species under consideration, and the technique of identification used.
Data we have collated for two studies [9,48] shows how seeds are a general source of nutrients by the much steeper relationship between growth in a balanced nutrient solution compared with distilled water (b = 5.18 for [9], 1.38 for [48]) than compared with a solution lacking only N (2.64, 0.83) or P (1.39, 0.64) as seed mass increases (see above for technique). If it was just a question of the extent of C supply from the seed then all slopes would be the same. As a result, a seed mass is reached where addition of the various nutrient solutions no longer benefits early seedling growth as seed sources are sufficient. Thus, seedling mass no longer responds positively to nutrient addition once seeds of a selection of temperate annual grasses reach a mass of about 10 mg [9] and grasses and legumes of about 20 mg [48]. This is only slightly above the world mean seed size, but more than 10 times the mean for grasses and it almost equals the mean for legumes [50]. Similarly, among three woody genera, there is no further growth benefit to increasing concentrations of a balanced nutrient solution once seed mass (varying over four orders of magnitude) reaches 15 - 20 mg [17]. Removal of the cotyledons of a 5-mgseeded Hakea species reduces seedling mass by only 20% while adding full nutrient solution increases it by 250% whether cotyledons are present or not [19]. Removal of the cotyledons of a 67-mg seeded Hakea species results in a 65% reduction in mass while addition of nutrients counters this by 50%. In the presence of cotyledons, growth is unaffected by whether this species is fed nutrient solution or not. All these studies suggest that large seeds are a general source of nutrients that greatly promotes growth of seedlings in nutrient-impoverished soils but less so the more fertile the soil.
6. Seed Size, Nutrient-Enrichment and Seedling Survival
Seedlings from large seeds tend to survive longer in the absence of added nutrients (b = 0.22, i.e. a 65% increase in longevity requires a 10-fold increase in seed reserve mass) [51]; by adding dilute nutrient solution this increases by a mean of 4 days, confirming nutrient supply limits growth in the absence of external nutrients. A logarithmic increase in seedling survival occurs with greater seed mass under water-amended treatments in semi-arid Australia [52]. For a glasshouse trial using the same species in 40 cm long pots, survival is a function of the amount of water added to the smallest seed class (mean of 0.7 mg) but is independent of watering rate (close to 100% survival) in the 12-mg class [52]. This implies that the roots of seedlings from larger seeds are able to reach water at greater depths in the pot (discussed further below). Our collated work on survival of young plants in mediterranean Australia also shows a logarithmic relationship between seed mass and survival after the first summer drought (Figure 3). The power function fit gives b = 0.34 and r2 = 0.615 confirming the strongly diminishing rate of extra benefit with increase in seed size and stochastic/species-specific elements in the results that prevented this relationship from being revealed in earlier site-based studies [50]. Indeed, by 20 mg, the line and raw data show little additional benefit in survival from larger seeds.
These patterns provide no clue as to the mechanism of greater survival of seedlings from larger seeds. It can be expected that seedlings from smaller seeds will best survive via drought-tolerance in the first year (e.g. ability to survive prolonged periods below the turgor-loss-point [41]). Seedlings from larger seeds can be expected to have more extensive root systems, and might best survive by avoiding drought (e.g. by developing a long tap root that maintains contact with soil water during drought [53]). Seedlings from intermediate-sized seeds might possess both mechanisms. How survival is enhanced by higher nutrient levels associated with large seed size is discussed further below.
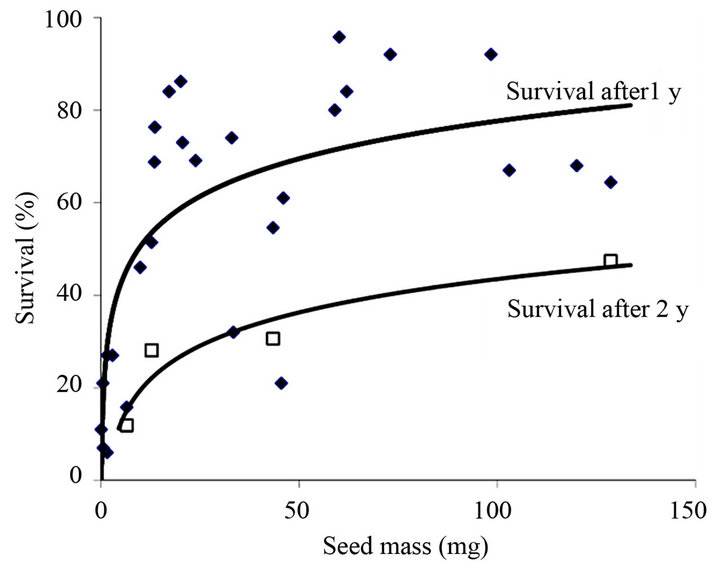
Figure 3. Relationship between seed size and survival of 1 (diamond) and 2 (square) years old plants of 28 species of serotinous shrubs (mostly Hakea and Banksia, Proteaceae) spread over a latitudinal distance of 1000 km in mediterranean SW Australia. Collated from [41,44,53,56,57] and unpublished data (B. Lamont).
7. By What Mechanisms Do Seedlings from Nutrient-Enriched Seeds Grow and Survive Preferentially?
7.1. Light Absorption
As the seed contributes little to seedling mass via direct transport of C, by far most of the increase must be due to photosynthesis by the seedling itself. For example, by 2 weeks in the absence of added nutrients, four Eucalyptus species have six times the dry mass of their seeds [54]. By 14 weeks in the absence of added nutrients, three Hakea species have 8 – 16 ´ the mass of their cotyledons which are now the same weight or heavier than initially, i.e. there is no net export of mass [3]. In contrast, the cotyledons by then are almost devoid of nutrients. It is well established that photosynthesis may be light, nutrient and/ or water-limited in nature. For all the cases we examined in this analysis, light was not limiting seedling growth (though of course some temperate systems may well be, especially if not subject to the opening-up effects of recurrent fire), and in the greenhouse experiments, the plants were well-watered. So the key to better performance by the large-seeded seedlings must be attributable to greater availability of nutrients. The key nutrient in photosynthesis is N (70% of the protein in a leaf is carboxylase, and chlorophyll contains four N atoms [55]) and it is worth noting for two Hakea species that 81% - 85% of cotyledon N is not only translocated to the seedlings but added N accumulates preferentially in the shoots indicating that it is still in limiting supply [3].
7.2. Nutrient Absorption
Greater root growth as a result of the enhanced photosynthetic capacity noted above increases the seedling’s ability to absorb soil nutrients and water. For two largeseeded Hakea species at 14 weeks, the indirect contribution of cotyledons to P uptake from the soil via greater root growth was estimated from cotyledon-removal experiments to be 46% - 67%; the direct and indirect contribution of the embryo to P seedling content is a remarkable 83% - 93% [3]. For N, 32% - 41% of total seedling content can be attributed to enhanced root growth due to presence of the cotyledons [3].
7.3. Water Absorption
The key to successful establishment among many young plants is their ability to survive seasonal drought or lowrainfall climates. Over two years in a mediterranean climate, shoot mass and survival of four interspersed species of Banksia increase in line with seed mass, varying 7 - 129 mg, as do their predawn shoot water potential (y) and midday stomatal conductance, i.e. larger seedlings are less water-stressed [57]. Note that N and P contents of seeds are a linear function of seed size in Banksia [17]. After two summers among three interspersed Hakea species, the largest species has 10 times shoot mass of the smallest, its survival is three times greater, its predawn shoot y is 30% higher and its relative water content (often considered the best index of plant water status) is 155% higher [57]. These imply differences in access to soil water and all studies to date show that larger seeds and better nutrient supply result in larger root systems with longer/deeper roots [29,54,58-60]. Field studies demonstrate that it is rapid and deep extension of the taproot rather than extensive lateral root growth that is the key to survival and that this is mainly a function of seed size and soil texture [53,61,62]. The taproot can be traced to a depth of 2 m or more, up to 10 times the stature of the plant, by 10 months in sand. To maintain a mid-summer predawn shoot y of −0.24 MPa requires equilibrium with a soil y of −0.24 MPa and this is only reached at a depth of 2.34 m (calculated from [53]). For the six species for which we were able to obtain seed masses [62], their relationship with taproot length gives b = 0.26, r2 = 0.718. When elongation of the taproot is constrained by high soil impedance (or other factors) then lateral root growth is promoted instead, the moister soil zones cannot be reached, and survival is curtailed [53,62]. Finally, the link between seed mass (plant size) and maintaining access to soil moisture is confirmed with the demonstration that survival among five 22-week-old Spanish species is a function of soil moisture levels reached by the roots, and root depth reached is correlated with plant size [63].
8. A Model for the Deployment of Carbon and Nutrients for Seedling Establishment
We can now offer an interpretative scenario for the special role of large seeds in nutrientand water-limited environments. Soil nutrient availability, especially of N and P, limit plant growth throughout temperate regions, but some soils are more nutrient-impoverished than others [64]. N and P are shunted preferentially by the adult plant into its seeds [32]. Seeds tend to be larger (more C) and more nutrient-enriched in poorer soils (Figure 2, figures in [65]). Conditions are sufficiently moist, even if only temporally, for germination and early growth to occur. Young seedlings have little capacity for light, nutrient or water absorption. Stored starch (absent from many families), proteins and phytates (K/Mg salts of inositol hexaphosphate, [66]) in the endosperm-cum-cotyledons are hydrolysed into sucrose, inositol, amino acids and mineral ions and transported to the developing roots and shoot (Figure 4). All nutrients involved in photosynthesis and stomatal operation are preferentially shunted from
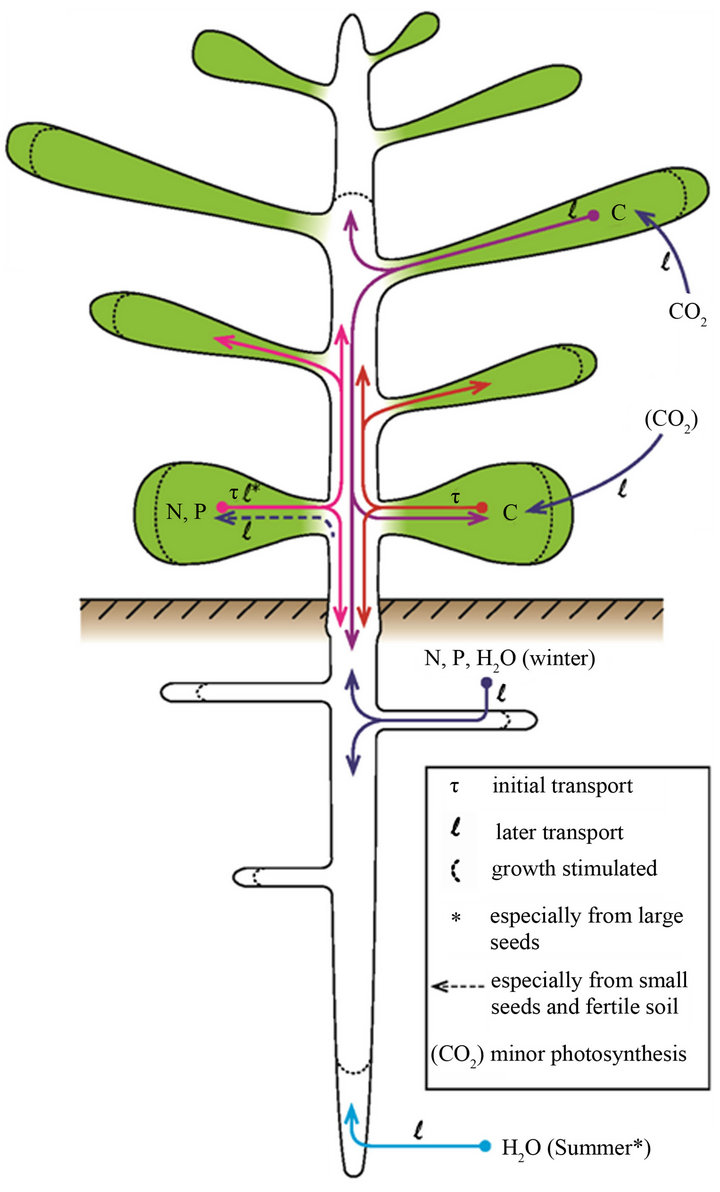
Figure 4. Stylized epigeal phanerocotylous seedling showing uptake and transport of C, N, P and water, based on the text. Note that the cotyledons are short-lived as a source of C as they soon become a sink. Except for small seeds and fertile soil, N and P continue to be transported out of the cotyledons until their supply is exhausted. This ready source of N and P in nutrient-limited soils enhances C fixation and general growth. Fixed C is shunted strongly to the root system where N, P and water uptake and elongation of the taproot in particular are promoted, as an indirect effect of greater N and P seed stores.
the seed to the developing leaves, and carbohydrates are synthesised. N and P are transferred from the seed to the seedling so successfully for large seeds that the issue of poor supply from the soil is bypassed. Adequate levels of less mobile nutrients essential for metabolism and cell formation, such as calcium and iron, must still be absorbed from the soil [3].
C transported to the roots in field soils is often at a higher ratio from that to the shoots for larger seeds [62]. What is more important is that both organs increase in size with nutrient supply from the seeds, enhancing the light, nutrient and water-gathering capacity of the seedling (Figure 4). Increased stature and leaf area promote further C capture [58,67]. In particular, the more extensive root system can enhance the uptake of nutrients generally, and transpiration-stream-mobile nutrients in particular, to balance photosynthetic requirements of the shoots. For water-limited habitats, the more extensive root system enhances water absorption while surface water remains abundant. More importantly, unless prevented by impenetrable soil, larger seeds result in deeperelongating roots (at the expense of lateral growth). Deeper roots can keep pace with the retreating soil moisture as the wet season or period closes, so young plants avoid excessive water stress. While plant survival is ultimately water-limited, such descent by the roots must be C-limited from the shoots whose photosynthetic capacity in turn is N/P-limited. Larger seeds as better nutrient stores are an effective solution for seedlings to cope with these routine environmental and physiological constraints in temperate climates. Stored mineral nutrients are more important than organic as they have a “multiplier” effect on growth, acting as recyclable catalysts and electron carriers rather than as substrates. Such a role gives a particular fitness advantage to large seeds in soils impoverished in remobilizable nutrients and subject to severe drought. Much remains to be known about all the processes outlined here, but with decreasing rainfall a typical prediction for temperate systems, more attention needs to be given to the drought-avoiding properties afforded by larger, nutrient-enriched seeds.
9. Acknowledgements
This manuscript results from an invitation by Mike Cramer to contribute to a symposium on phosphorus as a limiting resource (South Africa, January 2009). The inspiration for this review came from earlier assertions that large seeds were only for “emergency” purposes such as deep shade or herbivory loss of initial foliage, both emphasizing their roles as carbon stores. BL acknowledges his Senior Fulbright Award (hosted by Hal Mooney, Stanford University) that enabled him to undertake relevant research on the topic and his half-time research professorship that allowed him the time to put the data into a wider context. Special thanks to Martin Henery for providing data from [33] for Figure 1, Wesley Lamont for preparing Figures 1 and 4, Mike Hughes for preparing the cartoon at the end of the reference list (which parodies the main message of this review), and Rachel Standish for comments on the original manuscript.
REFERENCES
- W. J. Ashcroft and D. R. Murray, “The Dual Functions of the Cotyledons of Acacia iteaphylla F. Muell. (Mimosoideae),” Australian Journal of Botany, Vol. 27, No. 4, 1979, pp. 343-352. doi:10.1071/BT9790343
- K. Kitajima, “Relationship between Photosynthesis and Thickness of Cotyledons for Tropical Species,” Functional Ecology, Vol. 6, No. 5, 1992, pp. 582-589. doi:10.2307/2390056
- B. B. Lamont and P. K Groom, “Green Cotyledons of Two Hakea Species Control Seedling Mass and Morphology by Supplying Mineral Nutrients Rather than Organic Compounds,” New Phytologist, Vol. 153, No. 1, 2002, pp. 101-110. doi:10.1046/j.0028-646X.2001.00300.x
- D. Atkinson, “Some General Effects of Phosphorus Deficiency on Growth and Development,” New Phytologist, Vol. 72, No. 1, 1973, pp. 101-111. doi:10.1111/j.1469-8137.1973.tb02014.x
- M. Fenner, “Relationships between Seed Weight, Ash Content and Seedling Growth in Twenty-Four Species of Compositae,” New Phytologist, Vol. 95, No. 4, 1983, pp. 697-706. doi:10.1111/j.1469-8137.1983.tb03533.x
- P. J. Grubb and D. A. Coomes, “Seed Mass and Nutrient Content in Nutrient-Starved Tropical Rainforest in Venezuela,” Seed Science Research, Vol. 7, No. 3, 1997, pp. 269-280. doi:10.1017/S0960258500003627
- D. R. Mulligan and J. W. Patrick, “Carbon and Phosphorus Assimilation and Deployment in Eucalyptus piluaris Smith Seedlings with Special Reference to the Role of the Cotyledons,” Australian Journal of Botany, Vol. 33, No. 5, 1985, pp. 485-496. doi:10.1071/BT9850485
- P. Milberg and B. B. Lamont, “Seed/Cotyledon Size and Nutrient Content Play a Major Role in Early Performance of Species on Nutrient-Poor Soils,” New Phytologist, Vol. 137, No. 4, 1997, pp. 665-672. doi:10.1046/j.1469-8137.1997.00870.x
- M. Fenner and W. G. Lee, “Growth of Seedlings of Pasture Grasses and Legumes Deprived of Single Mineral Nutrients,” Journal of Applied Ecology, Vol. 26, No. 1, 1989, pp. 223-232. doi:10.2307/2403663
- B. H. McArdle, “The Structural Relationship: Regression in Biology,” Canadian Journal of Zoology, Vol. 66, No. 11, 1988, pp. 2329-2339. doi:10.1139/z88-348
- R. Kidson and M. Westoby, “Seed Mass and Seedling Dimensions in Relation to Seedling Establishment,” Oecologia, Vol. 125, No. 1, 2000, pp. 11-17. doi:10.1007/PL00008882
- N. C. W. Beadle, “Some Aspects of the Ecology and Physiology of Australian Xeromorphic Plants,” Australian Journal of Science, Vol. 30, 1968, pp. 348-355.
- K. J. Esler, R. M. Cowling, E. T. F. Witkowski and P. J. Mustart, “Reproductive Traits and Accumulation of Nitrogen and Phosphorus during the Development of Fruits of Protea compacta R. Br. (calcifuge) and Protea obtusifolia Buek. ex Meisn. (calcicole),” New Phytologist, Vol. 112, No. 1, 1989, pp. 109-115. doi:10.1111/j.1469-8137.1989.tb00315.x
- W. G. Lee and M. Fenner, “Mineral Nutrient Allocation in Seeds and Shoots of Twelve Chionochloa Species in Relation to Soil Fertility,” Journal of Ecology, Vol. 77, No. 3, 1989, pp. 704-716. doi:10.2307/2260980
- W. D. Stock, J. S. Pate, J. Kuo and A. P. Hansen, “Resource Control of Seed Set in Banksia laricina C. Gardner (Proteaceae),” Functional Ecology, Vol. 3, 1989, pp. 453-460. doi:10.2307/2389619
- D. L. Venable, “Size-Number Trade-Offs and the Variation of Seed Size with Plant Resource Status,” The American Naturalist, Vol. 140, No. 2, 1992, pp. 287-304.
- P. Milberg, M. A. Pérez-Fernández and B. B. Lamont, “Seedling Growth Response to Added Nutrients Depends on Seed Size in Three Woody Genera,” Journal of Ecology, Vol. 86, No. 4, 1998, pp. 624-632. doi:10.1046/j.1365-2745.1998.00283.x
- W. D. Stock, J. S. Pate and J. Delfs, “Influence of Seed Size and Quality on Seedling Development under Low Nutrient Conditions in Five Australian and South African Members of the Proteaceae,” Journal of Ecology, Vol. 78, No. 4, 1990, pp. 1005-1020. doi:10.2307/2260949
- B. B. Lamont and P. K. Groom, “Seed and Seedling Biology of the Woody-Fruited Proteaceae,” Australian Journal of Botany, Vol. 43, No. 4, 1998, pp. 387-406. doi:10.1071/BT96135
- G. Vaughton and M. Ramsey, “Sources and Consequences of Seed Mass Variation in Banksia marginata (Proteaceae),” Journal of Ecology, Vol. 86, No. 4, 1998, pp. 563- 573. doi:10.1046/j.1365-2745.1998.00279.x
- G. Vaughton and M. Ramsey, “Relationships between Seed Mass, Seed Nutrients, and Seedling Growth in Banksia cunninghamii (Proteaceae),” International Journal of Plant Science, Vol. 162, No. 3, 2001, pp. 599-606.
- N. J. Grundon, “Mineral Nutrition of Some Queensland Heath Plants,” Journal of Ecology, Vol. 60, No. 1, 1972, pp. 171-181. doi:10.2307/2258049
- J. R. Withers, “Studies on the Status of Unburnt Eucalyptus Woodland at Ocean Grove, Victoria. II. The Differential Seedling Establishment of Eucalyptus ovata Labill. and Casuarina littoralis Salisb.,” Australian Journal of Botany, Vol. 26, No. 4, 1978, pp. 465-483. doi:10.1071/BT9780465
- P. J. Hocking, “The Mineral Nutrition of Developing Fruits of Kennedia prostrata R. Br. ex Ait., a Perennial Australian Legume,” Australian Journal of Botany, Vol. 28, No. 6, 1980, pp. 633-644. doi:10.1071/BT9800633
- P. J. Hocking, “The Nutrition of Fruits of Two Proteaceous Shrubs, Grevillea wilsonii and Hakea undulata, from South-Western Australia,” Australian Journal of Botany, Vol. 30, No. 2, 1982, pp. 219-230. doi:10.1071/BT9820219
- J. Kuo, P. J. Hocking and J. S. Pate, “Nutrient Reserves in Seeds of Selected Proteaceous Species from South-Western Australia,” Australian Journal of Botany, Vol. 30, No. 2, 1982, pp. 231-249. doi:10.1071/BT9820231
- R. H. Groves, P. J. Hocking and A. McMahon, “Distribution of Biomass, Nitrogen, Phosphorus and Other Nutrients in Banksia marginata and B. ornata Shoots of Different Ages after Fire,” Australian Journal of Botany, Vol. 34, No. 6, 1986, pp. 709-725. doi:10.1071/BT9860709
- P. J. Hocking, “Mineral Nutrient Composition of Leaves and Fruit of Selected Species of Grevillea from SouthWestern Australia, with Special Reference to Grevillea leucopteris Meissn.,” Australian Journal of Botany, Vol. 34, No. 2, 1986, pp. 155-164. doi:10.1071/BT9860155
- P. J. Mustart and R. M. Cowling, “Seed Size: Phylogeny and Adaptation in Two Closely Related Proteaceae Species-Pairs,” Oecologia, Vol. 91, No. 2, 1992, pp. 292-295. doi:10.1007/BF00317799
- R. H. Groves and K. Keraitis, “Survival and Growth of Seedlings of Three Sclerophyll Species at High Levels of Phosphorus and Nitrogen,” Australian Journal of Botany, Vol. 24, No. 6, 1976, pp. 681-690. doi:10.1071/BT9760681
- E. T. F. Witkowski, “Nutrient Limitation of Inflorescence and Seed Production in Leucospermum parile (Proteaceae) in the Cape Fynbos,” Journal of Applied Ecology, Vol. 27, No. 1, 1990, pp. 148-158. doi:10.2307/2403574
- E. T. F. Witkowski and B. B. Lamont, “Disproportionate Allocation of Mineral Nutrients and Carbon between Vegetative and Reproductive Structures in Banksia hookeriana,” Oecologia, Vol. 105, No. 1, 1996, pp. 38-42. doi:10.1007/BF00328789
- M. L. Henery and M. Westoby, “Seed Mass and Seed Nutrient Content as Predictors of Seed Output Variation between Species,” Oikos, Vol. 92, No. 3, 2001, pp. 479-490. doi:10.1034/j.1600-0706.2001.920309.x
- P. K. Groom and B. B. Lamont, “Fruit and Seed Development in Two Hakea Species (Proteaceae),” Journal of Royal Society Western Australia, Vol. 87, No. 4, 2004, pp. 135-138.
- M. D. Denton, E. J. Veneklaas, F. M. Freimoser and H. Lambers, “Banksia Species (Proteaceae) from Severely Phosphorus-Impoverished Soils Exhibit Extreme Efficiency in the Use and Re-Mobilisation of Phosphorus,” Plant, Cell and Environment, Vol. 30, No. 12, 2007, pp. 1557-1565. doi:10.1111/j.1365-3040.2007.01733.x
- J. S. Pate, E. Rasins, J. Rullo and J. Kuo, “Seed Nutrient Reserves of Proteaceae with Special Reference to Protein Bodies and Their Inclusions,” Annals of Botany, Vol. 57, No. 6, 1986, pp. 747-770. doi:10.1093/oxfordjournals.aob.a087159
- D. T. Mitchell and N. Allsopp, “Changes in the Phosphorus Composition of Seeds of Hakea sericea (Proteaceae) during Germination under Low Phosphorus Conditions,” New Phytologist, Vol. 96, No. 2, 1984, pp. 239-247. doi:10.1111/j.1469-8137.1984.tb03560.x
- D. M. Richardson, B. W. van Wilgen and D. T. Mitchell, “Aspects of the Reproductive Ecology of Four Australian Hakea Species (Proteaceae) in South Africa,” Oecologia, Vol. 71, No. 3, 1987, pp. 345-354. doi:10.1007/BF00378706
- M. D. Cramer and J. J. Midgley, “Maintenance Costs of Serotiny Do Not Explain Weak Serotiny,” Austral Ecology, Vol. 34, No. 6, 2009, 653-662. doi:10.1111/j.1442-9993.2009.01971.x
- N. J. Hannon, “The Status of Nitrogen in the Hawkesbury Sandstone Soils and Their Plant Communities in the Sydney District. I. The Significance and Level of Nitrogen,” Proceedings of the Linnaean Society of New South Wales, 1956, pp. 119-143.
- M. B. Richards and B. B. Lamont, “Post-Fire Mortality and Water Relations of Three Congeneric Shrub Species Under Extreme Water Stress—A Trade-Off with Fecundity?” Oecologia, Vol. 107, No. 1, 1996, pp. 53-60. doi:10.1007/BF00582234
- N. C. W. Beadle, “Soil Phosphate and the Delimitation on Plant Communities in Eastern Australia II,” Ecology, Vol. 43, 1962, pp. 281-288. doi:10.2307/1931983
- R. L. Specht, P. W. Rundel, W. E. Westman, P. C. Catling, J. D. Majer and P. Greenslade, “Mediterranean-Type Ecosystems. A Data Source Book,” Kluwer Academic Publishers, Dordrecht, 1988. doi:10.1007/978-94-009-3099-5
- B. B. Lamont, E. T. F. Witkowski and N. J. Enright, “Post-Fire Litter Microsites: Safe for Seeds, Unsafe for Seedlings,” Ecology, Vol. 74, No. 2, 1993, pp. 501-512. doi:10.2307/1939311
- B. B. Lamont and N. J. Enright, “Adaptive Advantages of Aerial Seed Banks,” Plant Species Biology, Vol. 15, No. 2, 2000, pp. 157-166. doi:10.1046/j.1442-1984.2000.00036.x
- R. M. Cowling, J. Ojeda, B. B. Lamont, P. W. Rundel, and R. Lechmere-Oertel, “Rainfall Reliability, a Neglected Factor in Explaining Convergence and Divergence of Plant Traits in Fire-Prone Mediterranean-Climate Ecosystems,” Global Ecology and Biogeography, Vol. 14, No. 6, 2005, pp. 509-519. doi:10.1046/j.1442-1984.2000.00036.x
- P. K. Groom and B. B. Lamont, “Reproductive Ecology of Non-Sprouting and Re-Sprouting Hakea Species (Proteaceae) in Southwestern Australia,” In: S. D. Hopper, M. Harvey, J. Chappill and A. S. George, Eds., Gondwanan Heritage: Evolution and Conservation of the Western Australian Biota, Surrey Beatty & Sons, Chipping Norton, 2006, pp. 239-248.
- M. E. Hanley, P. K. Cordier, O. May and C. K. Kelly, “Seed Size and Seedling Growth: Differential Response of Australian and British Fabaceae to Nutrient Limitation,” New Phytologist, Vol. 174, No. 2, 2007, pp. 381-388. doi:10.1111/j.1469-8137.2007.02003.x
- P. K. Groom and B. B. Lamont, “Phosphorus Accumulation in Proteaceae Seeds: A Synthesis,” Plant and Soil, Vol. 334, No. 1-2, 2010, pp. 61-72. doi:10.1007/s11104-009-0135-6
- A. T. Moles, D. D. Ackerly, C. O. Webb, J. C. Tweddle, J. B. Dickie and M. Westoby, “A Brief History of Seed Size,” Science, Vol. 307, No. 5709, 2005, pp. 576-580. doi:10.1126/science.1104863
- E. M. Jurado and M. Westoby, “Seedling Growth in Relation to Seed Size among Species of Arid Australia,” Journal of Ecology, Vol. 80, No. 3, 1992, pp. 407-416. doi:10.2307/2260686
- M. R. Leishman and M. Westoby, “The Role of Seed Size in Seedling Establishment in Dry Soil Conditions: Experimental Evidence from Semi-Arid Species,” Journal of Ecology, Vol. 82, No. 2, 1994, pp. 249-258. doi:10.2307/2261293
- N. J. Enright and B. B. Lamont, “Survival, Growth and Water Relations of Banksia Seedlings in a Sand Mine Rehabilitation Site and Adjacent Scrub-Heath Sites,” Journal of Applied Ecology, Vol. 29, No. 3, 1992, pp. 663-671. doi:10.2307/2404474
- W. Schütz, P. Milberg and B. B. Lamont, “Germination Requirements and Seedling Responses to Water Availability and Soil Type in Four Eucalyptus Species,” Acta Oecologica, Vol. 23, No. 1, 2002, pp. 23-30. doi:10.1016/S1146-609X(01)01130-4
- J. R. Evans, “Photosynthesis and Nitrogen Relationships in Leaves of C3 Plants,” Oecologia, Vol. 78, No. 1, 1989, pp. 9-19. doi:10.1007/BF00377192
- B. B. Lamont, P. K. Groom, M. B. Richards and E. T. F. Witkowski, “Recovery of Banksia and Hakea Communities after Fire—The Role of Species Identity and Functional Attributes,” Diversity and Distribution, Vol. 5, No. 1-2, 1999, pp. 15-26. doi:10.1046/j.1472-4642.1999.00032.x
- P. K. Groom, B. B. Lamont and I. W. Wright, “Lottery (Stochastic) and Non-Lottery (Biological) Processes Explain Recruitment Patterns Among Eight Congeneric Shrub Species in Southwestern Australia,” Journal of Mediterranean Ecology, Vol. 2, No. 1, 2001, pp. 1-14.
- H. Saneoka, K. Fujita and S. Ogata, “Effect of Phosphorus on Drought Tolerance in Chloris gayana Kunth and Coix lacryma L,” Soil Science and Plant Nutrition, Vol. 36, No. 2, 1990, pp. 267-274. doi:10.1080/00380768.1990.10414992
- R. D. Wulff, “Seed Size Variation in Desmodium paniculatum Ⅱ. Effects on Seedling Growth and Physiological Performance,” Journal of Ecology, Vol. 74, No. 1, 1986, pp. 99-114. doi:10.2307/2260351
- R. B. Benard and C. A. Toft, “Effect of Seed Size on Seedling Performance in a Long-Lived Desert Perennial Shrub (Ericameria nauseosa: Asteraceae),” International Journal of Plant Science, Vol. 168, No. 7, 2007, pp. 1027-1033. doi:10.1086/518942
- C. E. Evans and J. R. Etherington, “The Effect of Soil Water Potential on Seedling Growth of Some British Plants,” New Phytologist, Vol. 118, No. 4, 1991, pp. 571-579. doi:10.1111/j.1469-8137.1991.tb00998.x
- D. P. Rokich, K. A. Meney, K. W, Dixon and K. Sivasithamparam, “The Impact of Soil Disturbance on Root Development in Woodland Communities in Western Australia,” Australian Journal of Botany, Vol. 49, No. 2, 2001, pp. 169-183. doi:10.1071/BT00015
- F. M. Padilla and F. I. Pugnaire, “Rooting Depth and Soil Moisture Control Mediterranean Woody Seedling Survival during Drought,” Functional Ecology, Vol. 21, No. 3, 2007, pp. 489-495. doi:10.1111/j.1365-2435.2007.01267.x
- B. B. Lamont, “Mineral Nutrient Relations in Mediterranean Regions of California, Chile and South Africa,” In: M. T. Arroya, P. H. Zedler and M. D. Fox, Eds., Ecology and Biogeography of Mediterranean Ecosystems in Chile, California and Australia, Springer Verlag, New York, 1995, pp. 211-235. doi:10.1007/978-1-4612-2490-7_9
- M. Westoby, E. M. Jurado and M. R. Leishman, “Comparative Evolutionary Ecology of Seed Size,” Trends in Ecology and Evolution, Vol. 7, 1992, pp. 368-372. doi:10.1016/0169-5347(92)90006-W
- J. N. A. Lott, I. Ockenden, V. Raboy and G. D. Batten, “Phytic Acid and Phosphorus in Crop Seeds and Fruits: A Global Estimate,” Seed Science Research, Vol. 10, No. 1, 2000, pp. 11-33.
- J. Castro, “Seed Mass versus Seedling Performance in Scots Pine: A Maternally Dependent Trait,” New Phytologist, Vol. 144, No. 1, 1999, 153-161. doi:10.1046/j.1469-8137.1999.00495.x

NOTES
*Corresponding author.