Open Journal of Applied Biosensor
Vol.2 No.2(2013), Article ID:31253,11 pages DOI:10.4236/ojab.2013.22008
Investigation of the Holding Capability of the Dielectrophoretic Gate and Sorter System for Biodetection
1CFD Research Corporation, Huntsville, USA
2Department of Mechanical Engineering, Louisiana State University, Baton Rouge, USA
3Science, Mathematics, and Technology Division, Burlington County Community College,
500 College Circle, Mt Laurel, USA
Email: *hjs@cfdrc.com, *dbennett@bcc.edu
Copyright © 2013 Hongjun Song et al. This is an open access article distributed under the Creative Commons Attribution License, which permits unrestricted use, distribution, and reproduction in any medium, provided the original work is properly cited.
Received March 2, 2013; revised April 8, 2013; accepted April 20, 2013
Keywords: Biodetection; Dielectrophoresis; Microfludic System; Particle Separation
ABSTRACT
The dielectrophoretic gate and sorter system has been widely applied for preconcentrating and sorting of bioparticles for biodetection. In such systems, the dielectrophoretic force is generated by applying an AC electric field on the three dimensional electrode systems (containing a pair of electrodes on the top and bottom of the channel). Particles are held and sorted by balancing the DEP force with the hydrodynamic drag force. The holding capability is very important for such systems because it determines the preconcentration and sorting efficiency. In this paper, we investigate the holding capability of a simple dielectrophoretic gate system. Initially, a three dimensional numerical scheme was introduced to estimate the holding capability and was further validated by comparing with experimental results. Second, we systematically investigated the effects of the phase difference between the top and bottom electrodes; the height and width of the channel, and the relative position and size of top and bottom electrodes. The results demonstrated that the maximum holding capability is reached when the phase difference between the top and bottom electrodes is around 180˚. The results also show that the holding capability varied with the size and relative position of electrodes on the top and bottom, and the maximum holding capability is obtained when the top and bottom electrodes had the same size and the centers of both electrodes overlapped.
1. Introduction
Rapid separation and detection of biochemical samples is necessary for most biological and chemical analysis. To achieve these processes, large laboratory equipment and big sample volumes are needed when using traditional techniques. In recent years, the rapid development of microfluidic systems has provided the technology to realize rapid separation and detection by integrating sample injection, mixing, separation, and detection onto a small chip [1]. Several methods such as dielectric spectroscopy, dielectrophoresis, and impendence monitoring have been used to detect and characterize biological and chemical particles in microfluidic systems [2,3]. Compared to the other techniques, AC dielectrophoresis (DEP) has been proven to be effective for manipulating and separating biological particles such as DNA, cells, and bacteria [4-6] . This is due in part because the high frequency of the electric field suppresses undesirable electrolytic effects such as Faradaic reactions and electro-convection in the liquid. In addition, dielectrophoresis employs polarization forces that are insensitive to the particle charge [7,8].
In early DEP research, an array of interdigitated parallel electrodes was used as the typical design for dielectrophoretic separation. The sample suspension was quiescent over the electrodes on the bottom of the channel. When the AC electric potential was alternatively applied on the electrodes, a non-uniform electric field was established which induced a DEP force with polarizable particles. The DEP force caused the particles to move either toward or away from the electrodes depending upon the particle polarizability [9-11] . Subsequently, continuous flow DEP separation devices were developed for applications such as sorting particles [12-14] . In these devices, samples were injected into the channel with a constant flow rate, and an AC electric field was applied on the electrodes located on the bottom of the channel. Particles were separated by balancing the hydrodynamic stream force and the DEP force. Although planar electrodes on the bottom are simple and easily fabricated, some possible problems such as a much smaller DEP force and non-specific particle adhesion near the top of the channel caused low efficiency separation and trapping. To overcome these drawbacks, three dimensional (3D) electrode systems have been developed. The general idea of the 3D design is to fabricate a pair of electrodes which face each other in order to produce a stronger DEP trapping force. One electrode is on the top and the other electrode is on the bottom of the channel. Since the early 1990s, differrent shapes of 3D multi-electrodes to sort and manipulate particles have been explored [15-18] . Bennett et al. [19] fabricated an integrated dielectrophoretic gate system with parallel electrodes placed facing each other on the top and bottom of the channel and successfully separated particles and bacteria. A heterogeneous mixture of polystyrene beads and heat-killed bacterial cells (Staphylococcus aureus; Molecular Probes) dispersed in DI water was successfully separated by using the gating system [20]. An improved design with triangular and U-shaped electrodes was presented to achieve a highly efficient continuous separation between biological and non-biological particles [21]. This 3D electrodes system has also been used as a flow through sorter. Chen et al. [22,23] used the DEP gating system and continuously sorted two different sizes of polystyrene microbeads. Recently Li et al. presented a 3D electrode microfluidic device, composed of focusing, aligning and trapping functions, to concentrate and separate particles and cells. The result shows that 5 um particles can be successfully preconcentrated and isolated from yeast cells [24].
In such preconcentration and separation devices, particles were held due to the balance of the DEP force and the hydrodynamic force. However, particle would pass through the DEP gate if the hydrodynamic force is larger than the DEP force, leading a low efficiency on particle concentration and separation. Because the hydrodynamic force is linear with the sample flow rate, we introduced a threshold flow rate Qth, which is defined as the holding capability of the DEP force, to evaluate the holding and sorting efficiency. If the flow rate is bigger than Qth, the particle will escape and pass through the gate (bad holding and sorting efficiency). Conversely, if the flow rate is smaller than Qth, the particle will be held by the gate (good holding and sorting efficiency). Although the holding and sorting efficiency under 2D planar electrodes has been widely investigated [25-27] , the efficiency under a 3D electrode system has not been systematically studied and needs further investigation. Investigation of the critical voltage and critical velocity for sorting different size and types of particles has been performed using variable electrodes such as 3D parallel electrodes (alignment structure), 3D octopole electrodes (cages), and 3D curved electrodes [16-18] . Chen et al. [22,23] investigated the holding capability with different widths of the electrodes and different heights of the channel by using experimental and 2D simulation methods. However, important factors such as the relative position and size of the top and bottom electrodes, the width of the channel, and the phase difference between the top and bottom electrodes have not previously been investigated. In this paper, we present a systematical investigation of the holding capability of the DEP gate. First, a 3D numerical scheme is introduced to estimate the sholding capability and is validated by comparing to the experimental result. Second, the effects of the phase difference between the top and bottom electrodes, the height and width of the channel, and the relative position and size of electrodes is discussed in detail.
2. Theory and Methodology
2.1. Theory
When a high frequency AC electric field is applied on the top electrode and the bottom electrode with a phase difference θ, a non-uniform electric field is generated within the channel. Particles flowing along the channel are polarized and a dipole moment is generated that interacts with the electric field. The time average DEP force for a single radius particle is determined by [28]
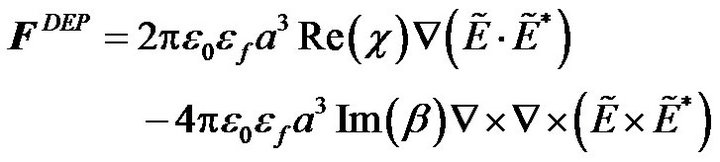
where a is the particle radius;  is the vacuum permittivity;
  is the relative dielectric permittivity of the fluid, and ω is the angular frequency of applied electric field.
  is the phasor notation of the applied electric field;
  is the dipolar Clausius-Mossotti factor, and f is the frequency of the applied electric field. The first term on the right side depends on the spatially varying field magnitude which corresponds to the conventional dielectrophoretic (cDEP) force; the second term depends on the spatially varying phase, which corresponds to the traveling wave dielectrophoretic (twDEP) force. For a homoge-nous fluid medium, the electric potential satisfies the Laplace equation which is derived by the quasielec-trostatic form of Maxwell’s equations [28]
Using the Maxwell-Wagner expression for the complex dielectric permittivity,  , where ε' is the permittivity,
  and σ is the conductivity. The polarizability,
  , can be expressed as follows [29]:
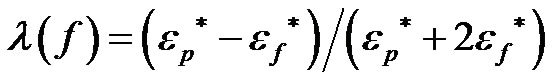
The particle is attracted towards or repelled from the high electric-field regions depending on whether Re(λ) > 0 (positive dielectrophoretic force) or Re(λ) < 0 (negative dielectrophoretic force) with the range of Re(β) varying between 1 and −1/2. If the particle and the medium are not charged, λ is only a function of the frequency, f. There is a crossover frequency, fc , which indicates the change from positive to negative DEP. If the frequency f is below the crossover frequency, fc, the particle will undergo positive DEP (Re(λ) > 0), and if the frequency f is above the crossover frequency fc, the particle will undergo negative DEP (Re(λ) < 0). In this paper, DI water was used as the medium and 1 µm latex beads were used as the particles. The relative permittivity of the particle and the medium are 2.5 and 79 respectively. The conductivity of the DI water is 2 µS/cm. The crossover frequency is approximately 800 kHz for 1µm latex beads, and the calculated conductivity of the 1µm latex beads is 50 µS/cm.
If we assume the particles are neutrally buoyant and also neglect the gravitational effect, Brownian motion, and the electric-thermal effect, then the movement of the particles mainly depends on the hydrodynamic drag force and the DEP force by
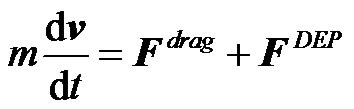
where the hydrodynamic drag force in laminar flow is defined as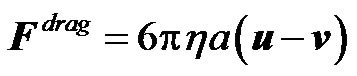 ,
,  is the local flow velocity;
  is the particle velocity, and
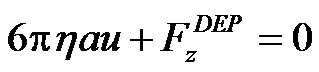
  is the mass of particle. If the particle is held by the gate system, the velocity of the particle remains zero, and the hydrodynamic drag force and the DEP force are balanced. Because the flow direction is along the channel (z-direction), only the z-component of the DEP force
  needs to be considered. Equation (4) then becomes
To find the holding capability of the gate system, the maximum flow velocity needs to be found using equation (5). In the particular application, the flow rate Q is easier to control than the local fluid velocity  in most applications. So, we introduced the maximum flow rate as the holding capability instead of the maximum flow velocity. In our investigation, the suspension of latex beads is driven through a rectangle channel using a syringe pump, and the stream flow along the channel (z-direction) is a fully developed pressure-driven Poiseuille flow. Thus, the distribution of the velocity is parabolic and the local velocity can be expressed as a classical Fourier series solution
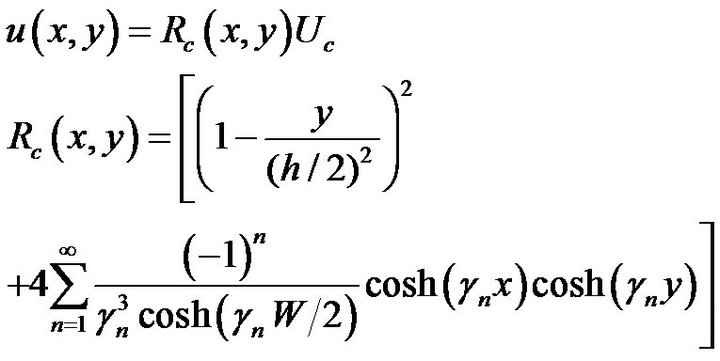
where γn = (2n − 1) π/h and n is the series number. Uc corresponds to the fluid velocity in the center of the channel, and Rc(x, y) is defined as the position coefficient. The relationship between the flow rate Q and the flow velocity u(x, y) is calculated by
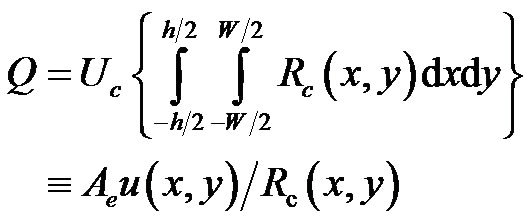
where 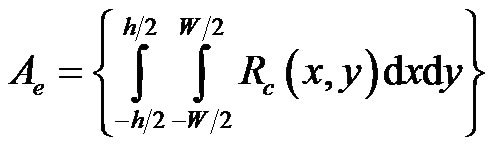 is defined as the equivalent area of cross section.
2.2. Physical Model and Numerical Procedure
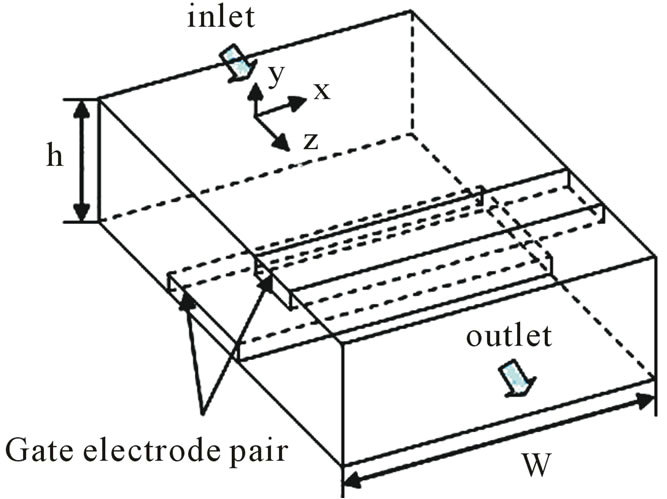
A general model of the DEP gate is depicted in Figure 1.
The DEP gate consists of a pair of microelectrodes that span a fluid channel, perpendicular to the direction of fluid flow. Particles are injected using a syringe pump at a constant flow rate Q. When an AC voltage is applied to the microelectrodes, an electric field is generated within the fluid channel. The width of the channel is w, and the height of the channel is h. Figure 1(b) shows the x-z plane of the DEP gate. An electrode with the width d1 is placed at the bottom; whereas, the other electrode with the width d2 is placed at the top of the channel. The distance between the center lines of the two electrodes is c. Because the height of electrodes is very thin compared to the width and the height of the channel, the height of electrodes was neglected in our investigation. Two fac-
 (a)
(a)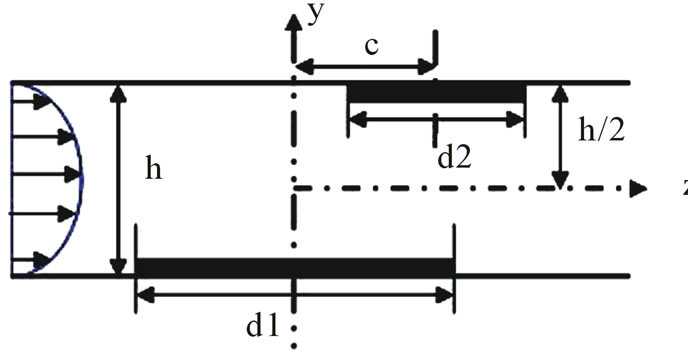 (b)
(b)
Figure 1. Physical model of the DEP gate: (a) 3D scheme; (b) cross section in the y-z plane.
tors were introduced to investigate the effect of electrode geometries and positions: one is the width/width ratio, 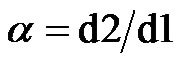 , which is defined as the width of the top electrode divided the bottom electrode. And the other one is the translating rate,
 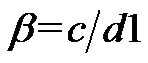 , which is defined as the distance between the centerline of two parallel electrodes divided by the width of the bottom electrode.
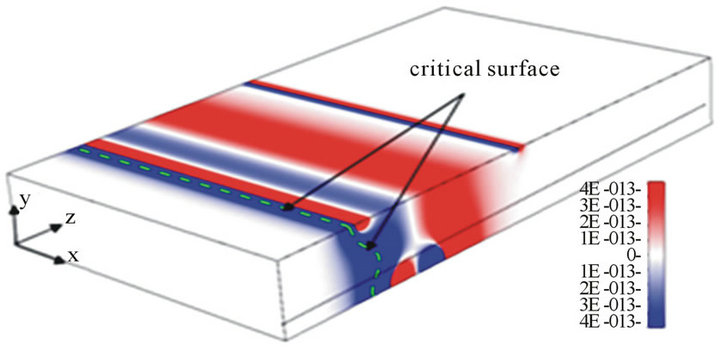
The 3D electric field was solved, and the DEP force was calculated by using the commercial software CFDACE + (ESI-CFD, Inc.). As an advanced technology, electric and electromagnetic simulation has been widely used in different research fields [30-32] . Figure 2(a) shows the 3D distribution of the z-component DEP force with the parameters α = 3, β = 0.5, and d1 = h = 40 µm. The width of the channel is 200 µm. The applied electric field is 10 Volts peak-to-peak, and the frequency applied is 15 MHz. Thus, the latex beads will move to a low field gradient as a result of a negative DEP force. The blue color in Figure 2(a) denotes that the z-component of the DEP force is below zero (DEP force against the flow direction), and the red color indicates that the z-component DEP force is above zero (DEP force has the same direction of the flow). Figure 2(a) shows that the maximum value of the z-component of the DEP force is reached near the electrodes and decreases rapidly away the electrodes. Due to the hydrodynamic force, particles will move towards the electrodes from the inlet. However, the velocity of the particles will decrease because the particles are repelled by the z-component DEP force (blue zone). If the z-component of the DEP force is strong enough, the particles will be held; otherwise, particles will pass through the gate system. Here, we introduced the way to estimate the holding capability of the DEP gate system by comparing the DEP force and hydrodynamic force directly instead of using particle-tracing simulations [33]. Because the hydrodynamic force is related to the local flow velocity , which is a function of (x, y) and independent with z, we can estimate the maximum flow velocity by balancing the hydrodynamic force with the maximum z-component of the DEP force against the flow direction for each particular position (x, y). To illustrate the process, we plot the z-component of the DEP force with different z-positions for the particular position (dash line in Figure 2(a)) in Figure 2(b). This shows there is a peak value of the z-component of DEP force (point A at Figure 2(b), negative sign shows the DEP force against the hydrodynamic force) when the particle moves from inlet to the outlet. To keep the particles held, the hydrodynamic drag force should not be bigger than the peak value of the z-component DEP force. Thus, the maximum velocity at position (x, y) is calculated by balancing the hydrodynamic drag force and the peak value of the z-component DEP force.
 (a)
(a)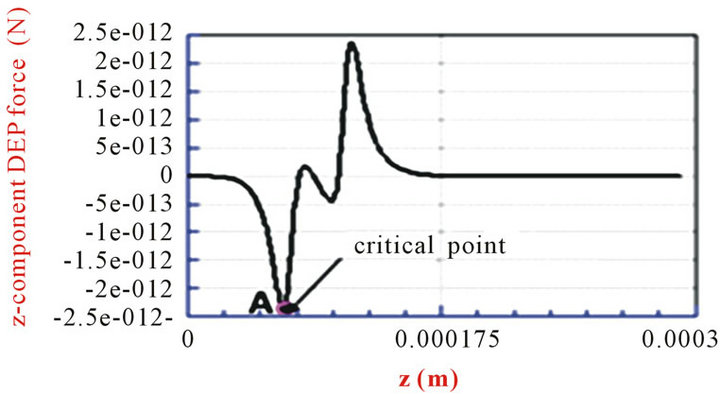 (b)
(b)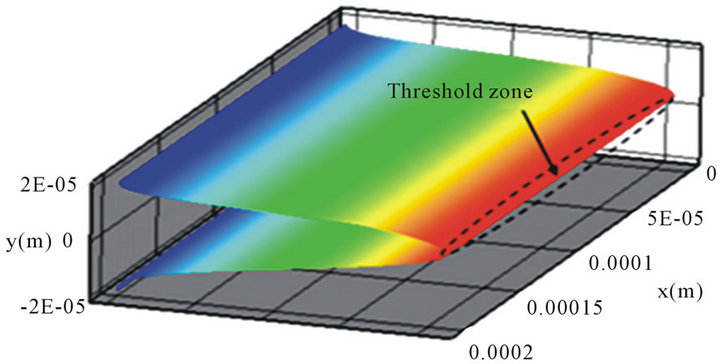 (c)
(c)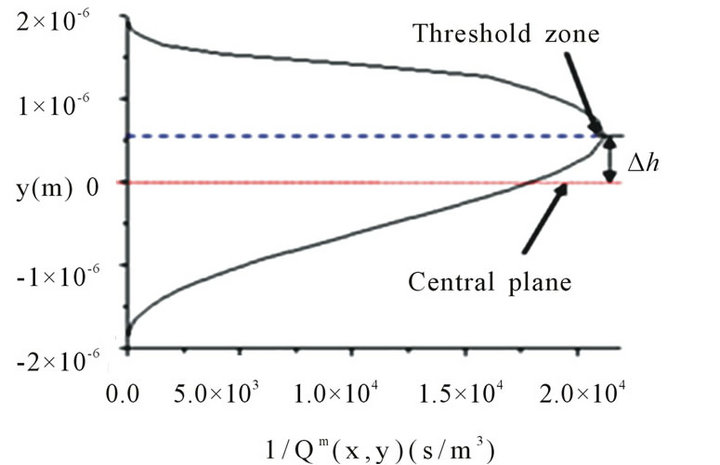 (d)
(d)
Figure 2. (a) the 3D distribution of the z-component DEP force; (b) the z-component DEP force with different zposition for dashed line in (a); (c) the 3D contour distribution of 1/Qm(x, y); (d) the side view along the x-axis of 1/Qm(x, y).
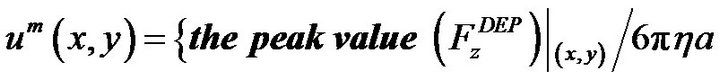
For pressure driven flow, we calculated the maximum flow rate for particles held at position (x, y) by equation (7)
Here point A is called the critical point for particles located at the position (x, y). However, the maximum flow velocity um(x, y) or flow rate Qm(x, y) is related to the position (x, y) and only guarantees that particles will be held at the particular position. To find the holding capability of the DEP gate system, we need to obtain the maximum flow rate Qm(x, y) for each position (x, y). A critical surface is obtained by collecting the critical point for all x and y positions (a diagram of the edge of the critical surface is shown as the dashed line at Figure 2(a). We also plotted the 3D contour distribution of 1/Qm(x, y) in Figure 2(c), which shows that 1/Qm(x, y) varies with different y positions, but it is almost independent of the x position. This is because the electrodes cover the whole width of the channel, and the electric field is most uniform along the x-direction. To keep particles held at the DEP gate system, the flow rate cannot exceed the maximum flow rate Qm(x, y) for all the x and y positions. Thus, the threshold flow rate Qth (holding capability) should equal the minimum value of the maximum flow rate Qm(x, y)
if the flow rate is not bigger than Qth, particles will be held at all the positions; otherwise, particles will pass through the channel at certain locations. We noticed that the shape of the contour surface varies case by case and is related to the distribution of DEP force and flow velocity. The zone where the minimum Qm(x, y) appears is known as the threshold zone (denoted with the ellipse at Figure 2(c)), which is the easiest zone for particles to pass through the gate. Because Qm(x, y) is almost independent of the x position, we plotted the side view along the x-axis of the 3D contour distribution of Qm(x, y) in Figure 2(d). As we can see, the threshold zone shifted a distance ∆h from the central plane (y = 0) for the DEP gate under the parameters α = 3, β = 0.5, and d1 = h = 40 µm. This phenomenon happens due to the asymmetric gradient of the electric field(consequently asymmetric zcomponent DEP was shown in Figure 2(a) when the size of electrodes is not the same (α ≠ 1) or the centerlines of two parallel electrodes do not overlap (β ≠ 0).
3. Materials and Methods
Devices were fabricated in Sandia National Laboratories Microelectronics Development Laboratory using Sandia’s SwiFTTM (Surface micromachining With Integrated Fluid Technology) process (see [20] for the fabrication details). In this process, a sophisticated version of AutoCAD is used to design parts in which each layer in the AutoCAD corresponds to a mask in the SwIFTTM process. This process was used to fabricate microfluidic channels. The ultra-planar multilayer process allows for the electrodes to be spaced very close together with a minimum distance of 1 µm. This process starts with a sixinch bare wafer where a layer of silicon oxide is grown on the surface. Then, a layer of low-stress silicon nitride is deposited on top of the oxide layer. The advantage of having the nitride layer is that it protects the silicon oxide from wet etchants. Moreover, the layers of silicon oxide and silicon nitride provide electrical insulation between subsequent thin layers and the substrate. The SwIFTTM process includes layers of silicon dioxide, silicon nitride, a sacrificial layer of oxide, as well as micromachined polysilicon layers. The micromachined polysilicon layer is used for electrical interconnections and as a ground plane while the other poly layers are the mechanical construction layers.
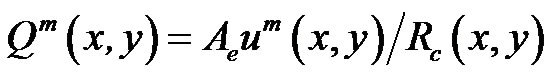
Figure 3 shows a microphotograph of the entire single DEP gate device. There are two electrode pads, one connects to the top electrode and the other connects to the bottom electrode. The suspension was prepared by dispersing 1 µm fluorescent latex beads (Invitrogen Corp.) at a concentration 0.02% into the deionized (DI) water. Before testing the devices, steel capillaries (30 gauge) were inserted into the inlet and outlet holes to create a direct connection to the microchannels. The other side of the inlet capillary was connected to the syringe pump while the outlet capillary was connected to the waste reservoir with Teflon tubing (30 gauge). The sample suspension was injected continuously into the microchannel using a Syringe pump (PHD 2000, Harvard Apparatus, MA). Electric fields were generated via a synthesized function generator (Protek 9302, Korea) and signals were connected to the electrode pads on the microfluidic chip. The function generator is capable of supplying an AC electric field up to 30 MHz and 10V peakto-peak. The imaging system consists of an epiflorescence microscope (Olympus Model BX51) with a Mercury are lamp (Model U-LH100HG 19V 100W, Olympus).
Figure 3. Microphotograph of the actual DEP gate device (dark field).
Visualizations were made by using optical lenses (LMPlanFI 10×, 20×, 50×, Olympus), and movies were recorded using a CCD camera.
4. Results and Discussion
4.1. Validation of Numerical Method
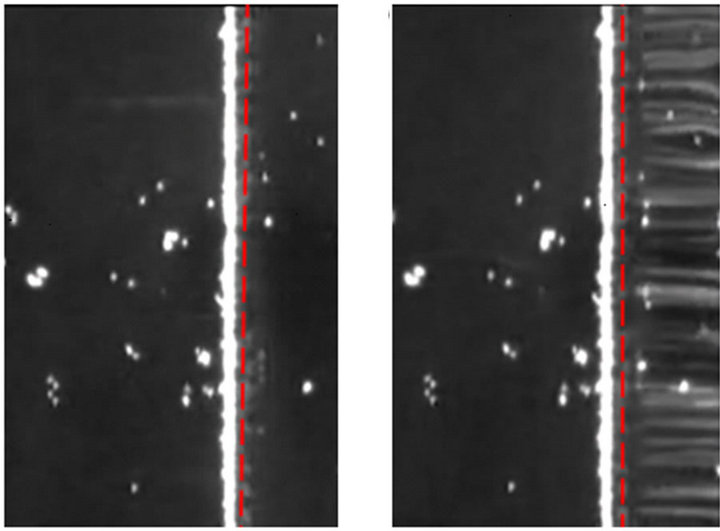
To validate the numerical method, we compared the predicted threshold flow rate Qth using the numerical method with the observed threshold flow rate Qth through experimental investigation. In the fabricated device, the height of the channel is 6 µm, the width of the electrodes is 10 µm, and the width of the channel is 200 µm. The numerical investigation has the same geometry and size. The applied electric field is 4 Volts peak to peak at 15 MHz, where Re(λ) = -0.47. The direction of the flow is from the left to the right. More and more particles are held and accumulated at the front of the DEP gate when the flow rate gradually increased from (20 to 40) µL/hour. The particles began to escape the DEP gate when the flow rate increased to 50 µL/hour. Figure 4(a) shows the particles are held by the DEP gate at a flow rate 20 µL/hour, and Figure 4(b) shows some particles are escaping and passing through the DEP gate with a flow rate 50 µL/hour. We should clarify that some latex beads stick on the channel (the corresponding dispersive white spots on both pictures). These particles are not held by the DEP gate. The long white bar adjacent to the DEP gate represents the accumulated particles held by the gate. The distinction between the escaped particles and the particles that have adhered to the top of the channel wall is that the escaped particles moved with the flow, and their trajectories have formed several white lines (shown at Figure 4(b)). Therefore, the threshold flow rate can be found between the slow flow rate and the fast flow rate.
 (a) (b)
Figure 4. (a) Particles are held by the DEP gate at with low flow rate 20 µL/hour (b) Some particles escape the DEP gate at high flow rate 50 µL/hour. The applied electric field is 4V peak-to-peak at 15MHz.
However, the measured threshold flow rate determined by using this method (gradually increasing the flow until the particles began to escape the DEP gate) is much larger than the threshold flow rate predicted from the numerical simulation. A similar phenomenon was reported by [22,23]. The reason for the discrepancy is that more and more particles accumulating in front of the DEP gate cause strong inner-particle interactions. To avoid this phenomenon, another method is used for our experiments. By gradually increasing the flow rate and flushing out the trapped particles between each increase, we are able to determine the threshold flow velocity. The general idea is that we start from an initial flow rate which is so slow that the particles can be held by the DEP gate. Then, we turn off the electric field to flush away the accumulated particles. Next, we increase the flow rate by a constant small value to a higher flow rate and turn on the electric field again. If the particles are still held, we turn off the electric field and flush away the accumulated particles again, and increase the flow rate once more. This procedure is repeated until we observe that some particles escape from the DEP gate. The maximum flow rate at which particles can be held is measured as the threshold flow rate. In this method, the interaction between particles is almost eliminated because for every repeat most of the accumulated particles are flushed away before turning on the electric field.
Five different electric potentials (1, 2, 3, 4 and 5) Volts (corresponding to 2, 4, 6, 8 and 10 Volts peak to peak) were chosen to validate the numerical method. Figure 5 shows the comparison of the numerical results and experimental results between the threshold flow rate and the square of applied electric potential. The threshold flow rates are (4, 12, 25, 40 and 62.5) µL/hour from the experimental data and (3, 10, 21, 37 and 58) µL/hour from the numerical simulation. Although the experimental result is a little larger than the numerical result, it is still acceptable under the permissible error range. The numerical method is a valid method to estimate the holding capability of the gate system. Figure 5 also indicates the threshold flow rates are approximately linear with the square of the applied electric potential which satisfies the theoreticcal prediction from the scale law [34]. This demonstrates that a higher applied electric potential will result in a stronger holding capability for the DEP gate system.
4.2. The Effect of the Phase Difference between the Top and Bottom Electrodes
As we know, the DEP force is directly affected by the applied electric field, which always includes the applied electric potential, electric frequency, and the phase difference between electrodes. Thus, the holding capability of the DEP gate system is sensitive to the electric field.
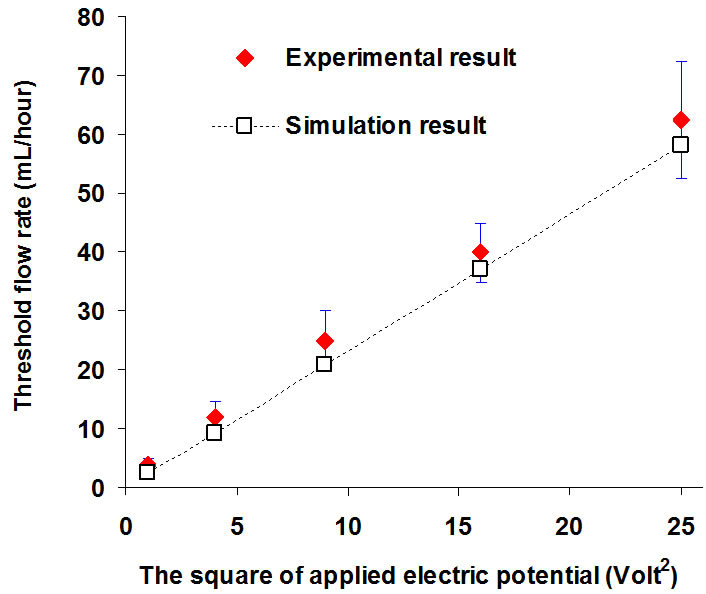
Figure 5. The relationship between the threshold flow rate Qth (µL/hour) and the square of applied electric potential (volts2).
Although the effect of the applied electric potential and frequency for DEP gate and sorter systems has been investigated [16,18,22,23] , the effect of the phase difference between the top and bottom electrodes has not been studied. An AC electric field is always applied on one side of the electrode and the other side is grounded in most DEP gating systems. When we applied an AC electric potential with a phase difference on the other electrode, instead of the grounding the electrode, the electric strength varies with the phase difference. Meanwhile the traveling wave DEP force, FtwDEP, is generated and will also contribute to holding the particles. The holding capability may be enhanced due to these changes. In this section, we investigated the effect of the phase difference between the top and bottom electrodes (ranging from 0˚ to 360˚) on the holding capability of the DEP gate system. We applied the electric field with the amplitude 10 Volts peak-to-peak on both the top and bottom electrode while applying a phase difference θ between the top electrode and bottom electrodes. The frequency of the electric field is 2 MHz (Re(λ) = −0.3622 and Im(λ) = −0.3783), and the width of the channel is 200 µm. The numerical result shows that the traveling wave DEP force FtwDEP is much smaller than the conventional DEP force FcDEP (FtwDEP is only a ratio of 0.1% or less to FcDEP), which indicates the conventional DEP force makes the main contribution to the DEP gate. We also calculated and measured the threshold flow rate Qth, with phase differences between the top and bottom electrodes using numerical and experimental methods (the relationship is plotted in Figure 6).
The graph clearly shows the threshold velocity is a symmetric distribution around the phase difference θ = 180˚. When the phase difference θ is 0˚ (which means the electric field is the same on the top and bottom electrodes), particles will never be held because no DEP force is generated. When the phase difference increases up to 180˚, the threshold flow rate (holding capability)
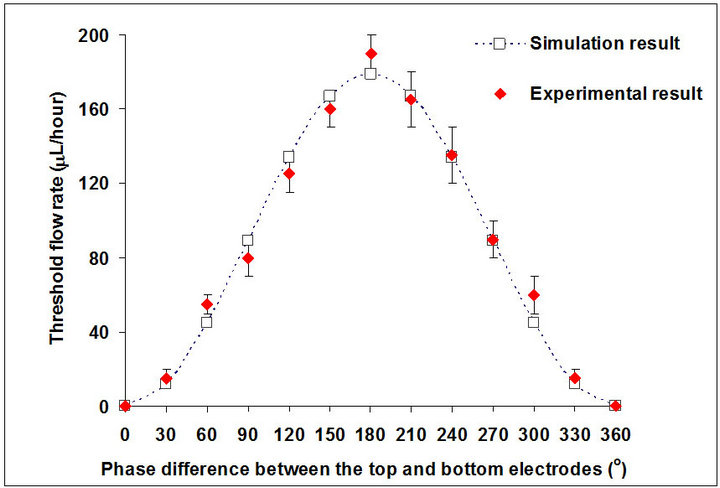
Figure 6. The relationship between the threshold flow rate Qth (µL/hour) and the phase difference between the top and bottom electrodes (degree˚).
also increased significantly. The threshold flow rate starts to decrease when the phase difference θ continuously increases from 180˚, and the value decreased back to 0 when the phase difference θ increased to 360˚. The result shows a maximum holding capability (which is approximately 180 µL/hour numerically and 190 µL/hour experimentally) was reached when the phase difference was 180˚. This is reasonable because the electric strength between the top and bottom increases when the phase difference changes from 0˚ to 180˚ and decreases when the phase difference changes from 180˚ to 360˚.
4.3. The Effect of the Height and Width of the Channel
The height and width of the channel are also important factors for the DEP gating system because these parameters determine the distribution of the DEP force in the channel. In addition, the height and width of the channel need to be considered because the distribution of the velocity is also related to the height and the width of the channel (see Equation (6)). The flow rate Q is a function of the area of the cross section. To eliminate the effect of the area of the cross section on the flow rate, we investigate the holding capability by comparing the area-independent threshold flow rate qth, which is defined as the flow rate divided by the cross sectional area (qth = Qth/Wh). We keep the width of the bottom electrode d1 as 40 µm and only change the height and width of the channel. The applied electric field is 10 Volts peak-topeak at 15 MHz. Two other ratios γ = h/d1 and the aspect ratio κ = W/h were introduced. Figure 7 shows the relationship between the area-independent threshold flow rate qth (mm/s), the ratio γ = h/d1, and the aspect ratio κ = W/h. First, we investigated the effect of the height of the channel. It was clearly shown in Figure 7 that the areaindependent threshold flow rate qth was very small when the ratio γ was larger than 2. When the ratio γ continuously decreased from 2 to 1, the increase of qth was still slow, but it was faster than the ratio γ when changed from 4 to 2. When the ratio γ was below 1, we find that qth increased very fast as γ decreased. This means that a smaller height h will cause a higher area-independent threshold flow rate qth when the bottom width of the electrodes d1 is fixed. The holding capability was significantly increased when the height h decreased to a value which was smaller than the width of the bottom electrode d1. Thus, it is necessary to decrease the height of the channel as much as possible to obtain the highest holding capability of the gate. However, for a particular application, we also need to consider the size of the particles to make sure the height of the channel is much larger than the size of particles.
We also investigated the effect of the aspect ratio . Four different values κ = 0.75, 1, 2 and 5 were considered. Figure 7 shows that the area-independent threshold flow rate, qth , increased with the increase of the aspect ratio κ, especially when the height h was smaller than the width of the electrode d1 (γ < 1). The reason is that the effect of the side wall to the distribution of the flow is less with the larger aspect ratio κ. Nevertheless, the effect was very small and can be neglected for practical values of γ, where h must be larger than the width of the electrodes.
4.4. The Effect of the Relative Positions and Sizes of Electrodes on the Top and Bottom of the Channel
In the above investigations, we used the same size for the top and bottom electrodes and also the centerlines of both electrodes are overlapped (α = 1 and β = 0). However, the size ratio of electrodes on the top and bottom and the relative position between the top and bottom electrodes will cause an asymmetric gradient of the electric field, which also affects the holding capability. To systematiccally investigate the effects of the size of electrodes and the relative positions between the top and bottom electrodes, the holding capability was investigated under different width/width ratio α and translating rate β using the validated numerical method. In the numerical simulation, the height of the channel h is 40 µm, and the width of the channel W is 200 µm. The width of the bottom electrode d1 is 40 µm. We considered different widths of the top electrode (α = 0.5, 1, 2, 3) and different translating distances of the top electrode away from the bottom electrode (β = 0, 0.5, 1, 2, 3). The applied electric field was 10 Volts peak-to-peak at 15MHz. Figure 8 shows the relationship among the threshold flow rate Qth, the width/width ratio, and the translating rate β. When β = 0 (the center of the top and bottom electrodes are overlapped), the threshold flow rate Qth corresponds to α = 1. The threshold flow rate decreased with the corresponding values of α = 1, 0.5, 2, 3. When β = 0.5, the threshold
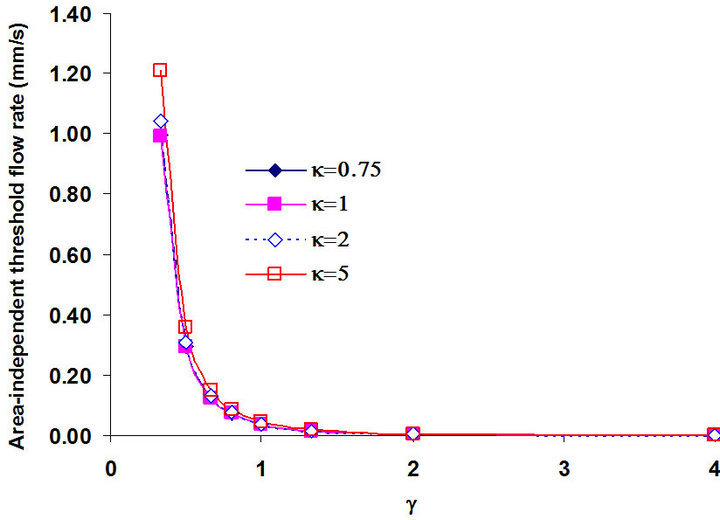
Figure 7. The relationship between the area-independent threshold flow rate qth (mm/s), the ratio γ = h/d1 and the aspect ratio κ = W/h.
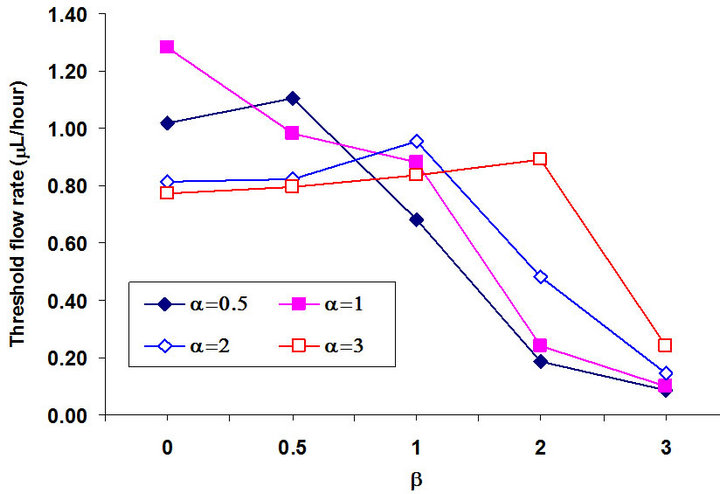
Figure 8. The relationship between the threshold flow rate Qth, (µL/hour), the width/width ratio α and the translating rate β.
flow rate, Qth,, decreased with the increase of  from 0.5 to 3. When β = 1, the largest threshold flow rate Qth corresponds to α = 2. The threshold flow rate decreased with the corresponding α = 2, 1, 3 and 0.5. When β = 0 was larger than 1 (β = 2, 3), the threshold velocity increased with the increase of α from 0.5 to 3. This means that the larger the top electrode; the larger the corresponding threshold velocity. Comparing the maximum threshold flow rate with different β indicates that the holding capability decreased from 1.28 µL/hour to 0.24 µL/hour when β increased from 0 to 3. Thus, the largest threshold velocity is 1.28 µL/hour and the corresponding parameters are α = 1 and β = 0, which indicates that electrodes equal in size with corresponding centerlines result in the largest holding capability.
It is also interesting to study the threshold zone because it is the weakest position though which the particle can pass. As shown in Figure 2(c), the threshold zone is almost independent of the x-position, but it shifts a distance ∆h from the central plane (y = 0) when the gradient of electric field is asymmetric (α ≠ 1, β ≠ 0). Figure 9 shows the distance (∆h) between the threshold zone and the central plane (y = 0) varies with different α and β. A
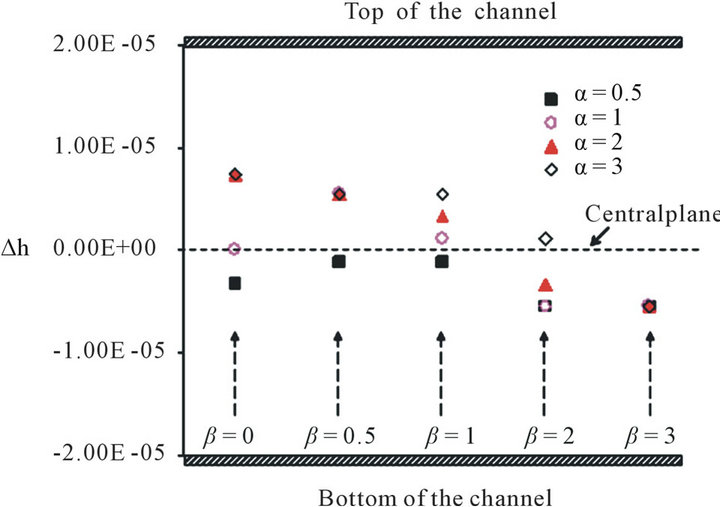
Figure 9. The relationship between ∆h, the width/width ratio α and the translating rate β.
positive value means the threshold zone is above the central plane and a negative value means the threshold zone is below the central plane. The figure shows the threshold zone is always below the center plane and near to the bottom electrode when α = 0.5 (the top electrode is smaller than the bottom electrode). For the case α = 1 (the top electrode is the same size as the bottom electrode), when β = 0, the threshold zone is located in the center plane (∆h = 0) because the gradient of the electric field is symmetric. However, the threshold zone is located above the central plane when β = 0.5, 1 and the threshold zone located below the central plane when β = 2, 3. For the case α = 2, the threshold zone is located above the central plane when β increases from 0 to 1 and is located below the central plane when β = 2, 3. For the case α = 3, the threshold zone is located above the central plane when β increases from 0 to 2 and is located below the central plane only for β = 3. Based on the analysis, we obtained a qualitative conclusion that the threshold zone is always located below the central plane when the size of the top electrode is smaller than that of the bottom electrode (α < 1), and the threshold zone is always located above the central plane when the size of the top electrode is larger than that of the bottom electrode (α > 1) for a low translating rate β. However the threshold zone will move under the central plane depending on the translating rate β.
5. Conclusion
In this paper, we studied the holding capability of a DEP gate or sorter system with a pair of parallel electrodes aligned on the top and bottom of the channel. To estimate the holding capability, a 3D numerical scheme was introduced and validated by comparing the experimental results at different applied electric potentials. This also indicates that the holding capability of DEP gate is linear with the square of applied electric potential and increases from approximately 4 µL/hour to 60 µL/hour when the applied electric potential increases from 2 Volt peak to peak to 10 Volt peak to peak. The effect of the phase difference between the top and bottom electrodes was investigated, and the result shows that the holding capability of the DEP gate increased when the phase difference between the top and bottom electrode increased from 0˚ to 180˚, and decreased when the phase difference changed from 180˚ to 360˚. A maximum holding capability (approximately 180 µL/hour in the numerical result and 190 µL/hour in the experimental result) was reached when the phase difference was 180˚. The effect of the height and width of the channel was also investigated. The result shows the holding capability was significantly increased when the height h decreased, especially smaller than the width of the electrode. However, the effect of the width of the channel is small and can be neglected when the height of the channel is larger than the width of the electrodes. Finally, the relative position and size of the top and bottom electrodes was studied. The results show the maximum holding capability is obtained when the top and bottom electrodes have the same width and the center lines of top and bottom electrodes are overlapped (α = 1 and β = 0). The results also indicate that the threshold zone will shift up or below the central plane when the gradient of electric field is asymmetric (α ≠ 1, β ≠ 0).
6. Acknowledgements
The authors would like to thank Conrad James at Sandia National Laboratories for his assistance regarding testing of the microfluidic devices. The authors would also like to thank Frances Ligler for her consultation in preparing this manuscript. We thank Sandia Laboratories for the use of the monolithic surface micromachined devices. D.B. thanks Sandia’s MESA Institute and the NSF MAGNET/SEM program for support. Sandia is a multiprogam laboratory operated by Sandia Corporation, a Lockheed Martin Company, for the United States Department of Energy under Contract No. DE-ACo4-94-AL8500.
REFERENCES
- A. A. Manz, N. Graber and H. M. Widmer, “Miniaturized Total Chemical Analysis Systems: A Novel Concept for Chemical Sensing,” Sensors and actuators B: Chemical, Vol. 1, No. 1-6, 1990, pp. 244-248. doi:10.1016/0925-4005(90)80209-I
- K. Asami, “Characterization of Biological Cells by Dielectric Spectroscopy,” Journal of Non-Crystalline Solids, Vol. 305, No. 1-3, 2002, pp. 268-277. doi:10.1016/S0022-3093(02)01110-9
- L. Yang, C. Ruan and Y. Li, “Detection of Viable Salmonella typhimurium by Impedance Measurement of Electrode Capacitance and Medium Resistance,” Biosensors and Bioelectronics, Vol. 19, No. 5, 2003, pp. 495- 502. doi:10.1016/S0956-5663(03)00229-X
- C. L. Asbury, A. H. Diercks and G. Van den Engh, “Trapping of DNA by Dielectrophoresis,” Electrophoresis, Vol. 23, No. 16, 2002, pp. 2658-2666. doi:10.1002/1522-2683(200208)23:16<2658::AID-ELPS2658>3.0.CO;2-O
- B. Prasad, S. Du, W. Badawy and K. V. I. S. Kaler, “A Real-Time Multiple-Cell Tracking Platform for Dielectrophoresis (DEP)-Based Cellular Analysis,” Measurement Science and Technology, Vol. 16, No. 4, 2005, Article ID: 909. doi:10.1088/0957-0233/16/4/003
- J. Suehiro, R. Hamada, D. Noutomi, M. Shutou and M. Hara, “Selective Detection of Viable Bacteria Using Dielectrophoretic Impedance Measurement Method,” Journal of Electrostatics, Vol. 57, No. 2, 2003, pp. 157-168. doi:10.1016/S0304-3886(02)00124-9
- L. Cui, D. Holmes and H. Morgan, “The Dielectrophoretic Levitation and Separation of Latex Beads in Microchips,” Electrophoresis, Vol. 22, No. 18, 2001, pp. 3893- 3901. doi:10.1002/1522-2683(200110)22:18<3893::AID-ELPS3893>3.0.CO;2-2
- P. R. C. Gascoyne and J. Vykoukal, “Particle Separation by Dielectrophoresis,” Electrophoresis, Vol. 23, No. 13, 2002, pp. 1973-1983. doi:10.1002/1522-2683(200207)23:13<1973::AID-ELPS1973>3.0.CO;2-1
- G. H. Markx, R. Pethig and J. Rousselet, “The Dielectrophoretic Levitation of Latex Beads, with Reference to Field-Flow Fractionation,” Journal of Physics D: Applied Physics, Vol. 30, No. 17, 1999, Article ID: 2470. doi:10.1088/0022-3727/30/17/013
- P. Van Gerwen, W. Laureyn, W. Laureys, G. Huyberechts, M. Op De Beeck, K. Baert, J. Suls, W. Sansen, P. Jacobs and L. Hermans, “Nanoscaled Interdigitated Electrode Arrays for Biochemical Sensors,” Sensors and Actuators B: Chemical, Vol. 49, No. 1-2, 1998, pp. 73-80. doi:10.1016/S0925-4005(98)00128-2
- X.-B. Wang, J. Vykoukal, F. F. Becker and P. R. C. Gascoyne, “Separation of Polystyrene Microbeads Using Dielectrophoretic/Gravitational Field-Flow-Fractionation,” Biophysical Journal, Vol. 74, No. 5, 1998, pp. 2689-2701. doi:10.1016/S0006-3495(98)77975-5
- S. Choi and J.-K. Park, “Microfluidic System for Dielectrophoretic Separation Based on a Trapezoidal Electrode array,” Lab on a Chip, Vol. 5, No. 10, 2005, pp. 1161-1167. doi:10.1039/b505088j
- I. Doh and Y.-H. Cho, “A Continuous Cell Separation Chip Using Hydrodynamic Dielectrophoresis (DEP) Process,” Sensors and Actuators A: Physical, Vol. 121, No. 1, 2005, pp. 59-65. doi:10.1016/j.sna.2005.01.030
- J. G. Kralj, M. T. W. Lis, M. A. Schmidt and K. F. Jensen, “Continuous Dielectrophoretic Size-Based Particle Sorting,” Analytical chemistry, Vol. 78, No. 14, 2006, pp. 5019-5025. doi:10.1021/ac0601314
- S. Fiedler, S. G. Shirley, T. Schnelle and G. N. Fuhr, “Dielectrophoretic Sorting of Particles and Cells in a Microsystem,” Analytical chemistry, Vol. 70, No. 7, 1998, pp. 1909-1915. doi:10.1021/ac971063b
- T. Müller, G. Gradl, S. Howitz, S. Shirley, T. Schnelle and G. Fuhr, “A 3-D Microelectrode System for Handling and Caging Single Cells and Particles,” Biosensors and Bioelectronics, Vol. 14, No. 3, 1999, pp. 247-256. doi:10.1016/S0956-5663(99)00006-8
- T. Schnelle, R. Hagedorn, G. n. Fuhr, S. Fiedler and T. Müller, “Three-Dimensional Electric Field Traps for Manipulation of Cells-Calculation and Experimental Verification,” Biochimica et Biophysica Acta (BBA)-General Subjects, Vol. 1157, No. 3, 1993, pp. 127-140. doi:10.1016/0304-4165(93)90056-E
- J. Suehiro and R. Pethig, “The Dielectrophoretic Movement and Positioning of a Biological Cell Using a ThreeDimensional Grid Electrode System,” Journal of Physics D: Applied Physics, Vol. 31, No. 22, 1999, Article ID: 3298. doi:10.1088/0022-3727/31/22/019
- D. J. Bennett, B. Khusid, C. D. James, P. C. Galambos, M. Okandan, D. Jacqmin and A. Acrivos, “Combined FieldInduced Dielectrophoresis and Phase Separation for Manipulating Particles in Microfluidics,” Applied Physics Letters, Vol. 83, No. 23, 2003, pp. 4866-4868. doi:10.1063/1.1629789
- C. D. James, M. Okandan, P. Galambos, S. S. Mani, D. Bennett, B. Khusid and A. Acrivos, “Surface Micromachined Dielectrophoretic Gates for the Front-End Device of a Biodetection System,” Journal of Fluids Engineering, Vol. 128, No. 1, 2006, pp. 14-19. doi:10.1115/1.2136924
- H. Song, V. Mulukutla, C. D. James and D. J. Bennett, “Continuous-Mode Dielectrophoretic Gating for Highly Efficient Separation of Analytes in Surface Micromachined Microfluidic Devices,” Journal of Micromechanics and Microengineering, Vol. 18, No. 12, 2008, Article ID: 125013. doi:10.1088/0960-1317/18/12/125013
- D. Chen and H. Du, “A Dielectrophoretic Barrier-Based Microsystem for Separation of Microparticles,” Microfluidics and Nanofluidics, Vol. 3, No. 3, 2007, pp. 603- 610. doi:10.1007/s10404-007-0151-x
- D. F. Chen, H. Du and W. H. Li, “A 3D Paired Microelectrode Array for Accumulation and Separation of Microparticles,” Journal of Micromechanics and Microengineering, Vol. 16, No. 7, 2006, Article ID: 1162. doi:10.1088/0960-1317/16/7/008
- M. Li, S. Li, W. Cao, W. Li, W. Wen and G. Alici, “Improved Concentration and Separation of Particles in a 3D Dielectrophoretic Chip Integrating Focusing, Aligning and Trapping,” Microfluidics and Nanofluidics, Vol. 14, No. 3-4, 2013, pp. 527-539. doi:10.1007/s10404-012-1071-y
- D. R. Albrecht, R. L. Sah and S. N. Bhatia, “Geometric and Material Determinants of Patterning Efficiency by Dielectrophoresis,” Biophysical Journal, Vol. 87, No. 4, 2004, pp. 2131-2147. doi:10.1529/biophysj.104.039511
- J. Voldman, R. A. Braff, M. Toner, M. L. Gray and M. A. Schmidt, “Holding Forces of Single-Particle Dielectrophoretic Traps,” Biophysical Journal, Vol. 80, No. 1, 2001, pp. 531-542. doi:10.1016/S0006-3495(01)76035-3
- C. Yu, J. Vykoukal, D. M. Vykoukal, J. A. Schwartz, L. Shi and P. R. C. Gascoyne, “A Three-Dimensional Dielectrophoretic Particle Focusing Channel for Microcytometry Applications,” Journal of Microelectromechanical Systems, Vol. 14, No. 3, 2005, pp. 480-487.
- N. G. Green, A. Ramos and H. Morgan, “AC Electrokinetics: A Survey of Sub-Micrometre Particle Dynamics,” Journal of Physics D: Applied Physics, Vol. 33, No. 6, 2000, Article ID: 632. doi:10.1088/0022-3727/33/6/308
- T. B. Jones, “Electromechanics of Particles,” Cambridge University Press, England, 2005.
- S. K. Cushing, J. Li, F. Meng, T. R. Senty, S. Suri, M. Zhi, M. Li, A. D. Bristow and N. Wu, “Photocatalytic Activity Enhanced by Plasmonic Resonant Energy Transfer from Metal to Semiconductor,” Journal of the American Chemical Society, Vol. 134, No. 36, 2012, pp. 15033-15041. doi:10.1021/ja305603t
- S. Hu, Y. Li, K. M. Rosso and M. L. Sushko, “Mesoscale Phase Field Modeling of Charge Transport in Nanocomposite Electrodes for Lithium-Ion Batteries,” The Journal of Physical Chemistry C, Vol. 117, No. 1, 2013, pp. 28-40. doi:10.1021/jp3068014
- J. Li, S. K. Cushing, J. Bright, F. Meng, T. R. Senty, P. Zheng, A. D. Bristow and N. Wu, “Ag@Cu2O CoreShell Nanoparticles as Visible-Light Plasmonic Photocatalysts,” ACS Catalysis, Vol. 3, No. 1, 2012, pp. 47-51. doi:10.1021/cs300672f
- J. H. Nieuwenhuis and M. J. Vellekoop, “Simulation Study of Dielectrophoretic Particle Sorters,” Sensors and actuators B: Chemical, Vol. 103, No. 1-2, 2004, pp. 331- 338. doi:10.1016/j.snb.2004.04.062
- A. Castellanos, A. Ramos, A. Gonzalez, N. G. Green and H. Morgan, “Electrohydrodynamics and Dielectrophoresis in Microsystems: Scaling Laws,” Journal of Physics D: Applied Physics, Vol. 36, No. 36, 2003, Article ID: 2584. doi:10.1088/0022-3727/36/20/023
NOTES
*Corresponding authors.