Advances in Alzheimer's Disease
Vol.1 No.3(2012), Article ID:25947,8 pages DOI:10.4236/aad.2012.13007
Comparison of protein concentrations in serum versus plasma from Alzheimer’s patients*
![]()
1Department of Surgery, University of Texas Southwestern Medical Center, Dallas, USA; #Corresponding Author: robert.barber@unthsc.edu
2Department of Clinical Sciences, University of Texas Southwestern Medical Center, Dallas, USA
3Departments of Genetics and Neurology, The Carolina Center for Genome Sciences and the Bowles Center for Alcohol Studies, University of North Carolina, Chapel Hill, USA
4Center for Neuroscience and Regenerative Medicine, Uniformed Services University of the Health Sciences, Bethesda, USA
5Department of Academic and Institutional Resources and Technology, University of North Texas Health Science Center, Fort Worth, USA
6Department of Internal Medicine, University of North Texas Health Science Center, Fort Worth, USA
7Institute for Aging and Alzheimer’s Disease Research, University of North Texas Health Science Center, Fort Worth, USA
8Department of Pharmacology and Neuroscience, University of North Texas Health Science Center, Fort Worth, USA
Received 15 October 2012; revised 20 November 2012; accepted 27 November 2012
Keywords: Alzheimer’s Disease; Serum Proteins; Plasma Proteins
ABSTRACT
Background: There is great interest in developing blood-based biomarkers for Alzheimer’s disease (AD); however, there is no consensus as to what blood fraction is most appropriate for analyzing particular markers. The current study provides empirical evidence regarding how bloodbased proteins vary depending on whether they are assayed in serum or plasma. Methods: We analyzed concentrations of 100 proteins in matched samples of serum and plasma from 39 Caucasian AD participants from the Texas Alzheimer’s Research and Care Consortium by multiplex immunoassay. Results: Concentrations of 40 proteins were highly correlated (r2 ≥ 0.75) between plasma and serum while the remaining proteins were moderately to weakly correlated (r2 < 0.75). Discussion: Whether plasma vs. serum is assayed can have a large impact on the observed concentration of some proteins, including several proteins that are of great interest to AD pathophysiology. The current findings may explain the significant discrepancies oftentimes reported in the AD biomarker field.
1. INTRODUCTION
Over the last several decades, there has been an explosion in the search for biomarkers of AD using many modalities, including blood. Blood-based biomarkers have the advantage of being readily available, less invasive, and less expensive than imaging and cerebrospinal fluid (CSF) markers. There are many potential uses for biomarkers of AD including, but not limited to, diagnostics, prognostics, monitoring treatment response, improving clinical trial design, indirect measurements of therapeutic efficacy, and epidemiological screening [1,2]. However, to date there is no consensus as to what blood fraction (i.e. serum or plasma) is best for which marker. There is minimal standardization of the methods for collecting either serum or plasma. Both serum and plasma have been used on many putative AD markers. The inconsistency in sample processing may be a major underlying cause for the conflicting evidence plaguing the bloodbased biomarker literature. As an example, while beta amyloid (Aβ) has typically been examined in plasma [3], it has also been assayed in serum [4]. Brain derived neurotrophic factor (BDNF), levels, which vary greatly between serum and plasma, have also been examined in both blood fractions in relation to cognition and AD with inconsistent findings [5,6]. The Alzheimer’s disease Neuroimaging Initiative (ADNI) is creating standardized protocols for managing and analyzing CSF biomarkers of AD; but a similar effort has not been made for bloodbased biomarkers in this field.
The current study was undertaken as a first-step towards empirically evaluating the performance of a range of proteins among AD cases across both serum and plasma, using multiplexed immunoassays. Here, we measured the concentrations of 100 proteins in matched samples of plasma and serum collected from 39 Caucasian individuals diagnosed with probable Alzheimer’s disease.
2. METHODS
2.1. Ethics Statement
Institutional Review Board approval was obtained at each site (University of Texas Southwestern Medical Center Institutional Review Board, University of North Texas Health Science Center Institutional Review Board, Texas Tech University Health Science Center Institutional Review Board, Baylor College of Medicine Institutional Review Board, University of Texas Health Science Center at San Antonio Institutional Review Board) and written informed consent was obtained for all participants from their designated representative.
2.2. Participants
Participants included 39 Caucasian individuals diagnosed with probable Alzheimer’s disease (AD) enrolled in the Texas Alzheimer’s Research and Care Consortium (TARCC) longitudinal research study. The methodology of the TARCC project has been described in detail elsewhere [7]. Briefly, each participant underwent a standardized annual examination at the respective site that includes a medical evaluation, neuropsychological testing, and interview. Diagnosis of AD status was based on NINCDS-ADRDA criteria [8]. Each participant also provided blood for isolation of serum and plasma. TARCC member institutions include: Baylor College of Medicine, Houston; Texas Tech University Health Science Center, Lubbock; the University of North Texas Health Science Center at Fort Worth; the University of Texas Southwestern Medical Center at Dallas; the University of Texas Health Science Center—San Antonio.
2.3. Assays
Paired, non-fasting blood samples were collected in EDTA anti-coagulated as well as serum-separation tubes during clinical evaluations. Blood in EDTA tubes was centrifuged immediately for isolation of plasma. Blood in serum-separation tubes was allowed to clot at room temperature for 30 minutes prior to centrifugation to separate serum. Plasma and serum samples were divided into 1 milliliter aliquots and stored at −80˚C in polypropylene vials. Specimens were sent frozen to Rules Based Medicine (RBM; Austin, TX) where blood proteins were measured using their multiplexed immunoassay human Multi-Analyte Profile (humanMAP). The complete list of the 100 measured analytes is provided in Appendix 1. Multiple proteins were quantified simultaneously by multiplex fluorescent immunoassay utilizing colored microspheres with protein-specific antibodies. Information regarding the least detectable dose (LDD), inter-run coefficient of variation, dynamic range, overall spiked standard recovery, and cross-reactivity with other human MAP analytes can be obtained from Rules Based Medicine (www.rulesbasedmedicine.com).
2.4. Statistical Analyses
Analyses were performed using R (V 2.10) statistical software [9]. Only proteins with 20 or more non-missing data points for serum and plasma were utilized in the analyses. First, all biomarker data were transformed using Box-Cox transformations. Next, Pearson bivariate correlations were conducted between serum and plasma proteins to determine the correlations of markers across blood fractions and density plots were derived using kernel density estimates from R (V 2.10) statistical software. Finally, Bayesian Information Content (BIC) was then calculated to determine the number of significant clusters present within the distribution of correlation coefficients.
2.5. Pathway Analysis
Ingenuity Pathway Analysis and the Integrated Pathway Analysis Database (IPAD) [10] were used for building networks. Fisher’s exact test is used to test the statistical significance for association between the network sets for highand low-correlation proteins [11].
3. RESULTS
Demographic characteristics of the study participants are shown in Table 1. The cohort was exclusively Caucasian and 60% female. Median (range) age at time of visit and years of education for study participants were 79.5 (57 - 91) and 16 (0 - 20) years, respectively. Approximately 50% of the study participants were ApoE4 negative; 35% were heterozygous and 13% were homozygous for the ApoE ε4 allele. Median (range) MMSE, CDR Sum of Boxes and CDR global scores were 18 (3 - 29), 9.0 (1 - 18) and 1.0 (0.5 - 3.0), respectively.
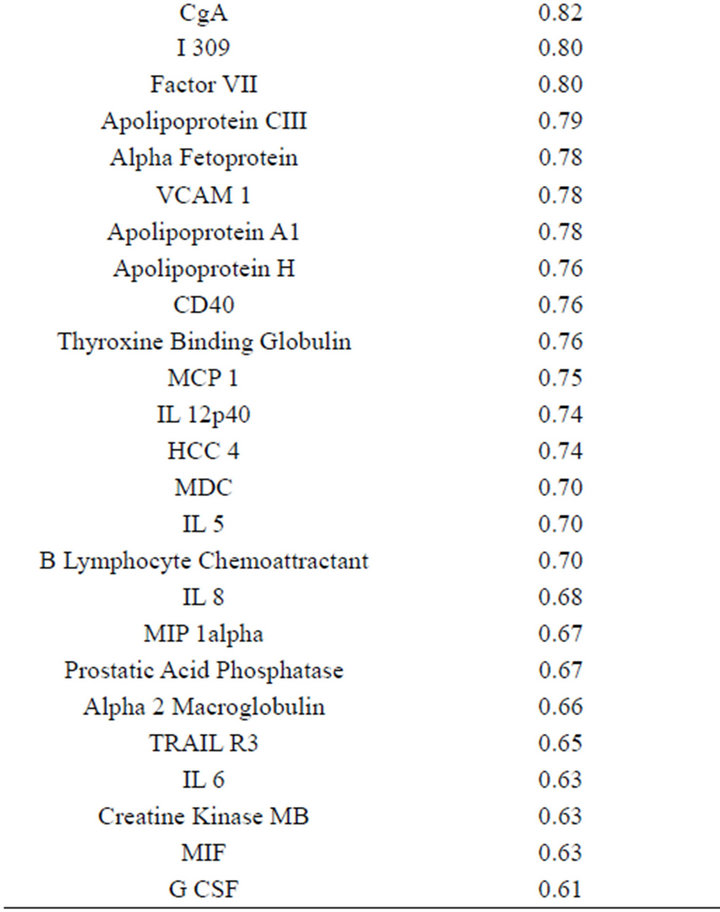
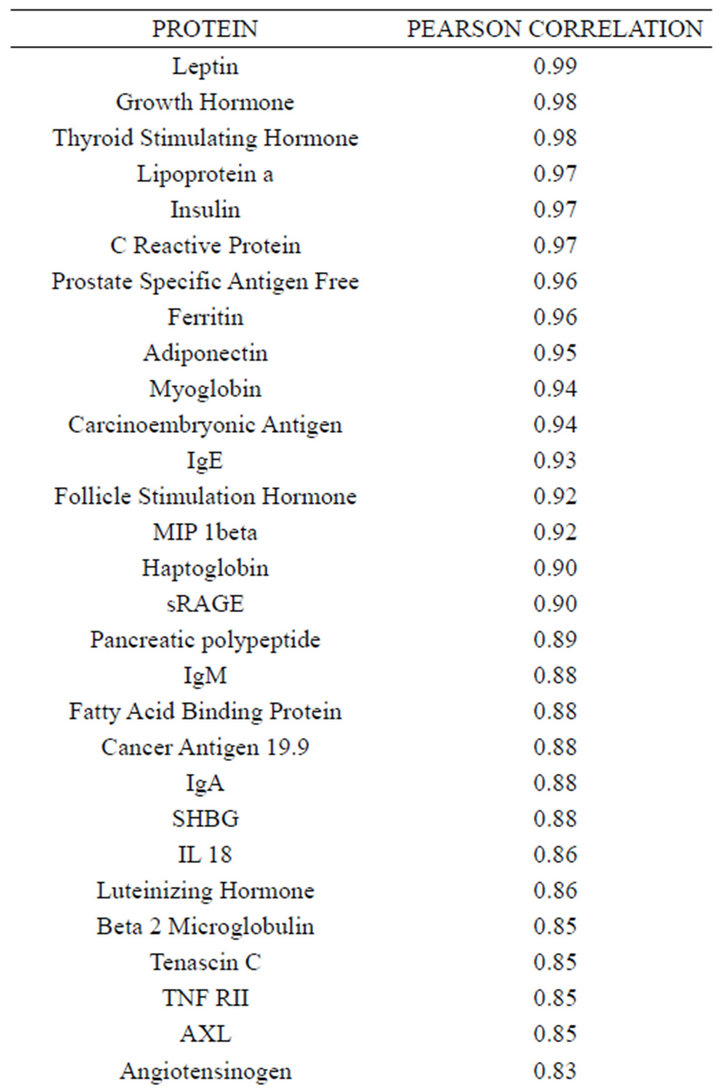
Concentrations of a number of proteins (40) were highly correlated (r2 ≥ 0.75) between plasma and serum
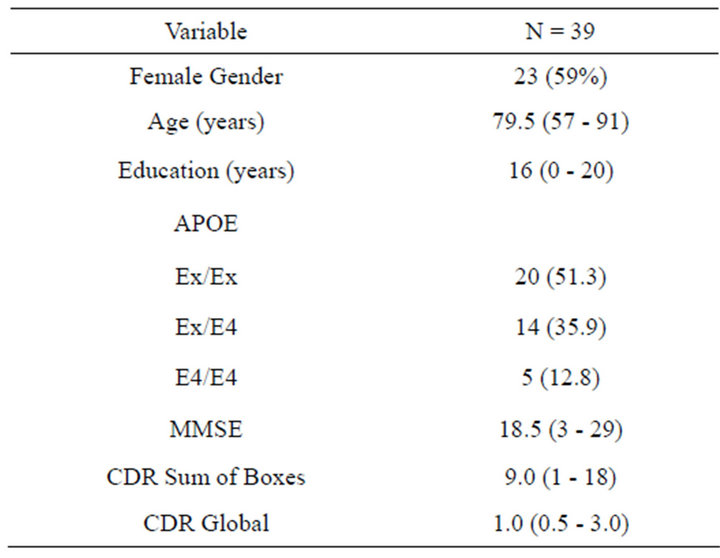
Table 1. Demographic information for 39 Caucasian participants diagnosed with probable Alzheimer’s disease in the TARCC longitudinal research cohort. Data are presented as count and percent or median and range.
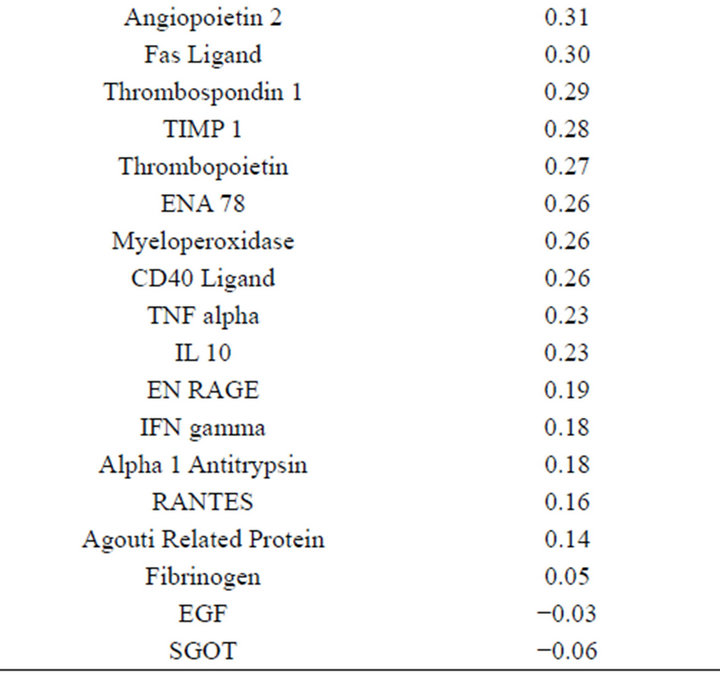
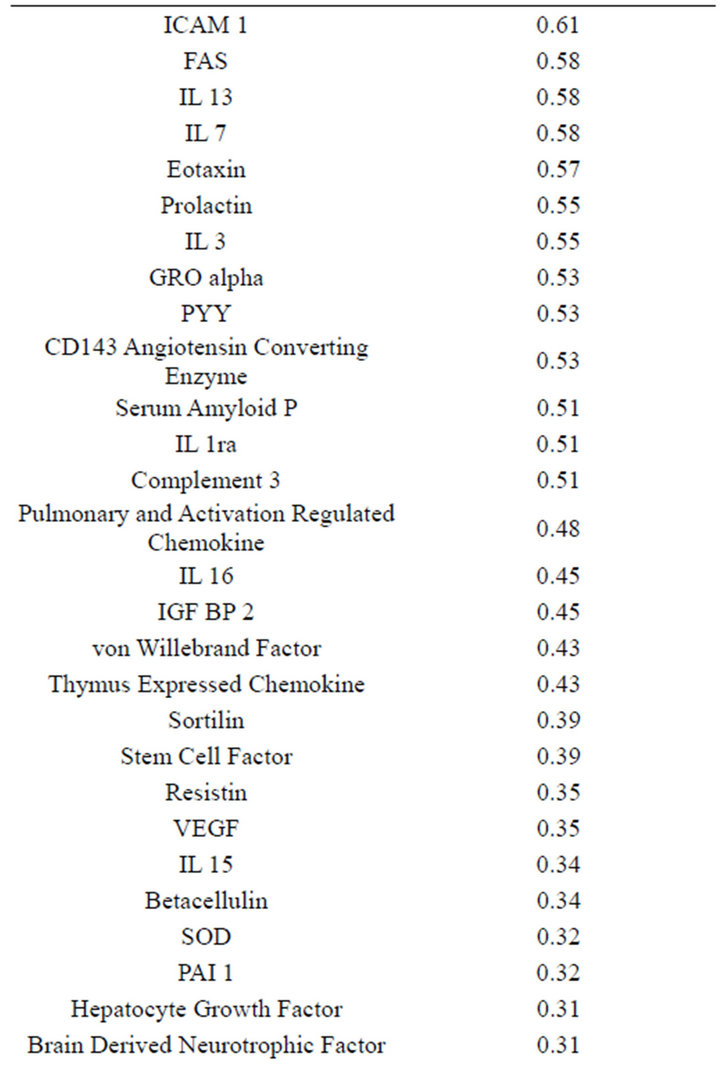
(Table 2). However, a substantial number (33) were weakly conserved (r2 ≤ 0.5) across blood fractions (Figure 1). The BIC was maximized when the number of clusters equaled two (Figure 2). Based on this fact, we separated the proteins into two groups, one corresponding to low correlation protein group (red line in Figure 1) and the other corresponding to high correlation protein group (green line in Figure 1). The entire list of proteins is included in Appendix 1, along with correlation coefficients between serum and plasma. Further pathway and network analysis revealed that several common genetic pathways and networks were associated with the two groups. For the high correlation protein group, the top 3 networks were: 1) Antigen Presentation, Cell-to-Cell Signaling and Interaction, Hematological System Development and Function; 2) Cell Signaling, Molecular Transport, Nucleic Acid Metabolism; and 3) Cellular Development, Hematopoiesis, Cell-to-Cell Signaling and Interaction (Figure 3). For the low correlation protein group, the top 3 networks were 1) Cellular Development, Hematological System Development and Function, Hematopoiesis, 2) Inflammatory Response, Carbohydrate Metabolism, Molecular Transport, and 3) Antimicrobial Response, Inflammatory Response, Cell-to-Cell Signaling and Interaction (Figure 4). We also identified 5 pathways in the high correlation protein group and 20 pathways in the low correlation protein group. 5 out of 5 pathways in the high correlation protein group are in common between the two groups. They are cytokinecytokine receptor interaction, Malaria, Asthma, African trypanosomiasis, and Allograft rejection. The 15 pathways which are enriched in the low correlation protein group but not in the high correlation protein group are Chemokine signaling pathway, Toll-like receptor signaling pathway, NOD-like receptor signaling pathway, Jak-
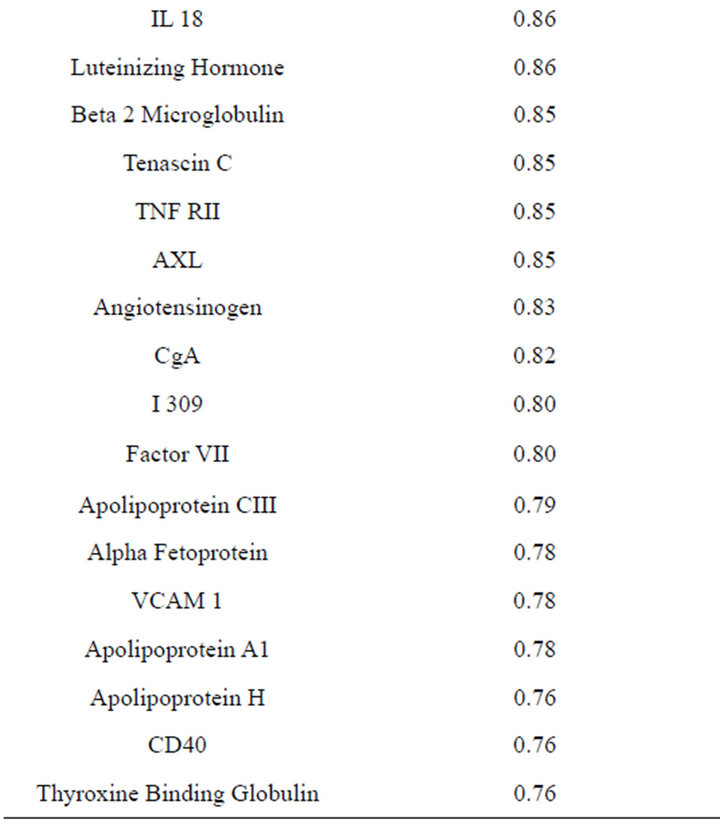
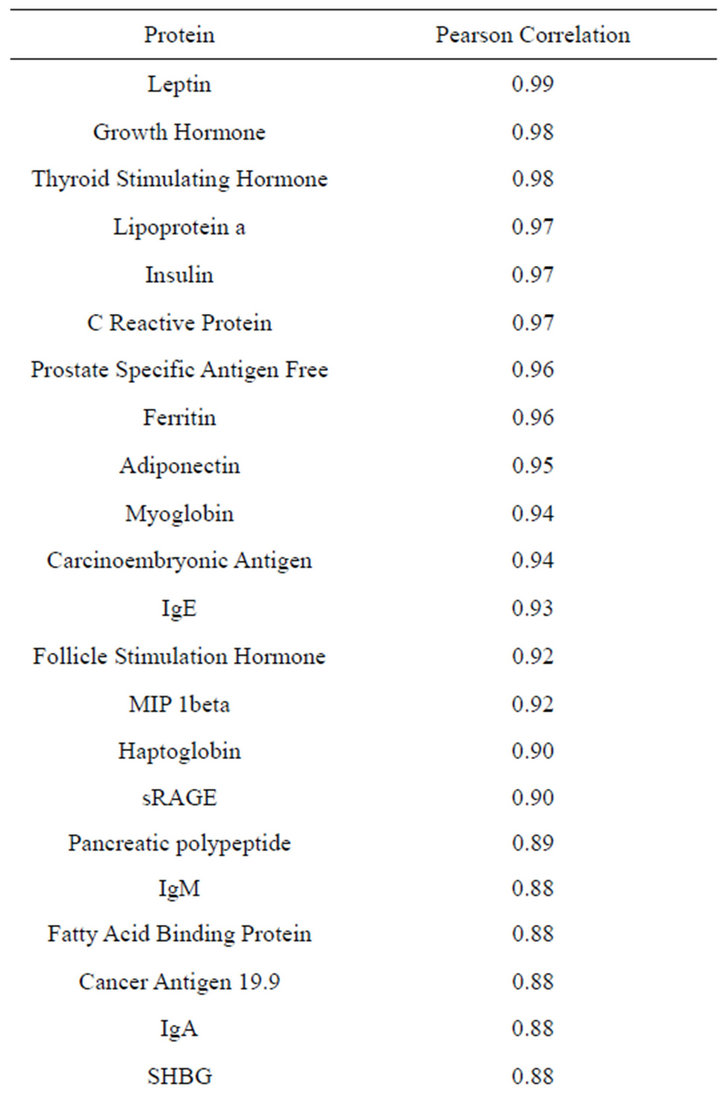
Table 2. Blood proteins conserved between plasma and serum with correlation coefficients (r2) ≥ 0.75.
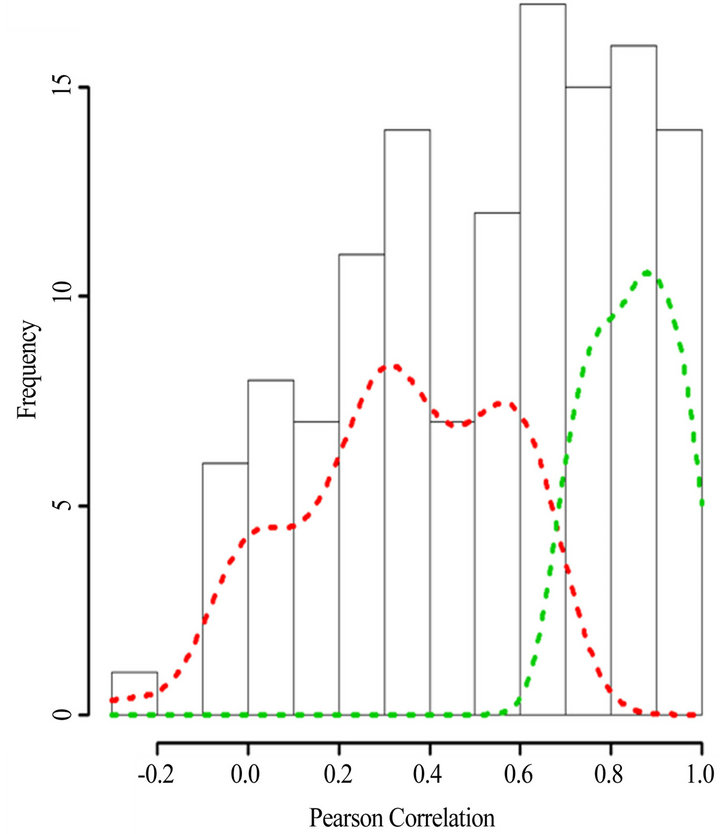
Figure 1. Histogram of the Pearson’s correlation coefficients between the protein concentrations in serum versus plasma. The dash lines indicate the density plots of the low correlation protein group (red) and high corretion protein group (green). Density plots were derived using kernel density estimates from R (V 2.10) statistical software.
STAT signaling pathway, Hematopoietic cell lineage, Intestinal immune network for IgA production, Pertussis, Legionellosis, Chagas disease (American trypanosomeasis), Amoebiasis, Measles,Influenza A, Herpes simplex infection, Autoimmune thyroid disease, and Rheumatoid arthritis. The results show that the high and low conser-
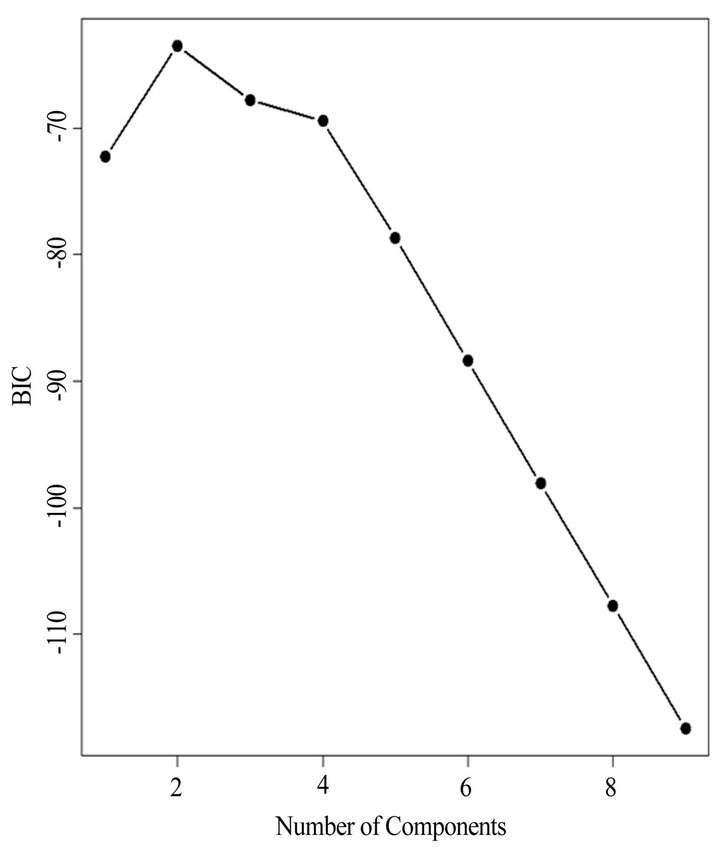
Figure 2. The Bayesian information criterion (BIC) vs. differrent number of clusters. The “E” stands for equal volume clusters and “V” stands for “variable” volume clusters. The figure indicates the BIC is maximized as the number of cluster equals two. Based on this fact, we separated the proteins into two groups, one corresponding to low correlation protein group (red line in Figure 1) and the other corresponding to high correlation protein group (green line in Figure 1).
ved protein groups are more conserved at the pathway/network level, relative to protein changes at the molecular level.
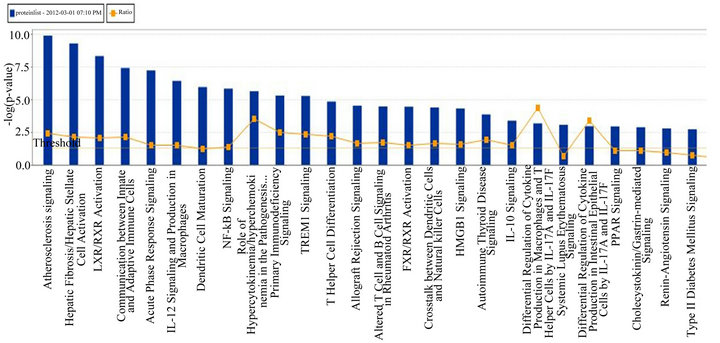
Figure 3. Top 3 networks for the high correlation protein groups.
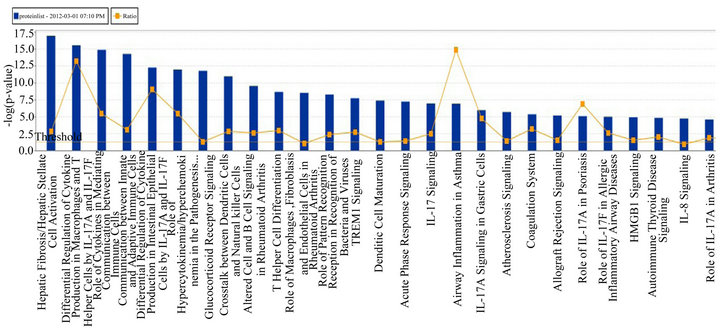
Figure 4. Top 3 networks for the low correlation protein groups.
4. DISCUSSION
The role of many proteins in AD, particularly inflammatory markers and neurotrophic factors has received a great deal of attention in recent years with numerous reports linking these proteins to AD status as well as cognitive dysfunction and/or decline [12-17]. However, these findings are not always consistent with some reports finding significant associations with specific markers, but not others [18,19]. The current findings highlight that the levels of many proteins are not consistent across blood fractions among those with AD and may explain some of the contradictory findings within the literature.
Examining the correlation between serum and plasma in previous studies that utilized the same Rules Based Medicine discovery panel revealed differing levels of correlation for analytes that contributed strongly to algorithms that were diagnostic for AD. For instance, O’Bryant et al. utilized 30 blood proteins to develop their Alzheimer’s diagnostic algorithm [20]. Of the top 15 proteins that contributed most strongly to the algorithm, six were poorly correlated (r < 0.5) and 5 proteins were moderately correlated (0.5 < r < 0.75) across blood fractions. However, when focusing on 11 proteins that were highly correlated between blood fractions, it was possible to develop a screening algorithm for the Alzheimer’s disease Neuroimaging Initiative (ADNI) cohort, which measured plasma proteins [21]. This achievement was notable as the first blood-based diagnostic algorithm for AD to be validated in an independent cohort, as well as across blood fractions.
While the choice of which blood fraction to measure can have important implications, the selection of serum or plasma ultimately depends upon the protein or proteins under investigation. In some instances, this choice is relatively easy. For example, if a protein is known to be bound by platelets, as is the case for BDNF, measurement of serum yields the total concentration in the blood, while measurement of plasma yields data on free or circulating BDNF. In other cases, the selection of which blood fraction to measure is not clear. These results suggest that if no prior knowledge of the behavior of a candidate protein is known, a pilot data set comparing data from each blood fraction should be generated and analyzed.
Another important consideration is sample processing. While this issue does not directly impact the correlation between serum and plasma concentrations, it is frequently more important than selection of which blood fraction to evaluate. Several factors should be assessed and incorporated into the design of experiments focusing on measurements of blood proteins. First, sample processing should take place as quickly as possible after blood collection and within a maximum of 60 minutes. Next, polystyrene should be fastidiously avoided, in favor of polypropylene. This is important, as many proteins are known to bind polystyrene and will be removed from the assay fluid of they come into contact with this form of plastic. Third, the centrifugation speed for isolation of serum or plasma from blood needs to be high enough to achieve good separation of the blood components, but not so high as to crush platelets and red blood cells. Centrifugation speeds between 1500 and 2000 X g are preferable. Finally, samples should be stored at −80˚C awaiting assay and multiple freeze-thaw cycles should be avoided to prevent sample degradation.
This study suffered several limitations, including assessment of only individuals with a diagnosis of Alzheimer’s Disease. However, while individuals with Alzheimer’s has been shown to have altered concentrations of a number of serum and plasma proteins relative to controls, there is no reason to suspect that Alzheimer’s disease alters the correlation between plasma and serum concentrations of individual proteins. In addition, a relatively small number of proteins were measured. Nevertheless, as the degree of correlation between plasma and serum concentrations was not part of the criteria for selection of proteins for the panel; we anticipate that our results are generalizable for the majority of proteins. We would therefore anticipate that the concentrations of less than half of all proteins are highly correlated (r2 > 0.75) between serum and plasma.
Some of the uncertainty surrounding the relationship of certain proteins to Alzheimer’s disease pathophysiology may be due to a lack of standardized protocols for protein measurement, particularly which blood fraction (plasma or serum) is assessed. The fraction of blood measured (plasma vs. serum) can have a large impact on the observed concentration of some proteins. Some of these differences were anticipated; clotting factors were lower and platelet-bound proteins higher in serum, relative to plasma. However, many others were not expected to differ to the degree observed, including several proteins that are of great interest in Alzheimer’s disease. Examples of such proteins include interleukin 6, tumor necrosis factor-alpha, and interferon gamma and granulocyte colony stimulating factor. These findings point out the need for research specifically aimed at identification of the most appropriate medium for examining particular biomarkers. Such an effort would, in the long run, be aimed at the development of standardized protocols to be utilized across research groups and projects in an effort to better understand biomarkers of AD.
5. ACKNOWLEDGEMENTS
This study was made possible by the Texas Alzheimer’s Research and Care Consortium (TARCC) funded by the state of Texas through the Texas Council on Alzheimer’s disease and Related Disorders. Research reported in this publication was also supported in part by the National Institute on Aging of the National Institutes of Health. Investigators at the University of Texas Southwestern Medical Center at Dallas (GX, RMH) acknowledge support from the UTSW Alzheimer’s disease Center; NIH, NIA grant P30AG12300. Investigators at the University of North Texas Health Science Center at Dallas (SEO) acknowledge support from NIA, NIA grant R01AG039389. The investigators would also like to thank Drs. Ralph McDade and Sam LaBrie with Myriad Rules Based Medicine. The content is solely the responsibility of the authors and does not necessarily represent the official views of any funding agency, including the National Institutes of Health.
REFERENCES
- Shaw, L.M., Korecka, M., Clark, C.M., Lee, V.M. and Trojanowski, J.Q. (2007) Biomarkers of neurodegeneration for diagnosis and monitoring therapeutics. Nature Reviews Drug Discovery, 6, 295-303. doi:10.1038/nrd2176
- Thal, L.J., Kantarci, K., Reiman, E.M., Klunk, W.E., Weiner, M.W., Zetterberg, H., Galasko, D., Pratico, D., Griffin, S., Schenk, D. and Siemers, E. (2006) The role of biomarkers in clinical trials for Alzheimer disease. Alzheimer Disease and Associated Disorders, 20, 6-15. doi:10.1097/01.wad.0000191420.61260.a8
- Mayeux, R., Honig, L.S., Tang, M.X., Manly, J., Stern, Y., Schupf, N. and Mehta, P.D. (2003) Plasma A[beta]40 and A[beta]42 and Alzheimer’s disease: Relation to age, mortality, and risk. Neurology, 61, 1185-1190. doi:10.1212/01.WNL.0000091890.32140.8F
- Luis, C.A., Abdullah, L., Paris, D., Quadros, A., Mullan, M., Mouzon, B., Ait-Ghezala, G. and Crawford, F. (2009) Serum beta-amyloid correlates with neuropsychological impairment. Aging, Neuropsychology, and Cognition: A Journal on Normal and Dysfunctional Development, 16, 203-218. doi:10.1080/13825580802411766
- Laske, C., Stransky, E., Leyhe, T., Eschweiler, G.W., Wittorf, A., Richartz, E., Bartels, M., Buchkremer, G. and Schott, K. (2006) Stage-dependent BDNF serum concentrations in Alzheimer’s disease. Journal of Neural Transmission, 113, 1217-1224. doi:10.1007/s00702-005-0397-y
- O’Bryant, S.E., Hobson, V.L., Hall, J.R., Barber, R.C., Zhang, S., Johnson, L. and Diaz-Arrastia, R. (2011) Serum brain-derived neurotrophic factor levels are specifically associated with memory performance among Alzheimer’s disease cases. Dementia and Geriatric Cognitive Disorders, 31, 31-36. doi:10.1159/000321980
- Waring, S., O’Bryant, S.E., Reisch, J.S., Diaz-Arrastia, R., Knebl, J. and Doody, R. (2008) The Texas Alzheimer’s Research Consortium longitudinal research cohort: Study design and baseline characteristics. Texas Public Health Journal, 60, 9-13.
- McKhann, D., Drockman, D. and Folstein, M., et al. (1984) Clinical diagnosis of Alzheimer’s disease: Report of the NINCDS-ADRDA Work Group. Neurology, 34, 939-944. doi:10.1212/WNL.34.7.939
- R Development Core Team (2009) R: A language and environment for statistical computing. R Foundation for Statistical Computing, Vienna, 409.
- Zhang, F. and Drabier, R. (2012) IPAD: The integrated pathway analysis database for systematic enrichment analysis. BMC Bioinformatics, 13, S7. doi:10.1186/1471-2105-13-S15-S7
- Mehta, C.R., Patel, N.R. and Tsiatis, A.A. (1984) Exact significance testing to establish treatment equivalence with ordered categorical data. Biometrics, 40, 819-825. doi:10.2307/2530927
- Komulainen, P., Lakka, T.A., Kivipelto, M., Hassinen, M., Penttila, I.M., Helkala, E.L., Gylling, H., Nissinen, A. and Rauramaa, R. (2007) Serum high sensitivity C-reactive protein and cognitive function in elderly women. Age & Ageing, 36, 443-448. doi:10.1093/ageing/afm051
- Schmidt, R., Schmidt, H., Curb, J.D., Masaki, K., White, L.R. and Launer, L.J. (2002) Early inflammation and dementia: A 25-year follow-up of the Honolulu-Asia aging study. Annals of Neurology, 52, 168-174. doi:10.1002/ana.10265
- Newman, A.B., Fitzpatrick, A.L., Lopez, O., Jackson, S., Lyketsos, C., Jagust, W., Ives, D., Dekosky, S.T. and Kuller, L.H. (2005) Dementia and Alzheimer’s disease incidence in relationship to cardiovascular disease in the cardiovascular health study cohort. Journal of the American Geriatrics Society, 53, 1101-1107. doi:10.1111/j.1532-5415.2005.53360.x
- Engelhart, M.J., Geerlings, M.I., Meijer, J., Kiliaan, A., Ruitenberg, A., van Swieten, J.C., Stijnen, T., Hofman, A., Witteman, J.C.M. and Breteler, M.M.B. (2004) Inflammatory proteins in plasma and the risk of dementia: The Rotterdam study. Archives of Neurology, 61, 668-672. doi:10.1001/archneur.61.5.668
- Wright, C.B., Sacco, R.L., Rundek, T.R., Delman, J.B., Rabbani, L.E. and Elkind, M.S.V. (2006) Interleukin-6 is associated with cognitive function: The Northern Manhattan study. Journal of Stroke and Cerebrovascular Disease, 15, 34-38. doi:10.1016/j.jstrokecerebrovasdis.2005.08.009
- Yaffe, K., Lindquist, K., Penninx, B.W., Simonsick, E.M., Pahor, M., Kritchevsky, S., Launer, L., Kuller, L., Rubin, S. and Harris, T. (2003) Inflammatory markers and cognition in well-functioning African-American and white elders. Neurology, 61, 76-80. doi:10.1212/01.WNL.0000073620.42047.D7
- Bruunsgaard, H., Andersen-Ranberg, K., Jeune, B., Pedersen, A.N., Skinhoj, P. and Pedersen, B.K. (1999) A high plasma concentration of TNF-alpha is associated with dementia in centarians. Journal of Gerentology Series A: Biological Sciences Medical Sciences, 54, M357- M364. doi:10.1093/gerona/54.7.M357
- Dik, M.G., Jonker, C., Hack, C.E., Smit, J.H., Comijs, H.C. and Eikelenboom, P. (2005) Serum inflammatory proteins and cognitive decline in older persons. Neurology, 64, 1371-1377. doi:10.1212/01.WNL.0000158281.08946.68
- O’Bryant, S.E., Hobson, V.L., Hall, J.R., Barber, R.C., Zhang, S., Johnson, L. and Diaz-Arrastia, R. (2011) Serum brain-derived neurotrophic factor levels are specifically associated with memory performance among Alzheimer’s disease cases. Dementia and Geriatric Cognitive Disorders, 31, 31-36. doi:10.1159/000321980
- O’Bryant, S.E., Xiao, G., Barber, R., Huebinger, R., Wilhelmsen, K., Edwards, M., Graff-Radford, N., Doody, R. and Diaz-Arrastia, R. (2011) A blood-based screening tool for Alzheimer’s disease that spans serum and plasma: Findings from TARC and ADNI. PLOS One, 6, e28092. doi:10.1371/journal.pone.0028092
Appendix 1
NOTES
*The Texas Alzheimer’s Research Consortium: Investigators from the Texas Alzheimer’s Research and Care Consortium: Baylor College of Medicine: Rachelle Doody, MD, PhD, Violeta Capriles, Eveleen Darby, Tracey Evans; Texas Tech University Health Science Center: Benjamin Williams, MD, Yan Zhang, Gregory Schrimsher, Andrew Dentino, Ronnie Orozco, Merena Tindall; University of North Texas Health Science Center: Sid E. O’Bryant, Thomas Fairchild, PhD, Janice Knebl, DO, James R. Hall, PhD, Robert C. Barber, Douglas Mains, Lisa Alvarez; University of Texas Southwestern Medical Center: Perrie Adams, Roger Rosenberg, Joan Reisch, Ryan Huebinger, Guanghua Xiao, PhD, Doris Svetlik, Amy Werry, Janet Smith; University of Texas Health Science Center—San Antonio: Donald Royall, MD, Raymond Palmer, Marsha Polk.