Neuroscience & Medicine
Vol.2 No.1(2011), Article ID:4277,4 pages DOI:10.4236/nm.2011.21005
Obese Adolescents with Type 2 Diabetes Mellitus Have Hippocampal and Frontal Lobe VolumeReductions
![]()
1Department of Psychiatry, New York University School of Medicine, New York, USA; 2Department of Pediatrics, New York University School of Medicine, New York, USA; 3Department of Medicine, New York University School of Medicine, New York, USA; 4Nathan Kline Institute for Psychiatric Research, Orangeburg, New York, USA.
Email: antonio.convit@med.nyu.edu
Received January 6th, 2011; revised January 26th, 2011; accepted March 7th, 2011.
Keywords: Obesity, Type 2 Diabetes, Hippocampus, Frontal Lobe, Adolescents
ABSTRACT
The rates of type 2 diabetes (T2DM) continue to parallel the rising rates of obesity in the United States, increasingly affecting adolescents as well as adults. Hippocampal and frontal lobe reductions have been found in older adults with type 2 diabetes, and we sought to ascertain if these brain alterations were also present in obese adolescents with T2DM. In a cross-sectional study we compared MRI-based regional brain volumes of 18 obese adolescents with T2DM and 18 obese controls without evidence of marked insulin resistance. Groups were matched on age, sex, school grade, ethnicity, socioeconomic status, body mass index, and waist circumference. Relative to obese controls, adolescents with T2DM had significantly reduced hippocampal and prefrontal volumes, and higher rates of global cerebral atrophy. Hemoglobin A1c, an index of long-term glycemic control, was inversely associated with prefrontal volume and positively associated with global cerebral atrophy (both p < 0.05). Brain integrity is negatively impacted by T2DM already during adolescence, long before the onset of overt macrovascular disease. Paralleling the findings of greater vascular and renal complications among obese adolescents with severe insulin resistance and T2DM relative to their age-matched peers with type 1 diabetes, we find clear evidence of possible brain complications. Our findings call for aggressive and early intervention to limit the negative impact of obesity-associated insulin resistance leading to T2DM on the developing brains of adolescents.
1. Introduction
Obesity rates in children and adolescents have nearly tripled in the past three decades [1]. Obesity is strongly associated with insulin resistance [2]; over 50% of obese adolescents are also insulin resistant [3]. Insulin resistance, when coupled with a relative inability to compensate for the resistance through increased secretion of insulin, can result in elevated fasting glucose levels. The elevated fasting glucose levels can then ultimately lead to a diagnosis of type 2 diabetes mellitus (T2DM), which is characterized by chronically elevated glucose levels [4]. Because of the dramatic increase of obesity and associated insulin resistance, it is estimated that up to 45% of all diabetes reported in childhood and adolescence is now T2DM [5,6]. Type 1 diabetes mellitus (T1DM) generally results from a lack of adequate insulin production due to autoimmune damage to pancreatic beta cell. Unlike in T2DM, insulin resistance is not part of the etiology of T1DM.
Type 2 diabetes in its later stages or when poorlycontrolled, is associated with multiple complications, such as peripheral neuropathy, kidney disease, and retinopathy; and an earlier age of disease onset is associated with an increased rate of those complications [7,8]. Furthermore, the rate of complications is much higher in T2DM than for individuals with T1DM of equivalent age, despite shorter disease duration [9,10].
There is an emerging literature suggesting that the brain may also be a site of complications in middle-aged and elderly individuals with T2DM and this may be partly independent of occlusive cerebral vascular disease [11-13]. Older adults with T2DM show impairments in several cognitive domains; mostly decreased verbal memory and slowed processing speed have been described [14]. These cognitive functions are supported by the hippocampus and the prefrontal cortex. In line with the cognitive impairments, hippocampal and prefrontal atrophy have also been reported in older individuals with T2DM. So far, those volumetric reductions have been linked to the degree of glycemic control and cardiovascular risk factors, such as obesity [11,12,15- 17].
Some authors have suggested that T2DM affects cognition and the brain only in advanced age [18], however, our group recently showed that cognitive impairments are already present among obese adolescents with T2DM [19]. Specifically, adolescents with T2DM showed lower performance on tests of verbal memory and processing speed, which are analogous to findings in the adult literature. Adolescents with T2DM also had reduced white matter and increased cerebrospinal fluid volume throughout the brain, particularly in the frontal lobe, indicating that disease-associated alterations had already become manifest on the neural level. However, among adolescents with T2DM regional brain volumes, such as the hippocampus, have not yet been reported, thereby excluding full comparability with the adult literature.
The purpose of this study was to ascertain hippocampal and frontal lobe volumes in a group of obese adolescents with T2DM by means of reliable and validated manual tracings on standard MRI images. Given the findings in adults combined with the results from our previous report in adolescents [19], we hypothesized that obese adolescents with T2DM would have reductions in both hippocampus and frontal lobe volumes and these would be associated with their level of glycemic control.
2. Methods
2.1. Participants and Protocol
All participants were either referred to us by collaborating endocrinologists or responded to advertisements on the Internet. We excluded subjects with significant medical conditions (other than type 2 diabetes, lipid abnormalities, polycystic ovary disease, or hypertension). Also excluded were adolescents with sexual development Tanner stage less than 4, a psychiatric diagnosis such as depression, current use of psychoactive medications, mental retardation, or significant learning disability. We recruited nineteen obese adolescents with T2DM; one was excluded from the study because of an abnormal brain MRI showing significant hyperintense plaques in subcortical white matter. Thus, eighteen obese diabetics and 18 obese controls, matched on body mass index (BMI), waist circumference, age, gender, ethnicity, selfrated sleep apnea, and socioeconomic status (SES) were evaluated in this study (Table 1). All adolescents underwent medical, endocrine and cognitive evaluations during a comprehensive 6 - 7 h evaluation completed over two visits. Two adolescents in the control group (one male and one female) did not have a usable MRI scan because of extensive movement artifacts as they could not lie still in the scanner, resulting in 16 controls and 18 T2DM participants with valid imaging data. This study was approved by the Institutional Board of Research Associates of the New York University School of Medicine. Parental written informed consent as well as participants’ assent was obtained from all participants under 18 years of age, and written informed consent was obtained from those 18 years or older. All study subjects were compensated for their time and inconvenience.
2.1.1. Participants with T2DM
Adolescents with T2DM met one or more of the following criteria: 1) fasting blood glucose >126 mg/dl on two separate occasions, 2) 2-hour blood glucose level >200 mg/dl during a 75-gram oral glucose tolerance test, or 3) had received a prior diagnosis of T2DM. All participating obese adolescents with T2DM were β-cell antibody negative. Although most adolescents with T2DM were being treated only with oral hypoglycemic agents and/or by lifestyle modification, six were receiving low dose supplementary insulin treatment at the time of the study.
2.1.2. Obese Control Participants
Participant selection was made blind to cognitive performance or MRI results. We selected a group of obese adolescents without obvious insulin resistance as controls because both obesity and insulin resistance have been shown to negatively impact brain [20] and cognition [21,22] in adults. Although studies in children and adolescents have not found cognitive impairments associated with obesity [23], to date studies have only included mostly overweight, not obese, children and adolescents and it remains unclear whether adolescents with more severe forms of obesity have cognitive dysfunction. Obesity was defined as a BMI ≥30 kg/m2. Insulin sensitivity was estimated using the Homeostasis Model Assessment of Insulin Resistance (HOMA-IR) [24]. The HOMA-IR has been validated against hyperinsulinemiceuglycemic clamp assessments [25,26] and all obese control participants had a HOMA-IR < 2.5, thus it is unlikely that they had marked levels of insulin resistance.
By selecting a control group with equivalent BMI and abdominal obesity levels (waist circumference) as our obese adolescents with T2DM, but without significant insulin resistance, our design allows us to more directly evaluate the impact of T2DM on brain volumes, independent of obesity, in a population that is not likely to have significant occlusive vascular disease.
2.2. Evaluations
2.2.1. Bloods
A blood sample was taken after a 10-hour overnight fast for the assessment of glucose and insulin levels, lipids, and high sensitivity C-Reactive Protein (CRP) levels. Glucose was measured using a glucose oxidase method (VITROS 950 AT, Amersham, England), insulin by chemiluminescence (Advia Centaur, Bayer Corporation), and high sensitivity C-reactive protein (CRP) was measured in plasma using an enzymatic immunoassay (Vitros CRP slide, Ortho Clinical Diagnostics).
2.2.2. BMI and Anthropometric Measurements
Height and weight were measured in a standardized fashion with subjects standing, wearing light clothing and without shoes; height and weight were assessed using a Seca 700 beam scale, 500 lbs capacity, with heightrod, which was calibrated prior to each individual measurement. BMI was defined as the ratio of weight in kilograms divided by the square of the height in meters. Waist circumference was measured using a flexible tape measure at the level of the iliac crest (umbilicus) with the subject relaxed at the end of exhalation.
2.2.3. Blood Pressure Assessment and Definition of Hypertension
Sitting blood pressure (BP) was measured with a random-zero sphygmomanometer and an appropriately sized large adult cuff during one of the visits to our facility. The reading was obtained at the end of the physical examination. Participants were considered hypertensive if they received anti-hypertensive treatment (one adolescent with T2DM), or had a sitting BP above the National Cholesterol Education Program (NCEP) cut-off (a systolic BP ≥130 mm Hg or a diastolic BP ≥85 mm Hg) [27].
2.2.4. Brain MRI
All adolescents were scanned on the same 1.5 T Siemens Avanto MRI System. A T1-weighted magnetization -prepared rapid acquisition gradient echo (MPRAGE) sequence was acquired in the coronal pathological angle (TR 1300 ms; TE 4.38 ms; TI 800 ms; FOV 250 × 250; 196 slices; slice thickness 1.2 mm; NEX 1; Flip angle 15˚). The MPRAGE images were then intensity-normalized and used to define regions of interest (ROIs) for the volume measurements.
All regions of interest (ROIs) were drawn blind to participants’ identity and diagnosis utilizing highly reliable methods [28,29]. Briefly, the hippocampus, superior temporal gyrus (which served as a temporal lobe control region), and prefrontal region were outlined on coronal images. Intracranial vault volume (ICV) was outlined on reformatted sagittal images across multiple slices. Please refer to previous publications from our group (e.g., [11,30]) for details on the ROI drawings. A threshold procedure was used to estimate the CSF portion of the ICV (global cerebral atrophy). To adjust for individual differences in brain size, we residualized all volumes to the ICV by means of linear regression and then used the residualized volumes in analyses.
To rule out primary neurological disease and to quantify white matter disease, fast fluid-attenuated inversion recovery (FLAIR; TR 9000 ms; TE 97 ms; FOV 210 × 210; 1 average and 2 concatenations; Flip angle 145°) images were used. White matter hyperintensities were rated on the FLAIR according to the modified Fazekas scale [31], which assigns scores ranging from 0 to 3 for periventricular and deep white matter hyperintensities. Summed scores for each subject were computed and used in the analyses.
2.2.5. Sleep Behavior Assessment
A sleep related behavior questionnaire, which consists of 20 items to be answered ‘yes’, ‘no’, or ‘don’t know’ was administered [32]. The self rating of sleep apnea is given by the proportion of questions answered yes. Given that obesity is a major risk factor for sleep apnea in children [33] and that obstructive sleep apnea is associated with brain impairments [34], we ensured that the groups were also matched on self ratings of sleep apnea.
2.2.6. Assessment of Socioeconomic Status (SES)
Socioeconomic status (SES) was assessed with a modified version of the Hollingshead SES scale, which includes household income and both parents’ education and occupation to generate a score [35]. SES categories range from 1 to 5, with a higher score indicating a lower SES category.
2.2.7. Statistical Analyses
Groups were compared using Student’s t-test for continuous variables and X2 tests for categorical variables. Fisher’s exact tests were used when appropriate. Associations between variables were established using Pearson’s Correlations. All statistical analyses were conducted using SPSS 16 for Windows.
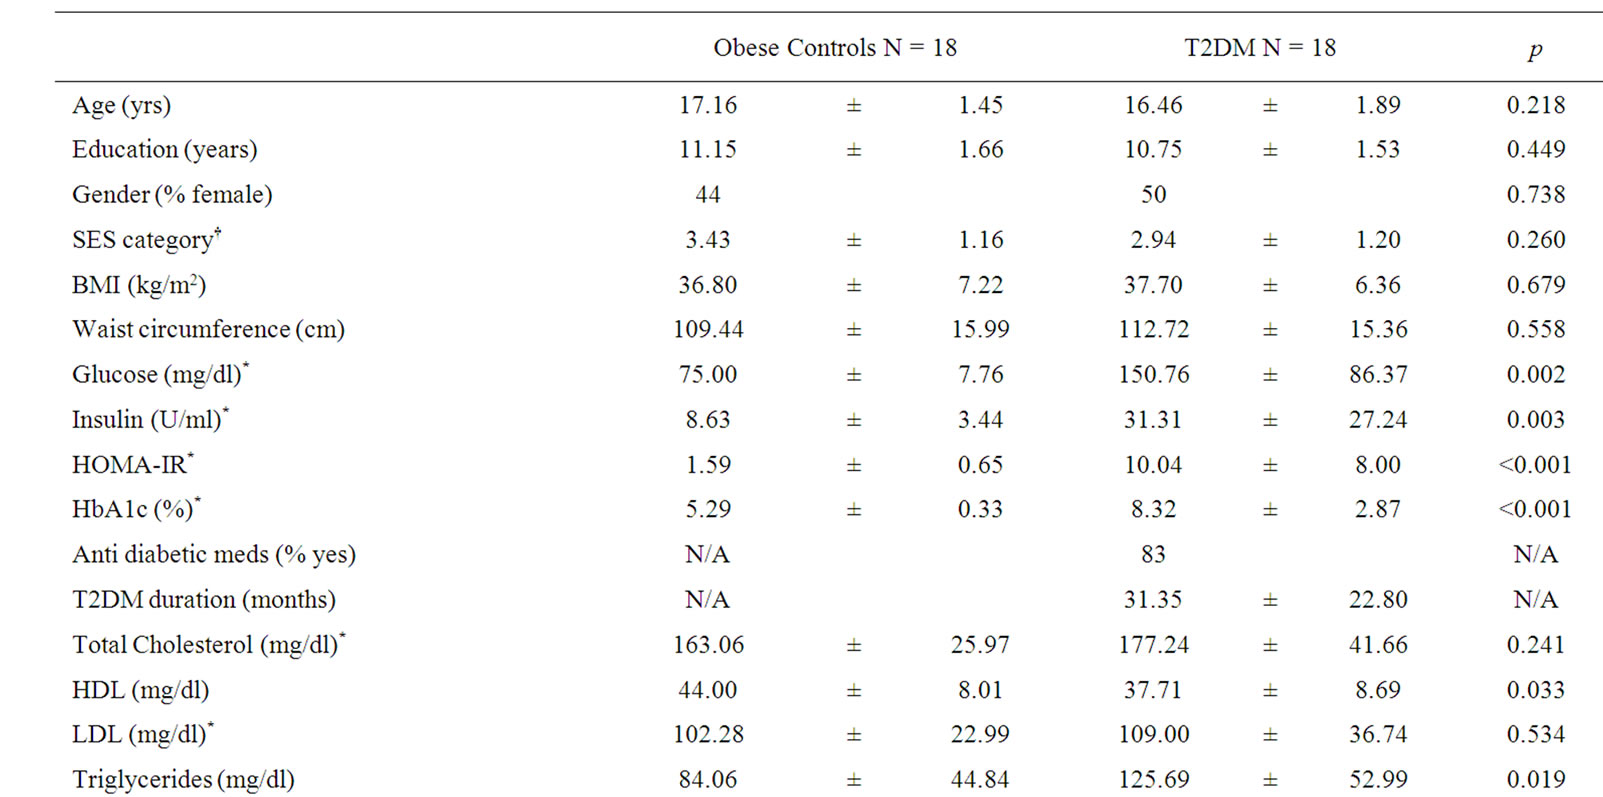
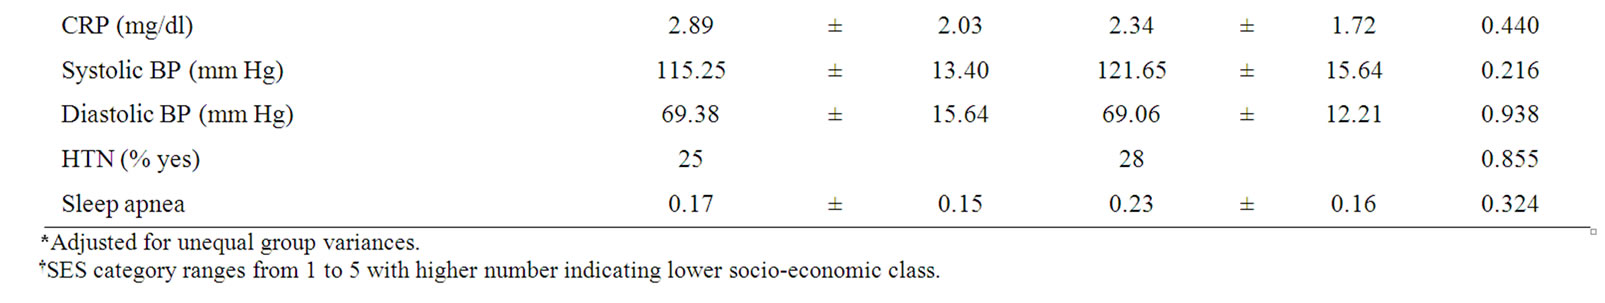
Table 1. Description of study groups (means ± SD).
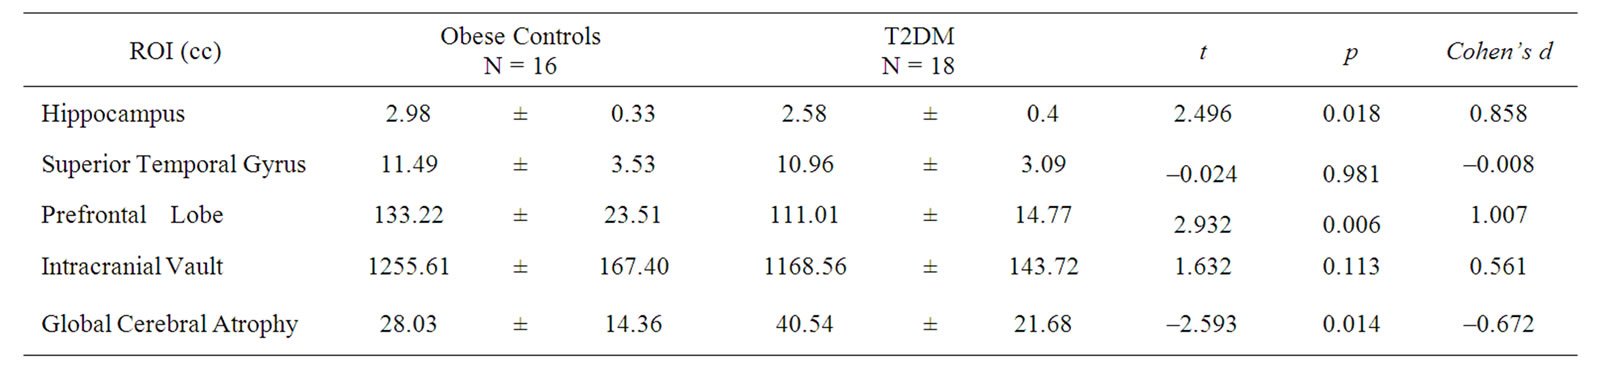
Table 2. Brain Regional Volumes (means ± SD) in cubic centimeters (cc). For ease of comparison, volumes of ROIs are displayed unadjusted. Statistical results (t-, p-, and effect size values) are derived from analyses using ICV-residualized brain volumes.
3. Results
3.1. Demographics and Medical Variables
Groups were matched on age, school grade, gender, SES, self-rated sleep apnea, BMI, and waist circumference.
Adolescents with T2DM, as expected, had significantly higher fasting glucose and insulin values as well as higher HbA1c and triglyceride and lower HDL levels. Groups did not differ with respect to total cholesterol, LDL, CRP, or rates of hypertension (Table 1).
3.2. Neuroimaging
One adolescent with T2DM received a rating of 1 (the mildest form of abnormality, namely punctuate foci only, which is considered not clinically significant) on the Fazekas scale of white matter hyperintensities. None of the obese controls had any white matter hyperintensities.
Relative to control adolescents, those with T2DM had significantly smaller mean residualized hippocampal and prefrontal volumes as well as increased global cere-
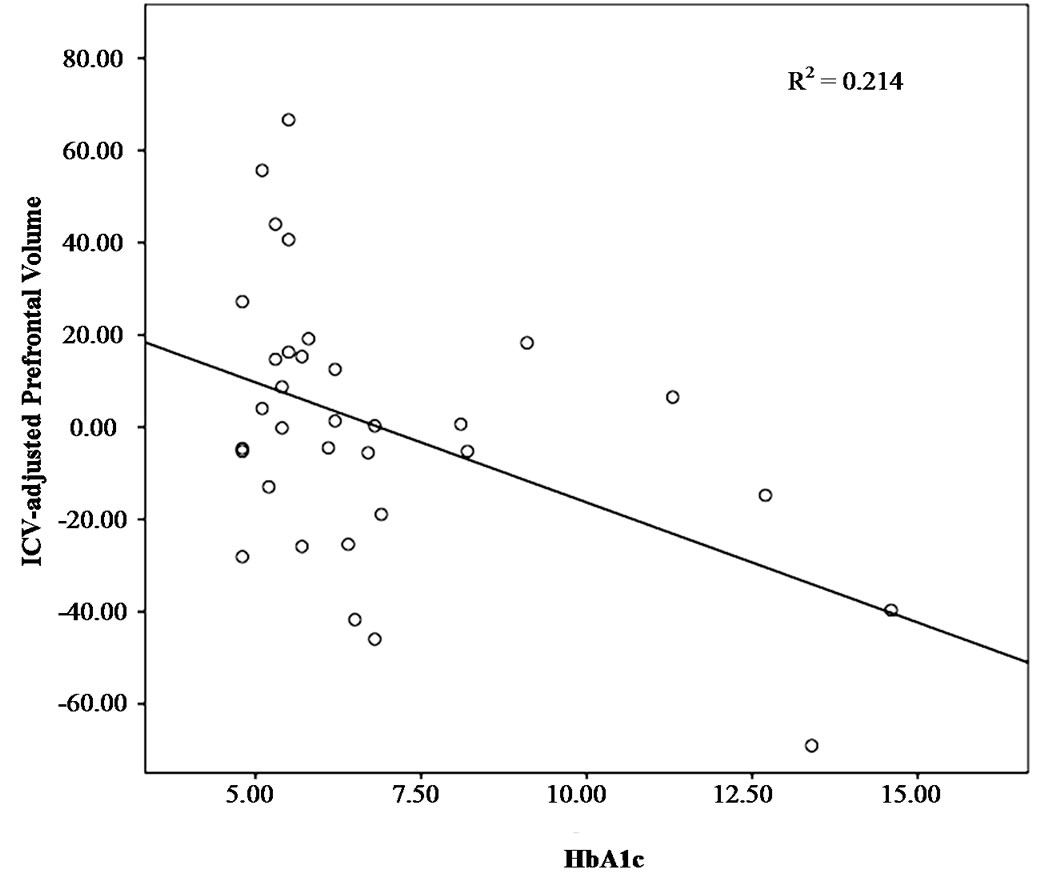
Figure 1. Association between prefrontal volume and HbA1c.

Figure 2. Association between global cerebral atrophy and HbA1c.
bral atrophy. However, the groups did not differ on mean residualized superior temporal gyrus and intracranial vault (ICV) volume (Table 2).
3.3. Brain-Glucose Regulation Relationships
Since regional brain volumes have been associated with HbA1c in adults with T2DM [11,12] we sought to ascertain whether these relationships could be found in adolescents, as well. We detected a significant relationship between prefrontal lobe volume and HbA1c (r = –0.462, p = 0.007); higher HbA1c levels were associated with smaller prefrontal volumes (Figure 1). In addition, HbA1c correlated with global cerebral atrophy; higher HbA1c levels were associated with increased global cerebral atrophy (r = 0.385, p = 0.027) (Figure 2). Hippocampal and superior temporal gyrus volumes were not associated with HbA1c.
4. Discussion
We demonstrated that obese adolescents with T2DM have hippocampal as well as prefrontal volume reductions relative to carefully matched non-insulin resistant obese adolescents. In addition, obese adolescents with T2DM also had increased amounts of global cerebral atrophy. Lower prefrontal volumes and increased global cerebral atrophy were associated with increasing HbA1c, a measure of long-term glycemic control. Young patients with T2DM have been shown to have higher rates of medical complications (hypertension and microalbuminuria) than age-matched peers who have type 1 diabetes, despite having better glucose control and shorter duration of diabetes [9]. The current findings suggest that the brains of obese adolescents with T2DM are also being impacted by the disease. Specifically they show reductions in hippocampus and frontal lobes, structures important for memory and executive function, which is likely to affect their life-long learning.
Hippocampal volume reductions in T2DM have thus far only been reported among middle-aged and elderly individuals [11,15,16,36]. Our present results clearly demonstrate that the brain is structurally affected by T2DM even at a very young age. In contrast, a study assessing hippocampal volume in young adult patients with T1DM [37] did not find any reductions relative to an agematched control group. Type 1 diabetes, unlike T2DM, is not preceded by a prolonged period of insulin resistance. The implication that insulin resistance plays a crucial role in some of the brain abnormalities observed in T2DM is also supported by studies showing impaired cognitive function in older adults with insulin resistance [22,38,39]. Thus, our current findings lend support to our previous conclusions that the hippocampus is particularly vulnerable to the ill-effects of T2DM and its preceding insulin resistance. The underlying causes for the volumetric reductions remain to be clarified. One possibility is that endothelial-dependent vasodilatation is impaired in T2DM and insulin resistance [40-43] and diabetics show reduced cerebrovascular reactivity to CO2 (e.g., [44-46]). The hippocampus is particularly susceptible to insult (e.g., [47]) and may be especially vulnerable to the effects of T2DM on cerebral vascular function, which, together with impaired insulin signaling, may in turn lead to the volume reductions.
In addition to the hippocampal volume reductions, adolescents with T2DM had smaller prefrontal volumes and increased levels of cerebral atrophy. This again corroborates findings in adults with T2DM, where prefrontal volume reductions and global cerebral atrophy have been reported (e.g., [17,48]). Frontal lobe atrophy has been associated with hypertension [49]. However, both of our adolescent groups had the same percentage of individuals with elevated blood pressures (25 and 28% respectively) and there were no differences in the mean systolic or diastolic pressures between the groups. This suggests that T2DM itself may directly affect frontal lobe integrity. We have recently reported that among these obese adolescents with T2DM there are reductions in white matter microstructural integrity throughout the brain and in the frontal lobe in particular, whereas grey matter was unaffected [19]. Given that white matter maturation is still ongoing throughout adolescence [50, 51], our finding of reduced prefrontal volume in diabetic adolescents may reflect delayed white matter maturation, axonal damage, or a combination of both.
Both the reduced prefrontal volume, as well as the increased global cerebral atrophy correlated with increased levels of HbA1c. Hemoglobin A1c has been shown to reflect more the sum of postprandial glucose elevations than fasting glucose values in T2DM [52]. It has been demonstrated that oscillations in glucose, as occur after a meal, are associated with accelerated oxidative stress and deleterious effects on endothelial cells in individuals with and without T2DM [53]. Furthermore, HbA1c has been associated with reduced cerebral blood flow velocity in adults with T2DM, independent of the effect of obesity on cerebral blood flow [44]. Thus, the T2DM-induced damage to the brain may be mediated through the detrimental effects of marked insulin resistance and/or hyperglycemia on the cerebral microvasculature. In addition, hyperglycemia-associated oxidative stress could also induce selective oligodendrocyte death, leading to demyelination [54]. Our findings likely result from a combination of subtle vascular changes and glucose and lipid metabolism abnormalities in the absence of clinically-significant occlusive vascular disease.
The associations we report here between HbA1c and brain abnormalities highlight the importance of ensuring that affected adolescents comply with an aggressive treatment regimen, including pharmacological and lifestyle interventions, tailored to not only to minimize the well-known cardiovascular and renal complications, but perhaps also the cerebral ones described here. Our findings strongly emphasize the importance of identifying children and adolescents at risk for developing T2DM and setting up culturally-sensitive intervention programs aimed at minimizing the adverse effects of progressive metabolic dysregulation on the brain. Adolescents with T2DM, during a formative period when they need to excel at school, may find themselves at a disadvantage from their illness.
This study is limited by its relatively small sample size and cross-sectional design. However, a considerable strength of our study is that we carefully selected our control group to match our obese adolescents with T2DM on age, gender, ethnicity/race, school grade, self-rated sleep apnea, and very importantly on socioeconomic status and obesity (BMI and waist circumference). Therefore our findings are not likely the result of education or socioeconomic bias and not likely to be explained by obesity alone. With that being said, although we did match our groups on abdominal obesity, we did not conduct assessments of body composition and there may be subtle differences in adiposity between our groups. We utilized a state-of-the-art 1.5 Tesla MRI system, which gives us excellent spatial resolution to conduct our hippocampal measurements. Although using a higher field strength magnet (i.e., 3Tesla) would have certain advantages for other types of measurements (e.g., fMRI, spectroscopy), higher field strength would not increase the precision of the volume measurements reported here. Please note that all our MRI measurements were done blind to subject and group identity.
Another weakness of our study is that we utilized a HOMA-IR cutoff of 2.5 to include subjects in our obese control group. HOMA-IR is a crude estimate of insulin sensitivity; therefore some of our control subjects may indeed have some degree of insulin resistance. However, this strengthens our conclusions, as our findings are likely conservative given that there is evidence that insulin resistance short of diabetes also affects brain integrity [22]. Future studies utilizing longitudinal designs should explore abnormalities in endothelial function, vascular reactivity, and/or inflammation as possible mechanisms for the brain abnormalities. Furthermore, future studies should evaluate children and adolescents starting at the pre-clinical stages of T2DM as well as assess whether some of the brain impairments are reversible with improvements in insulin function and/or glycemic control.
In conclusion, we demonstrate that adolescents with T2DM already show the type of brain volumetric reductions that have previously been described in older adults with T2DM, affecting the hippocampus and prefrontal region. In addition, adolescents with T2DM show increased global cerebral atrophy, which together with the reduced prefrontal volume are related to abnormalities in glycemic control. Our findings suggest that the brain should be considered as an early site of complications of T2DM and call for aggressive intervention programs to minimize these adverse effects on the developing brain.
5. Acknowledgements
The study was supported by grants from the National Institutes of Health DK070985 and DK083537and supported in part by grant 1UL1RR029893 from the National Center for Research Resources.
The authors declare that there is no duality of interest associated with this manuscript.
REFERENCES
- D. Jolliffe, “Extent of Overweight among US Children and Adolescents from 1971 to 2000,” International Journal of Obesity and Related Metabolic Disorders: Journal of the International Association for the Study of Obesity, Vol. 28, 2004, pp. 4-9. doi:10.1038/sj.ijo.0802421
- E. Ferrannini, A. Natali, P. Bell, P. Cavallo-Perin, N. Lalic and G. Mingrone, “Insulin Resistance and Hypersecretion in Obesity,” Journal of Clinical Investigation, Vol. 100, No. 5, 1997, pp. 1166-1173. doi:10.1172/JCI119628
- J. M. Lee, M. J. Okumura, M. M. Davis, W. H. Herman and J. G. Gurney, “Prevalence and Determinants of Insulin Resistance among U.S. Adolescents: A Population-Based Study,” Diabetes Care, Vol. 29, No. 11, 2006, pp. 2427-2432. doi:10.2337/dc06-0709
- D. O. Smith and D. LeRoith, “Insulin Resistance Syndrome, Pre-Diabetes, and the Prevention of Type 2 Diabetes Mellitus,” Clinical Cornerstone, Vol. 6, No. 2, 2004, pp. 7-13. doi:10.1016/S1098-3597(04)80050-4
- American Diabetes Association, “Type 2 Diabetes in Children and Adolescents,” Diabetes Care, Vol. 23, No. 3, 2000, pp. 381-389. doi:10.2337/diacare.23.3.381
- T. Aye and L. L. Levitsky, “Type 2 Diabetes: An Epidemic Disease in Childhood,” Current Opinion in Pediatrics, Vol. 15, No. 4, 2003, pp. 411-415.
- N. Gungor, T. Thompson, K. Sutton-Tyrrell, J. Janosky and S. Arslanian, “Early Signs of Cardiovascular Disease in Youth with Obesity and Type 2 Diabetes,” Diabetes Care, Vol. 28, No. 5, 2005, pp. 1219-1221. doi:10.2337/diacare.28.5.1219
- S. McQuaid, D. J. O’Gorman, O. Yousif, T. P. Yeow, Y. Rahman, D. Gasparro, G. Pacini and J. J. Nolan, “EarlyOnset Insulin-Resistant Diabetes in Obese Caucasians has Features of Typical Type 2 Diabetes, but 3 Decades Earlier,” Diabetes Care, Vol. 28, No. 5, 2005, pp. 1216- 1218. doi:10.2337/diacare.28.5.1216
- M. C. Eppens, M. E. Craig, J. Cusumano, S. Hing, A. K. F. Chan, N. J. Howard, M. Silink and K. C. Donaghue, “Prevalence of Diabetes Complications in Adolescents with Type 2 Compared with Type 1 Diabetes,” Diabetes Care, Vol. 29, No. 6, 2006, pp. 1300-1306.
- D. M. Maahs, B. M. Snively, R. A. Bell, L. Dolan, I. Hirsch, G. Imperatore, B. Linder, S. M. Marcovina, E. J. Mayer-Davis, D. J. Pettitt, B. L. Rodriguez and D. Dabelea, “Higher Prevalence of Elevated Albumin Excretion in Youth with Type 2 than Type 1 Diabetes: The SEARCH for Diabetes in Youth Study,” Diabetes Care, Vol. 30, No. 10, 2007, pp. 2593-2598. doi:10.2337/dc07-0450
- S. Gold, I. Dziobek, V. Sweat, A. Tirsi, K. Rogers, H. Bruehl, W. Tsui, S. Richardson, E. Javier and A. Convit, “Hippocampal Damage and Memory Impairments as Possible Early Brain Complications of Type 2 Diabetes,” Diabetologia, Vol. 50, No. 4, 2007, pp. 711-719.
- H. Bruehl, O. T. Wolf, V. Sweat, A. Tirsi, S. Richardson and A. Convit, “Modifiers of Cognitive Function and Brain Structure in Middle-Aged and Elderly Individuals with Type 2 Diabetes Mellitus,” Brain Research, Vol. 1280, 2009, pp. 186-194. doi:10.1016/j.brainres.2009.05.032
- G. M. Reaven, L. W. Thompson, D. Nahum and E. Haskins, “Relationship between Hyperglycemia and Cognitive Function in Older NIDDM Patients,” Diabetes Care, Vol. 13, 1990, pp. 16-21.
- N. Awad, M. Gagnon and C. Messier, “The Relationship between Impaired Glucose Tolerance, Type 2 Diabetes, and Cognitive Function,” Journal of Clinical and Experimental Neuropsychology: Official Journal of the International Neuropsychological Society, Vol. 26, 2004, pp. 1044-1080.
- T. den Heijer, S. E. Vermeer, E. J. van Dijk, N. D. Prins, P. J. Koudstaal, A. Hofman and M. M. Breteler, “Type 2 Diabetes and Atrophy of the Medial Temporal Lobe Structures on Brain MRI,” Diabetologia, Vol. 46, 2003, pp. 1604-1610. doi:10.1007/s00125-003-1235-0
- E. S. C. Korf, L. R. White, P. Scheltens and L. J. Launer, “Brain Aging in Very Old Men with Type 2 Diabetes: The Honolulu-Asia Aging Study,” Diabetes Care, Vol. 29, No. 10, 2006, pp. 2268-2274.
- A. Kumar, E. Haroon, C. Darwin, D. Pham, O. Ajilore, G. Rodriguez and J. Mintz, “Gray Matter Prefrontal Changes in Type 2 Diabetes Detected Using MRI,” Journal of Magnetic Resonance Imaging, Vol. 27, No. 1, 2008, pp. 14-19. doi:10.1002/jmri.21224
- C. M. Ryan and M. Geckle, “Why is Learning and Memory Dysfunction in Type 2 Diabetes Limited to Older Adults?” Diabetes/Metabolism Research and Reviews, Vol. 16, No. 5, 2000, pp. 308-315.
- P. L. Yau, D. C. Javier, C. M. Ryan, W. H. Tsui, B. A. Ardekani, S. Ten and A. Convit, “Preliminary Evidence for Brain Complications in Obese Adolescents with Type 2 Diabetes Mellitus,” Diabetologia, Vol. 53, No. 11, 2010, pp. 2298-2306. doi:10.1007/s00125-010-1857-y
- J. Gunstad, R. H. Paul, R. A. Cohen, D. F. Tate, M. B. Spitznagel, S. Grieve and E. Gordon, “Relationship between Body Mass Index and Brain Volume in Healthy Adults,” International Journal of Neuroscience, Vol. 118, No. 11, 2008, pp. 1582-1593.
- J. Gunstad, R. H. Paul, R. A. Cohen, D. F. Tate and E. Gordon, “Obesity is Associated with Memory Deficits in Young and Middle-Aged Adults,” Eating and Weight Disorders, Vol. 11, No. 1, 2006, pp. e15-e19.
- H. Bruehl, V. Sweat, J. Hassenstab, V. Polyakov and A. Convit, “Cognitive Impairment in Nondiabetic MiddleAged and Older Adults is Associated with Insulin Resistance,” Journal of Clinical and Experimental Neuropsychology, Vol. 32, No. 5, 2010, pp. 487-493. doi:10.1080/13803390903224928
- J. Gunstad, M. B. Spitznagel, R. H. Paul, R. A. Cohen, M. Kohn, F. S. Luyster, R. Clark, L. M. Williams and E. Gordon, “Body Mass Index and Neuropsychological Function in Healthy Children and Adolescents,” Appetite, Vol. 50, No. 2-3, 2008, pp. 246-251.
- K. J. Mather, A. E. Hunt, H. O. Steinberg, G. Paradisi, G. Hook, A. Katz, M. J. Quon and A. D. Baron, “Repeatability Characteristics of Simple Indices of Insulin Resistance: Implications for Research Applications,” Journal of Clinical Endocrinology Metabolism, Vol. 86, No. 11, 2001, pp. 5457-5464.
- D. R. Matthews, J. P. Hosker, A. S. Rudenski, B. A. Naylor, D. F. Treacher and R. C. Turner, “Homeostasis Model Assessment: Insulin Resistance and Á-Cell Function from Fasting Plasma Glucose and Insulin Concentrations in Man,” Diabetologia, Vol. 28, 2004, pp. 412- 419. doi:10.1007/BF00280883
- J. Radziuk, “Insulin Sensitivity and Its Measurement: Structural Commonalities among the Methods,” Journal of Clinical Endocrinology & Metabolism, Vol. 85, No. 12, 2004, pp. 4426-4433. doi:10.1210/jc.85.12.4426
- P. Expert, “Executive Summary of the Third Report of the National Cholesterol Education Program (NCEP) Expert Panel on Detection, Evaluation, and Treatment of High Blood Cholesterol in Adults (Adult Treatment Panel III),” Journal of the American Medical Association, Vol. 285, 2001, pp. 2486-2497.
- A. Convit, M. J. de Leon, C. Tarshish, S. de Santi, A. Kluger, H. Rusinek and A. George, “Hippocampal Volume Losses in Minimally Impaired Elderly,” Lancet, Vol. 345, 1995, p. 266. doi:10.1016/S0140-6736(95)90265-1
- A. Convit, P. R. McHugh, O. T. Wolf, M. J. de Leon, M. Bobinski, S. de Santi, A. Roche and W. Tsui, “MRI Volume of the Amygdala: A Reliable Method Allowing Separation from the Hippocampal Formation,” Psychiatry Research: Neuroimaging, Vol. 90, No. 2, 1999, pp. 113-123. doi:10.1016/S0925-4927(99)00007-4
- A. Convit, O. T. Wolf, M. J. de Leon, M. Patalinjug, E. Kandil, D. Cardebat, A. Scherer, L. A. Saint Louis and R. Cancro, “Volumetric Analysis of the Pre-Frontal Regions: Findings in Aging and Schizophrenia,” Psychiatry Research: Neuroimaging, Vol. 107, No. 2, 2001, pp. 61- 73. doi:10.1016/S0925-4927(01)00097-X
- P. Scheltens, F. Barkhof, D. Leys, J. P. Pruvo, J. J. Nauta, P. Vermersch, M. Steinling and J. Valk, “A Semiquantative Rating Scale for the Assessment of Signal Hyperintensities on Magnetic Resonance Imaging,” Journal of the Neurological Sciences, Vol. 114, No. 1, 1993, pp. 7- 12. doi:10.1016/0022-510X(93)90041-V
- J. A. Mindell and J. A. Owens, “A Clinical Guide to Pediatric Sleep: Diagnosis and Management of Sleep Problems,” Lippincott Williams & Wilkins, Philadelphia, 2003.
- E. Dayyat, L. Kheirandish-Gozal, O. Sans Capdevila, M. M. A. Maarafeya and D. Gozal, “Obstructive Sleep Apnea in Children: Relative Contributions of Body Mass Index and Adenotonsillar Hypertrophy,” Chest, Vol. 136, No. 1, 2009, pp. 137-144.
- P. M. Macey, R. Kumar, M. A. Woo, E. M. Valladares, F. L. Yan-Go and R. M. Harper, “Brain Structural Changes in Obstructive Sleep Apnea,” Sleep, Vol. 31, No. 7, 2008, pp. 967-977.
- A. B. Hollingshead, “Two Factor Index of Social Position: New Haven,” Yale University, 1957.
- H. Bruehl, O. T. Wolf and A. Convit, “A Blunted Cortisol Awakening Response and Hippocampal Atrophy in Type 2 Diabetes Mellitus,” Psychoneuroendocrinology, Vol. 34, No. 6, 2009, pp. 815-821. doi:10.1016/j.psyneuen.2008.12.010
- B. M. Lobnig, O. Kroemeke, C. Optenhostert-Porst and O. T. Wolf, “Hippocampal Volume and Cognitive Performance in Long-Standing Type 1 Diabetic Patients without Macrovascular Complications,” Diabetic Medicine, Vol. 23, No. 1, 2006, pp. 32-39.
- M. Vanhanen, K. Koivisto, L. Karjalainen, E. L. Helkala, M. Laakso, H. Soininen and P. Riekkinen, Sr., “Risk for Non-Insulin-Dependent Diabetes in the Normoglycaemic Elderly is Associated with Impaired Cognitive Function,” NeuroReport, Vol. 8, 1997, pp. 1527-1530.
- S. Kalmijn, E. J. M. Feskens, L. J. Launer, T. Stijnen and D. Kromhout, “Glucose Intolerance, Hyperinsulinaemia and Cognitive Function in a General Population of Elderly Men,” Diabetologia, Vol. 38, 1995, pp. 1096-1102. doi:10.1007/BF00402181
- J. E. Tooke and M. M. Hannemann, “Adverse Endothelial Function and the Insulin Resistance Syndrome,” Journal of Internal Medicine, Vol. 247, No. 4, 2000, pp. 425-431.
- J. E. Tooke and K. L. Goh, “Endotheliopathy Precedes Type 2 Diabetes,” Diabetes Care, Vol. 21, 1998, pp. 2047- 2049. doi:10.2337/diacare.21.12.2047
- K. B. Stansberry, S. A. Shapiro, M. A. Hill, P. M. McNitt, M. D. Meyer and A. I. Vinik, “Impaired Peripheral Vasomotion in Diabetes,” Diabetes Care, Vol. 19, 1996, pp. 715-721. doi:10.2337/diacare.19.7.715
- A. I. Vinik, T. Erbas, T. S. Park, K. B. Stansberry, J. A. Scanelli and G. L. Pittenger, “Dermal Neurovascular Dysfunction in Type 2 Diabetes,” Diabetes Care, Vol. 24, No. 8, 2001, pp. 1468-1475.
- V. Novak, D. Last, D. C. Alsop, A. M. Abduljalil, K. Hu, L. Lepicovsky, J. Cavallerano and L. A. Lipsitz, “Cerebral Blood Flow Velocity and Periventricular White Matter Hyperintensities in Type 2 Diabetes,” Diabetes Care, Vol. 29, No. 7, 2006, pp. 1529-1534.
- L. Petrica, M. Petrica, A. Vlad, F. Bob, C. Gluhovschi, G. Gluhovschi, C. D. Jianu, S. Ursoniu, A. Schiller, S. Velciov, V. Trandafirescu and G. Bozdog, “Cerebrovascular Reactivity is Impaired in Patients with Non-Insulin-Dependent Diabetes Mellitus and Microangiopathy,” Wien Klin Wochenschr, Vol. 119, No. 11-12, 2007, pp. 365- 371. doi:10.1007/s00508-007-0809-0
- D. Last, C. de Bazelaire, D. C. Alsop, K. Hu, A. M. Abduljalil, J. Cavallerano, R. P. Marquis and V. Novak, “Global and Regional Effects of Type 2 Diabetes on Brain Tissue Volumes and Cerebral Vasoreactivity,” Diabetes Care, Vol. 30, No. 5, 2007, pp. 1193-1199.
- M. P. Mattson, P. B. Gurthrie and S. B. Kater, “Intrinsic Factors in the Selective Vulnerability of Hippocampal Pyramidal Neurons,” Progress in Clinical & Biological Research, Vol. 317, 1989, pp. 333-351.
- S. Manschot, G. Biessels, H. de Valk, A. Algra, G. Rutten, J. van der Grond, L. Kappelle and on behalf of the Utrecht Diabetic Encephalopathy Study, “Metabolic and Vascular Determinants of Impaired Cognitive Performance and Abnormalities on Brain Magnetic Resonance Imaging in Patients with Type 2 Diabetes,” Diabetologia, Vol. 50, No. 11, 2007, pp. 2388-2397. doi:10.1007/s00125-007-0792-z
- N. Raz, K. M. Rodrigue, and J. D. Acker, “Hypertension and the Brain: Vulnerability of the Prefrontal Regions and Executive Functions,” Behavioral Neuroscience, Vol. 117, No. 6, 2003, pp. 1169-1180.
- T. Paus, D. L. Collins, A. C. Evans, G. Leonard, B. Pike and A. Zijdenbos, “Maturation of White Matter in the Human Brain: A Review of Magnetic Resonance Studies,” Brain Research Bulletin, Vol. 54, No. 3, 2001, pp. 255-266. doi:10.1016/S0361-9230(00)00434-2
- T. Paus, “Mapping Brain Maturation and Cognitive Development during Adolescence,” Trends in Cognitive, Vol. 9, No. 2, 2005, pp. 60-68.
- H. J. Woerle, C. Neumann, S. Zschau, S. Tenner, A. Irsigler, J. Schirra, J. E. Gerich and B. Goke, “Impact of Fasting and Postprandial Glycemia on Overall Glycemic Control in Type 2 Diabetes Importance of Postprandial Glycemia to Achieve Target HbA1c Levels,” Diabetes Research and Clinical Practice, Vol. 77, 2007, pp. 280- 285. doi:10.1016/j.diabres.2006.11.011
- A. Ceriello, K. Esposito, L. Piconi, M. Ihnat, J. Thorpe, R. Testa, A. R. Bonfigli and D. Giugliano, “Glucose ‘Peak’ and Glucose ‘Spike’: Impact on Endothelial Function and Oxidative Stress,” Diabetes Research and Clinical Practice, Vol. 82, No. 2, 2008, pp. 262-267. doi:10.1016/j.diabres.2008.07.015
- K. J. Smith, R. Kapoor and P. A. Felts, “Demyelination: The Role of Reactive Oxygen and Nitrogen Species,” Brain Pathology, Vol. 9, No. 1, 2009, pp. 62-92.