Open Journal of Regenerative Medicine
Vol.1 No.3(2012), Article ID:25919,9 pages DOI:10.4236/ojrm.2012.13008
Macrophage phenotypes correspond with remodeling outcomes of various acellular dermal matrices*#
![]()
Department of Plastic and Reconstructive Surgery, University of Virginia Health System, Charlottesville, USA;
+Corresponding Author: hiteshdos@hotmail.com
Received 3 October 2012; revised 14 November 2012; accepted 4 December 2012
Keywords: Titanium; Surface Treatments; Dental Implant; Roughness
ABSTRACT
Macrophages have recently been characterized as having an M1 or M2 phenotype based on re- ceptor expression, mechanism of activation and function. The effects of macrophage phenotype upon tissue remodeling following implantation of an acellular dermal matrix (ADM) is largely unknown. The purpose of this study was to compare the macrophage phenotype and tissue remodeling elicited by four different ADMs (DermaMatrix(R), AlloDerm(R), Integra(R) and Der- mACELL(R)). ADM samples were wrapped around the inferior epigastric vessels of a rat and were harvested on 7, 14, 21 and 42 days post-im- plantation. Immunohistologic methods were used to identify macrophage surface markers CD68 (pan-macrophage), CCR7 (M1 profile), and CD206 (M2 profile). All human derived ADMs showed a bell shaped curve for distribution of CD68+ macrophages with peaks for DermaMa- trix(R) and DermACELL(R) occurring at day 14 and peak influx for AlloDerm(R) occurring on day 21. In contrast, bovine derived Integra(R) showed an increasing trend of macrophages with time. DermACELL(R) had the highest influx of macro- phages while Integra(R) had the lowest. A quanti- tative analysis of phenotype of macrophages in AlloDerm(R) showed that the cells were predomi- nantly M1 at 7, 14, 21 and 42 days post implant- tation. In contrast, Integra(R) showed a mixed M1/M2 population of macrophages at all time- points. The histopathologic evaluation showed that a predominantly M1 macrophage response was associated with a more inflamematory type tissue remodeling outcome in AlloDerm(R) while a mixed M1/M2 macrophage response was asso- ciated with a more constructive tissue remodel- ing response seen in the other substrates. (pan-macrophage), CCR7 (M1 profile), and CD206 (M2 profile). All human derived ADMs showed a bell shaped curve for distribution of CD68+ macrophages with peaks for DermaMatrix® and DermACELL® occurring at day 14 and peak influx for AlloDerm® occurring on day 21. In contrast, bovine derived Integra® showed an increasing trend of macrophages with time. DermACELL® had the highest influx of macrophages while Integra® had the lowest. A quantitative analysis of phenotype of macrophages in AlloDerm® showed that the cells were predominantly M1 at 7, 14, 21 and 42 days post implanttation. In contrast, Integra® showed a mixed M1/M2 population of macrophages at all timepoints. The histopathologic evaluation showed that a predominantly M1 macrophage response was associated with a more inflamematory type tissue remodeling outcome in AlloDerm® while a mixed M1/M2 macrophage response was associated with a more constructive tissue remodeling response seen in the other substrates.
1. INTRODUCTION
There are many biologic scaffold materials currently available for clinical use, including AlloDerm® (Lifecell Corporation, Branchburg, NJ), DermaMatrix® (Synthes CMF, West Chester, PA), DermACELL® (LifeNet Health, Virginia Beach, VA) and Integra Dermal Regeneration Template® (Integra LifeSciences Corporation, Plainsboro, NJ). These products are all composed of extracellular matrix (ECM) but differ in species of origin, tissue source, processing methods and/or extent of chemical crosslinking. They have been used for a number of applications, first with burns [1,2], but more recently with cosmetic [3,4] and reconstructive procedures [5,6], notably breast reconstruction [7,8].
Typically, the host inflammatory response to an implanted biomaterial follows a predictable sequence of events, with downstream consequences including foreign-body giant-cell formation and fibrosis at the hostimplant interface [9]. In a recent study of biologic scaffolds, an intense mononuclear macrophage response in the early post-implantation period was noted for all products. However, long term evaluation revealed that some materials remodeled with the formation of organized, site appropriate tissue while others were associated with chronic inflammation, fibrosis, scarring, and encapsulation [10]. Recently, phenotypic and functional polarization of mononuclear/phagocyte cell populations has been described [11-13]. Macrophages, classically activated by interferon (IFN)γ and/or microbial products, display an M1 phenotype that is characterized by high expression of interleukin (IL)-12, inducible nitric oxide synthase (iNOS), tumour necrosis factor (TNF)α and CD86. This promotes pathogen killing and is associated with the classic signs of inflammation, especially chronic [14]. In contrast, M2 macrophages include various forms of alternatively activated macrophages exposed to IL-4, IL-10, IL-13, immune complexes or glucocorticoid [15] and are characterized as high in arginase (Arg)-1 but low in iNOS and IL-12 production. This encourages immunoregulation, tissue repair and constructive tissue remodeling [16]. Although morphologically indistinguishable using routine methods of examination, mononuclear macrophages from these two pathways can be identified and distinguished according to their cell surface markers and/or gene expression profiles [11,13].
Although there are a variety of ADMs to choose from there is scant literature that provides direct comparative analysis between products. The objective of this study was to examine the association between macrophage phenotype response and tissue remodeling in four different ADMs using and to determine the effect of the proprietary ECM processing methods, upon macrophage polarization.
2. MATERIALS AND METHODS
2.1. Implantation of ADMs around a Vascular Pedicle
Forty-eight adult retired breeder Sprague Dawley rats (Charles River Laboratories, Inc., Wilmington, MA) were randomly assigned for implantation with different matrices. After induction, the surgical site was shaved and prepped in a sterile fashion. Bilateral inguinal incisions were made and microscopic dissection was performed to identify and isolate the inferior epigastric pedicle. Next, the pedicle was circumferentially wrapped with a 10 × 10 mm piece of designated matrix (Figure 1). Each animal had the same type of matrix implanted bilaterally. The four groups consisted of animals receiving a) 1.04 - 2.28 mm thick implantable Alloderm®; b) implantable 0.8 - 1.7 mm thick DermaMatrix®; c) implantable 0.76 - 1.25 mm thick DermaACELL®; or d) Integra®. The dermal side of each product faced the pedicle. The construct was then wrapped by a larger piece of 0.15 mm-thick Sil-Tec silicone sheeting (Technical Products, Inc., Lawrenceville, GA) and secured with 6 - 0 nylon interrupted sutures. This prevented the in-growth of cells from the surrounding environment and maintained the pedicle as the only source of host in-growth. The outer sheet of Sil-Tec sheeting was added to all groups except for Integra® which is supplied with a silicone backing.
A total of 96 procedures were performed on 48 ani-
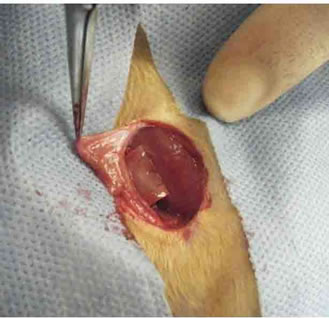
Figure 1. Design of an inferior epigastric artery-based implant/construct. Gross photograph of the groin incision used to harvest the superficial inferior epigastric artery flap. The pedicle was wrapped with a 10 × 10 mm piece of matrix followed by a silicone sheeting.
mals by a single surgeon in an identical fashion. Three animals from each group were randomly designated for analysis at each of four time points (7, 14, 28, and 42 days), yielding six specimens of a given product for each evaluation point.
2.2. Harvesting and Processing of Tissues
At the predetermined time points, animals were euthanized per institutional guidelines. An infusion of 10% formalin was used intravascularly to fix the tissue constructs that were subsequently excised in toto and placed into formalin for one day. Each construct was bisected at its midpoint perpendicular to the axis of the pedicle vessels, and 5 micron paraffin embedded sections were prepared from this cut edge toward the respective ends.
2.3. Histology and Immunohistochemistry
The tissue sections were stained with Hematoxylin and Eosin and Masson’s Trichrome. For immunohisto chemical staining a heat mediated antigen retrieval technique that included a 20 minute boil in 0.01 M citrate buffer, pH 6.0 was used. Sections were incubated in 2% normal horse serum in PBS for 30 minute at room temperature in a humidified chamber. Following incubation in blocking serum, the sections were incubated in primary antibody in a humidified chamber at 4˚C overnight. Each tissue specimen was exposed to a pan-macrophage marker (CD68), an M1 phenotype marker (CCR7), and an M2 phenotype marker (CD206).
The primary antibodies used were mouse anti-rat CD68 (Serotec, Raleigh, NC) at a dilution of 1:500, rabbit anti-CCR7 (Epitomics, Burlingame, CA) at a dilution of 1:2000, and goat anti-CD206 (Santa Cruz Biotechnology Inc., CA) at a dilution of 1:50. CCR7 is a surface marker for M1 phenotype [16] and CD206 (Macrophage Mannose Receptor: 1) is a widely accepted marker for M2 phenotype [17,18]. The secondary antibodies used were Alexa Fluor 488 donkey anti-mouse, Alexa Fluor 555 donkey anti-rabbit and Alexa Fluor 647 donkey antigoat (Invitrogen, CA) at a dilution of 1:100. All antibodies were diluted in PBS containing 2% horse serum (Sigma) and 0.1% bovine serum albumin (Sigma). Formalin-fixed rat spleen and lymph node served as positive control tissue for all immunohistochemical procedures.
2.4. Analysis
An investigator blinded to the identity of tissue specimen conducted quantitative analysis while a blinded pathologist performed qualitative analysis of sections. The immunostained slides were imaged using a confocal Nikon Eclipse TE 2000-E2 (Nikon, Melville, NY) microscope equipped with x60 Nikon oil immersion objective. Immunopositive cells were counted for each specimen in 3 matched microscope fields at 600× magnification, for a total of 18 fields per graft type. The sutured sites were avoided in the histological evaluation.
The presence of CD68 surface marker indicated a panmacrophage phenotype. The cells co-stained with CD68 and CCR7 indicated M1 phenotype while those costained with CD68 and CD206 were representative of M2 phenotype. The mean value of cells showing M1 and M2 phenotype was calculated by obtaining the average of 18 fields per graft type and an M1/M2 ratio was calculated for each graft type at each time point.
2.5. Statistical Analysis
The factors analyzed were devices with four levels (Derma Matrix®, AlloDerm®, Integra® and DermACELL®), time in days with four levels (7, 14, 21 and 42) and macrophage type (pan-macrophage, M1 and M2 phenotype). Comparisons were made between all four constructs at each time-point with respective macrophage type, making a total of six comparisons per time-point for each macrophage subtype. Tukey’s multiple comparison method with p < 0.05 was considered significant. SPSS 19.0 was used for analysis.
3. RESULTS
All of the animals in this study survived the surgical procedure and post-operative period without any complications.
3.1. Histopathologic Findings
Based on the blinded evaluation of Hematoxylin and Eosin and Masson’s Trichrome stained sections by a Board Certified Pathologist, the following histological observations were recorded.
The host response to DermaMatrix® at day 7 was characterized by cellular infiltrate of predominantly macrophages, some lymphocytes and spindle shaped fibroblasts. By day 14, the cells increased in number and invaded further into the graft. The collagen at interface was degraded and some endothelial cells forming luminal structures could be identified. By day 21, the inflammatory cells decreased in numbers and some foreign-body giant cells were identified at sutured sites. On day 42, lymphocytes increased in numbers while the numbers of fibroblasts and macrophages declined. Finely remodeled collagen was identified at the host-graft interface and some foreign body giant cells were seen (Figures 2 and 3(A)).
The host response to AlloDerm® on day 7 was comprised mainly of mononuclear cells with some neutronphils, activated fibroblasts and neo-vessels. By day 14, the cells infiltrated deeper into the graft and the collagen at interface was remodeled to finer collagen—which extended further on day 21 and was associated with early granuloma formation. By day 42, well-formed granulomas with multinucleate giant cells were identified. There were also areas of coagulative necrosis from breakdown of inflammatory cells (Figures 2 and 3(B)).
The host response to Integra® on day 7 was predominantly lymphocytes and fibroblasts with some RBCs, neutrophils and macrophages. Although day 7 specimens were associated with sectioning artefact, by day 14, the collagen strands were fairly uniform but finer than human collagen. By day 21, the macrophage population increased and many multi-nucleate giant cells were seen without evidence of granuloma formation. By day 42, the giant cell response grew even further and there was evidence of collagen destruction at the host-graft interface, which was visualized as scattered broken fibres, in the process of remodeling (Figures 2 and 3(C)).
DermACELL® had the highest influx of inflammatory cells. Even by day 7, mononuclear cells (both monocytes and lymphocytes) had infiltrated the entire thickness of the graft. Some neutrophils and activated fibroblasts were also seen. By day 14, the cellular infiltrate reached its peak with a predominant macrophage population and evidence of early granuloma formation was seen. The host-graft interface had finely remodeled collagen. By day 21, well-formed granuloma in response to the tissue graft was seen with numerous fibroblasts at the tissue interface. By day 42, there was ischemic breakdown of inflammatory cells at the furthest rim of implant invasion, visible as necrotic debris (Figures 2 and (3D)).
3.2. Immunohistochemistry (Figure 4)
All human derived ADMs showed a bell shaped curve
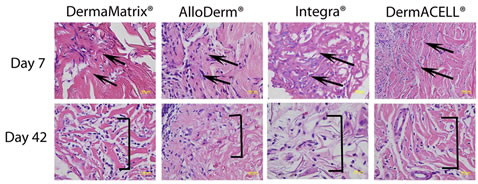
Figure 2. Histologic appearance of the ADM grafts at days 7 and 42 post implantation. The vascular pedicle is towards the left and the graft is represented towards the right (area of demarcation shown by arrows). The graft appears minimally degraded at day 7 post surgery (red staining, arrows) and finely remodeled collagen (red staining, brackets) was seen on day 42. (Hematoxylin and Eosin, 400×).
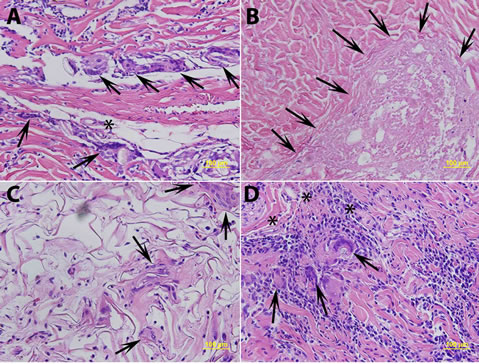
Figure 3. (A) Histologic appearance of DermaMatrix® at day 42 post-implantation showing numerous foreign body giant cells (arrows and asterix) at sutured sites, confirmed with polarizing microscopy; (B) AlloDerm® at day 42 post surgery showing coagulative necrosis (lightly stained areas without any nuclei, shown by arrows); (C) Integra® at day 42 post surgery showing multinucleate giant cells (arrows) without evidence of granuloma formation; and (D) DermACELL® on day 21 post surgery showing granulomatous response (arrows) with numerous mononuclear cells, macrophages and multinucleate giant cells. (Hematoxylin and Eosin, 200×).
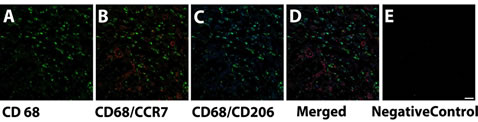
Figure 4. Immunofluorescence images of DermACELL® at day 7 demonstrating (A) Pan-macrophage marker CD68 (Alexa 488) (green); (B) Co-staining of CD68 (Alexa 488) (green) with M1 phenotype marker CCR7 (Alexa 555) (red); (C) Co-staining of CD68 (Alexa 488) (green) with M2 phenotype marker CD206 (Alexa 647) (blue); (D) Co-staining of CD68 (Alexa 488) (green) with CCR7 (Alexa 555) (red) and CD206 (Alexa 647) (blue); and (E) Negative controlSecondary antibodies alone in DermACELL® (Alexa 488, Alexa 555 and Alexa 647). Rat lymph node was used as positive control. Scale bar: 20 μm.
for distribution of CD68+ macrophages with peaks for DermaMatrix® and DermACELL® occurring at day 14, while for AlloDerm® the peak influx occurred at 21 days. Conversely, bovine derived Integra® showed an increaseing trend of macrophages with time. DermACELL® had the highest influx of macrophages while Integra® had the lowest (Table 1 and Figure 5). A quantitative analysis of phenotype of macrophages in AlloDerm® showed that the cells were predominantly M1 at 7, 14, 21 and 42 days post implantation (p < 0.01). In contrast, Integra® showed a mixed M1/M2 population of macrophages at all time-points with no significant difference among these cells. The trend for M1:M2 ratio in Integra® was skewed towards M2 on day 7, towards M1 on days 14 to 21 and again towards M2 on day 42. The macrophages present in DermaMatrix® were observed to be predominantly M1 at 7 and 14 days post implantation, with a mixed M1/M2 population at 21 and 42 days. Interestingly, the M1:M2 ratio for this scaffold progressively changed from M1 towards M2 phenotype over time.
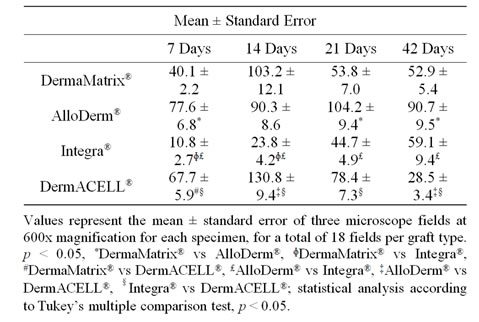
Table 1. CD 68 immunopositive cells.
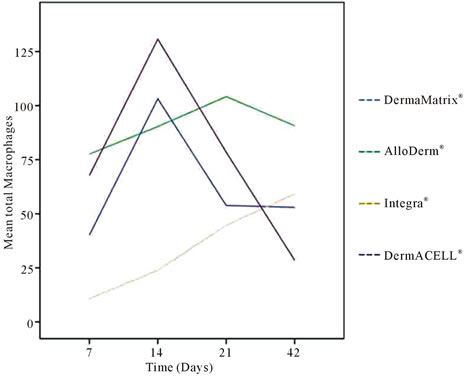
Figure 5. Mean total CD 68+ macrophages for (A) DermaMatrix®, (B) AlloDerm®, (C) Integra®, and (D) DermACELL® plotted against days 7, 14, 21 and 42 post implantation.
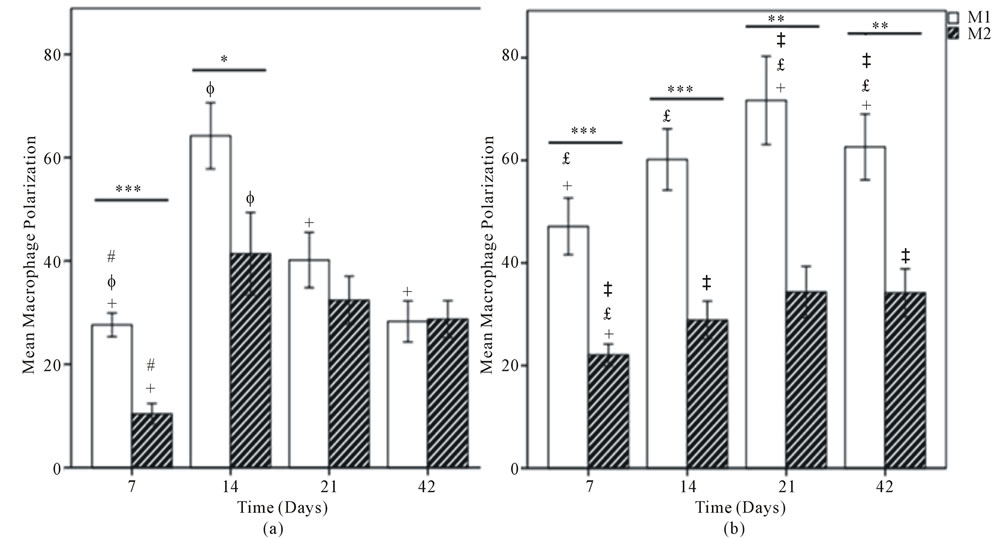
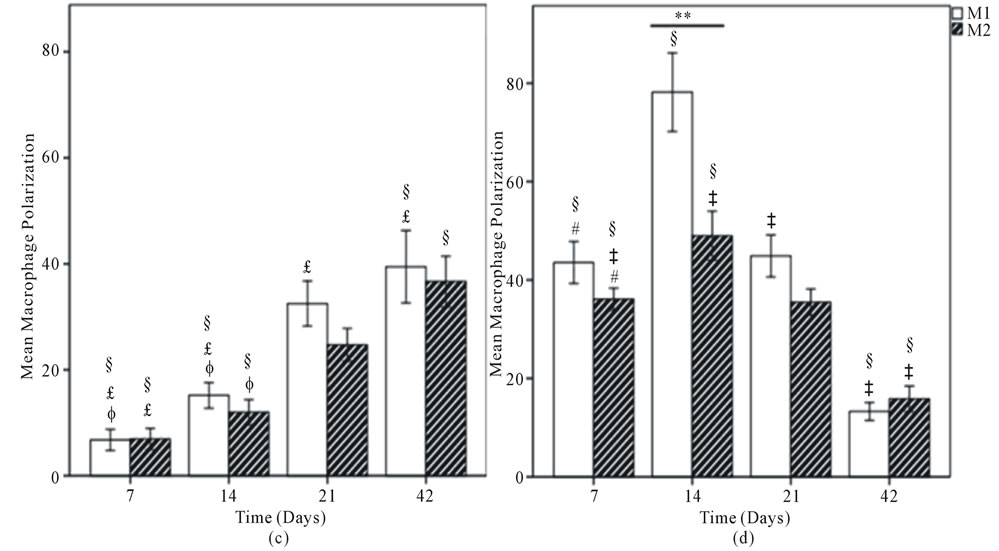
Figure 6. Mean macrophage polarization for (A) DermaMatrix®; (B) AlloDerm®; (C) Integra®; and (D) DermACELL®. M1 Phenotype represented by white bars and M2 with hatched bars. Values represent the mean ± standard error of three microscope fields at 600x magnification for each specimen, for a total of 18 fields per graft type. Statistical analysis according to Tukey’s multiple comparison test p < 0.05, +DermaMatrix® vs AlloDerm®, ɸDermaMatrix® vs Integra®, #DermaMatrix® vs DermACELL®, £AlloDerm® vs Integra®, ‡AlloDerm® vs DermACELL®, §Integra® vs DermACELL®; Comparison between M1 and M2 phenotype at each time-point according to Independent Samples t-test. *p < 0.05; **p < 0.01; ***p < 0.001.
Similarly, DermACELL® had predominantly M1 macrophages on day 21 but for other time points a mixture of both M1 and M2 phenotype of cells was identified. The M1:M2 ratio saw an increase from day 7 to day 21 but then declined progressively to a M2 predominant response in day 42 (Figures 6 and 7).
A population of CD68+ macrophages were observed within the matrices some of which co-expressed both M1 and M2 surface markers (represented by a positive value in Figure 8) and some did not stain for either of the markers (represented by a negative value in Figure 8). AlloDerm®, Integra® and DermaMatrix® showed an increasing trend of M1 + M2 co-expression over the timepoints whereas DermACELL® showed a high coexpression on day 7 followed by a decreasing trend.
4. DISCUSSION
Biologic scaffolds, commonly used for regeneration or replacement of damaged tissues, are primarily composed of ECM constituent molecules. The preparation of an ECM scaffold (allogenic or xenogenic) involves decellularization of the tissue or organ from which the ECM is harvested [19]. The decellularization processes are proprietary and differ significantly between products. Integra® is the only de novo engineered substrate used in this study, available as a bilayer membrane system. The dermal replacement layer is made up of a cross-linked bovine type I collagen-glycosaminoglycan matrix of a random pore size and degradation rate.
A recent study showed that monocytes are required for the degradation of SIS® (Restore) scaffolds and autologous tissue grafts. Constructive remodeling response require scaffold degradation to realize the optimal beneficial effects, but carbodiimide crosslinking of SIS® makes it resistant to macrophage mediated degradation [20]. Further studies showed that carbodiimide crosslinking of the SIS® (Restore) resulted in a switch from an M2 dominant profile to an M1 dominant profile and a change in the long term (16 weeks) remodeling outcome from constructive remodeling to chronic inflammation [21].
When comparing human ADMs we found that Al-
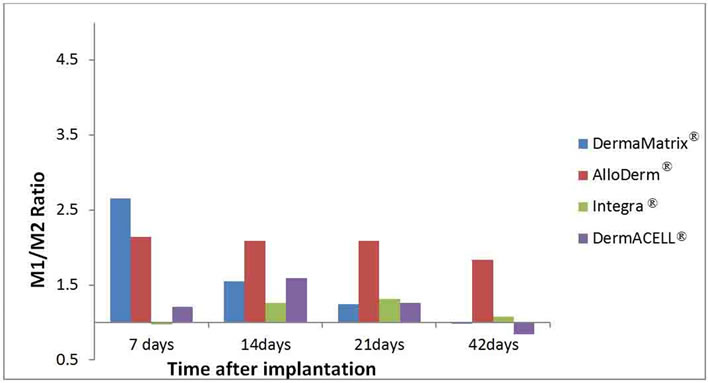
Figure 7. The ratios of M1:M2 macrophages are illustrated for each ADM: DermaMatrix®, AlloDerm®, Integra® and DermACELL® for each time point after implantation.
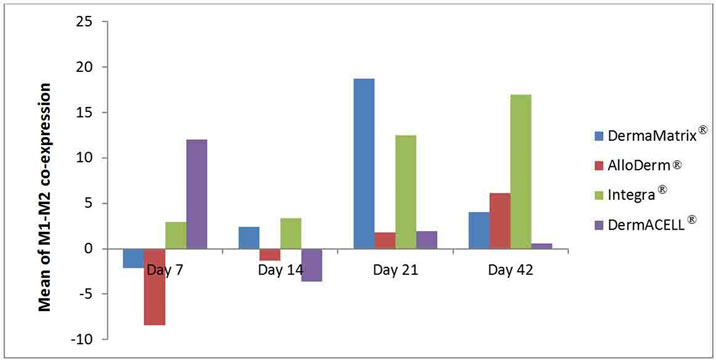
Figure 8. Mean of M1-M2 co-expression in macrophages illustrated for each ADM: DermaMatrix®, AlloDerm®, Integra® and DermACELL® for each time point after implantation. Negative values represent no polarization to either M1 or M2 phenotype.
loDerm® had predominantly M1 macrophages infiltrating it on days 7, 14, 21 and 42. In contrast, DermaMatrix® and DermACELL® had M1 predominant profile only until day 14 but for later time-points both M1 and M2 macrophages were present in nearly equal numbers (Figure 6). The M1:M2 ratio for DermaMatrix® linearly changed from M1 towards M2 phenotype over time while for DermACELL® there was an increase to M1 profile from day 7 to day 21 and then a progressive decline to a M2 predominant response in day 42. None of the above three products are cross-linked. However, Integra® which is cross-linked bovine collagen, showed a mixed M1/M2 population of macrophages at all timepoints with no significant difference among these cells. The trend for M1:M2 ratio was skewed towards M2 on day 7, towards M1 on days 14 to 21 and again towards M2 on day 42 for Integra® (Figure 7). The total number of macrophages (CD68+) for DermACELL® and DermaMatrix® peaked at 14 days while the counts for AlloDerm® peaked at 21 days. On the contrary, the number of macrophages progressively increased in Integra® over time and it was comparatively less than all other matrices at all time-points except day 42 (Table 1 and Figure 5).
The histopathologic evaluation in our study confirmed that a predominantly M1 macrophage response was associated with a more inflammatory type tissue remodeling outcome in AlloDerm® (Figure 3(B)), while a mixed M1/M2 response in other substrates was associated with a more constructive tissue remodeling outcome (Figures 2 and 3). Thus, the phenotype of mononuclear macrophages that participate in the host response to implanted biologic scaffold materials seems to play an important role in determining the extent of a constructive remodeling outcome versus destructive outcome.
Cole et al. [22] implanted AlloDerm®, DermaMatrix®, Enduragen® and DuraMatrix® into dorsal subcutaneous pockets of mice and harvested them at 3, 6, 9 and 12 months. They noted that AlloDerm® had the greatest amount of host cell infiltration, DermaMatrix® and DuraMatrix® had intermediate number of cell infiltration followed by Enduragen® that had the least cell infiltration. They found a proportional relationship between the amount of host cell infiltration and implant resorption. However, their cellular density counts were based on nucleated cells stained with Hematoxylin and Eosin and specific cell types were not identified.
In the present study, a population of CD68+ macrophages was observed within the matrices, some of which did not stain positive for either M1 or M2 surface markers and some stained positive for both the markers. These CD 68+ cells that did not express any polarization markers may have only just arrived at the site of remodeling and, thus, might not yet have been stimulated to undergo activation or polarization towards an M1 or M2 phenotype. On the contrary, those CD68+ macrophages expressing both M1 and M2 markers could be resolution phase macrophages. Bystrom et al. [23] showed that macrophages isolated from the “resolution phase” of acute peritonitis possess a unique phenotype, expressing both M1 and M2 markers. AlloDerm®, Integra® and DermaMatrix® showed an increasing trend of M1/M2 coexpression over the time-points whereas DermACELL® showed a high co-expression on day 7 followed by a decreasing trend (Figure 8).
There were several limitations in the present study. First, the determination of M1 versus M2 phenotype was based upon a limited number of cell surface markers. Nevertheless, multiple studies have shown that CCR7 is highly expressed on M1 polarized cells [16] and that CD206 is indicative of M2 polarization [17,18]. In addition, it is reasonable to assume that cellular characterization of dynamic processes such as inflammation and remodeling are subject to inherent limitations associated with emerging paradigms and often-static nomenclature. Recent literature already suggests the existence of yet additional macrophage subtypes, adding expected dimensions and complexity to a heterogenic cell population that is highly influenced by real-time, in vivo microenvironments [24]. Finally, the immune/inflammatory response of rats may not accurately reflect that of humans—especially in response to human-derived tissues. Despite these challenges and limitations, recent work in our lab [25] takes the field a step closer to elucidating quantifiable differences in host response to different matrices on a cellular level, and provides an objective foundation upon which to gather, compare and associate clinical use and outcomes.
5. CONCLUSION
In short, this study demonstrates that different ADMs, processed and manufactured using different methods, elicit differing patterns and timeframes of macrophage infiltration. Although direct cause and effect relationships remain to be explored, there appears to be a strong correlation between macrophage subtypes and remodeling response. Further work to elucidate these findings over longer periods of time and within the context of clinical use and outcomes could lead to rational choices in use of these materials for differing clinical applications.
6. ACKNOWLEDGEMENTS
We would like to thank Christopher A. Moskaluk MD, PhD and J. Tyler Green MD, UVA, Department of Pathology, for their assistance with histopathologic analysis. Also, we are very thankful to Stephen F. Badylak, MD, PhD, Shayn M. Peirce-Cottler, PhD, Ricardo Londono, and John M. Sanders for helping with immuno-staining. We also acknowledge the unrestricted donation of DermACELL® and DermaMatrix® used in this study.
7. STATEMENT OF AUTHORSHIP
All authors have made substantial contributions to one or more of the following: 1) the conception and design of the study, or acquisition of data, or analysis and interpretation of data; 2) drafting the article or revising it critically for important intellectual content; and 3) final approval of the version to be submitted.
The manuscript, including related data, figures, and tables, has not been previously published, and the manuscript is not under consideration elsewhere.
8. CONFLICTS OF INTEREST
None of the authors have a financial interest in any of the products used in this experiment. Dr. Katz has previously been a paid consultant to LifeNet Health. We acknowledge the unrestricted donation of DermACELL® and DermaMatrix® used in this study.
REFERENCES
- Lattari, V., Jones, L.M., Varcelotti, J.R., et al., (1997) The use of a permanent dermal allograft in full-thickness burns of the hand and foot: A report of three cases. Journal of Burn Care & Rehabilitation, 18, 147-155. doi:10.1097/00004630-199703000-00010
- Wainwright, D.J. (1995) Use of an acellular allograft dermal matrix (AlloDerm) in the management of full-thickness burns, Burns, 21, 243-248. doi:10.1016/0305-4179(95)93866-I
- Hartzell, T.L., Taghinia, A.H., Chang, J., et al. (2010) The use of human acellular dermal matrix for the correction of secondary deformities after breast augmentation: Results and costs. Plastic & Reconstructive Surgery, 126, 1711- 1720. doi:10.1097/PRS.0b013e3181ef900c
- Tobin, H.A. and Karas, N.D. (1998) Lip augmentation using an alloderm graft. Journal of Oral and Maxillofacial Surgery, 56, 722-727. doi:10.1016/S0278-2391(98)90805-9
- Han, J.G., Wang, Z.J., Gao, Z.G., et al. (2010) Pelvic floor reconstruction using human acellular dermal matrix after cylindrical abdominoperineal resection. Diseases of the Colon & Rectum, 53, 219-223. doi:10.1007/DCR.0b013e3181b715b5
- Kinsella Jr., C.R., Grunwaldt, L.J., Cooper, G.M., et al. (2010) Scalp reconstruction: Regeneration with acellular dermal matrix. Journal of Craniofacial Surgery, 21, 605- 607. doi:10.1097/SCS.0b013e3181d08cee
- Garramone, C.E. and Lam, B. (2007) Use of AlloDerm in primary nipple reconstruction to improve long-term nipple projection. Plastic & Reconstructive Surgery, 119, 1663-1668. doi:10.1097/01.prs.0000258831.38615.80
- Topol, B.M., Dalton, E.F., Ponn, T., et al. (2008) Immediate single-stage breast reconstruction using implants and human acellular dermal tissue matrix with adjustment of the lower pole of the breast to reduce unwanted lift. Annals of Plastic Surgery, 61, 494-499. doi:10.1097/SAP.0b013e31816d82d9
- Anderson, J.M., Rodriguez, A. and Chang D.T. (2008) Foreign body reaction to biomaterials. Seminars in Immunology, 20, 86-100. doi:10.1016/j.smim.2007.11.004
- Valentin, J.E., Badylak, J.S., McCabe, G.P. and Badylak, S.F. (2006) Extracellular matrix bioscaffolds for orthopaedic applications. A comparative histologic study. The Journal of Bone and Joint Surgery, 88, 2673-2686. doi:10.2106/JBJS.E.01008
- Mosser, D.M. (2003) The many faces of macrophage activation. Journal of Leukocyte Biology, 73, 209-212. doi:10.1189/jlb.0602325
- Mantovani, A., Sica, A. and Locati, M. (2005) Macrophage polarization comes of age. Immunity, 23, 344-346. doi:10.1016/j.immuni.2005.10.001
- Stout, R.D., Jiang, C., Matta, B., Tietzel, I., Watkins, S.K. and Suttles, J. (2005) Macrophages sequentially change their functional phenotype in response to changes in microenvironmental influences. Journal of Immunology, 175, 342-349.
- Kadl, A., Meher, A.K., Sharma, P.R., Lee, M.Y., Doran, A.C., Johnstone, S.R., et al. (2010) Identification of a novel macrophage phenotype that develops in response to atherogenic phospholipids via Nrf2. Circulation Research, 107, 737-746. doi:10.1161/CIRCRESAHA.109.215715
- Martinez, F.O., Helming, L. and Gordon, S. (2009) Alternative activation of macrophages: An immunologic functional perspective. Annual Review of Immunology, 27, 451-483. doi:10.1146/annurev.immunol.021908.132532
- Mantovani, A., Sica, A., Sozzani, S., Allavena, P., Vecchi, A. and Locati, M. (2004) The chemokine system in diverse forms of macrophage activation and polarization. Trends in Immunology, 25, 677-686. doi:10.1016/j.it.2004.09.015
- Stein, M., Keshav, S., Harris, N., et al. (1992) Interleukin 4 potently enhances murine macrophage mannose receptor activity: A marker of alternative immunologic macrophage activation. The Journal of Experimental Medicine, 176, 287-292. doi:10.1084/jem.176.1.287
- Dupasquier, M., Stoitzner, P., Wan, H., et al. (2006) The dermal microenvironment induces the expression of the alternative activation marker CD301/mMGL in mononuclear phagocytes, independent of IL-4/IL-13 signaling. Journal of Leukocyte Biology, 80, 838-849. doi:10.1189/jlb.1005564
- Gilbert, T.W., Sellaro, T.L. and Badylak, S.F. (2006) Decellularization of tissues and organs. Biomaterials, 27, 3675-3683.
- Valentin, J.E., Stewart-Akers, A.M., Gilbert, T.W. and Badylak, S.F. (2009) Macrophage participation in the degradation and remodeling of ECM scaffolds. Tissue Engineering Part A, 15, 1687-1694. doi:10.1089/ten.tea.2008.0419
- Badylak, S.F., Valentin, J.E., Ravindra, A.K., McCabe, G.P. and Stewart-Akers, A.M. (2008) Macrophage phenotype as a determinant of biologic scaffold remodelling. Tissue Engineering Part A, 14, 1835-1842. doi:10.1089/ten.tea.2007.0264
- Cole, P.D., Stal, D., Sharabi, S.E., Hicks, J. and Hollier, L.H. (2011) A comparative, long-term assessment of four soft tissue substitutes. Aesthetic Surgery Journal, 31, 674- 681. doi:10.1177/1090820X11415393
- Bystrom, J., Evans, I., Newsson, J., Stables, M., Toor, I., Van, R.N., Crawford, M., Colville-Nash, P., Farrow, S. and Gilroy, D.W. (2008) Resolution-phase macrophages possess a unique inflammatory phenotype that is controlled by cAMP. Blood, 15, 4117-4127. doi:10.1182/blood-2007-12-129767
- Morris, D.L., Singer, K. and Lumeng, C.N. (2011) Adipose tissue macrophages: Phenotypic plasticity and diversity in lean and obese states. Current Opinion in Clinical Nutrition & Metabolic Care, 14, 341-346. doi:10.1097/MCO.0b013e328347970b
- Capito, A.E., Tholpady, S.S., Agrawal, H., Drake, D.B. and Katz, A.J. (2012) Evaluation of host tissue integration, revascularization, and cellular infiltration within various dermal substrates. Annals of Plastic Surgery, 68, 495-500. doi:10.1097/SAP.0b013e31823b6b01
NOTES
*Ethical adherence: Procedures were performed with approval of the University of Virginia Animal Care and Use Committee (ACUC).
#Funding support: This project was funded by the Armed Forces Institute of Regenerative Medicine (AFIRM).