American Journal of Climate Change
Vol.1 No.1(2012), Article ID:18076,8 pages DOI:10.4236/ajcc.2012.11005
Regional Evaluations of the Meteorological Drought Characteristics across the Pearl River Basin, China
1Department of Water Resources and Environment, Sun Yat-sen University, Guangzhou, China
2Key Laboratory of Water Cycle and Water Security in Southern China of Guangdong High Education Institute, Sun Yat-sen University, Guangzhou, China
3School of Geography and Planning, and Guangdong Key Laboratory for Urbanization and Geo-Simulation, Sun Yat-sen University, Guangzhou, China
Email: zhangq68@mail.sysu.edu.cn
Received February 19, 2012; revised March 8, 2012; accepted March 18, 2012
Keywords: Regional Drought; Severity-Area-Frequency Curves; Cluster Algorithm; The Pearl River Basin
ABSTRACT
Regional evaluation of drought characteristics provides critical information for water resource management. In this case, this study attempts to analyze the probability behaviors of drought events of a given severity in the Pearl River Basin and to construct severity-area-frequency curves of drought events. Due to possible impacts of complicated topographical properties and diverse climate types within the Pearl River Basin, the entire Pearl River Basin is subdivided into different homogeneous regions. In general, the Pearl River Basin can be categorized into four homogeneous regions, and the severity-area-frequency analysis results for the short-, mediumand long-term drought episodes within each homogeneous regions indicate stressful challenge for the water resource management in the Pearl River Basin due to the fact that severe droughts usually occur over the entire Pearl River Basin. Meanwhile, the Pearl River Delta will face a higher risk of drought when compared to other regions of the Pearl River Basin in terms of the medium-term drought. The Pearl River Basin is highly economically development and is heavily populated, thus impacts of droughts and related resilience resolutions or policies should be taken into account in the formulation of regional sustainable development of water resources and socio-economy within the Pearl River Basin, China.
1. Introduction
Droughts are long-term phenomena affecting large regions inflicting significant damages both on human lives and on socio-economy. Drought event is generally considered as periods being characterized with insufficient precipitation, soil moisture and water resources for supporting the socio-economic activities of a region. However there is not a universal definition of drought due to the wide variety of sectors affected by drought, its diverse geographical and temporal distribution and the demand placed on water supply by human-use systems. The most well-known and widely used classification of droughts is the classification initially proposed by Dracup et al. [1] and is integrated later by Wilhite and Glantz [2]. The American Meteorological Society [3] adopted this drought classification system. Based on the nature of the water deficit, four types of droughts are defined: a) the meteorological drought; b) the hydrological drought; c) the agricultural drought; and d) the socio-economic drought. This study focuses on the meteorological drought which is defined as deficit of precipitation over a region within a certain time interval.
As droughts are regional in nature and commonly cover large areas and extend for long time periods, it is important to study such events within a regional backdrop. Regional evaluations of drought characteristics can provide critical reference information for different water-related activities, and should be included in strategic shortand long-term plans for adequate water resource management [4]. The properties of regional droughts can be studied through regional drought characteristics like the area covered by drought and total precipitation deficit over the drought area. A method to estimate severityarea-frequency (SAF) curves has been used in this study to estimate the return periods of annual regional droughts.
Droughts are usually indicated by drought indices, the most commonly-used meteorological drought indices are: 1) Rainfall deciles [5]; 2) the Palmer Drought Severity Index (PDSI) [6]; and 3) the Standardized Precipitation Index (SPI) [7]. In quantification of precipitation deficit for multiple time scales and evaluations of the impact of drought on the availability of water resources, the standardized precipitation index (SPI) was considered as a prior drought index to construct Severity-Area-Frequency (SAF) curves and is also used in this study.
Drought is a slowly-developing phenomenon, only indirectly affecting human life. However, recent years have shown how vulnerable even so-called humid area like south China can be to drought, when several severe and prolonged water deficit periods, such as the severe drought in southwest China 2010 year and south China 2011 year, have caused major environmental, social and economic problems. The Pearl River is the second largest river by water volume in China and the third largest river in drainage area. However, uneven spatial and temporal distribution of water resources, with almost 80% of the total precipitation occurring in the flooding seasons, i.e. April-September, negatively affects the effective human use of water resource. And quality-induced water shortage further deteriorates its regional water security. The East River, one of the major tributaries of the Pearl River Basin, is responsible for the primary annual water demand of major cities such as Hong Kong, Guangzhou, Shenzhen, Dongguan, Heyuan and Huizhou, with over forty million dwellers in total [8]. Considering the significance of water security in the Pearl River Basin, an improved understanding of the characteristic of drought in the Pearl River Basin is of paramount importance to formulating a regional water resources management strategy for the basin.
Meanwhile, the Pearl River Basin is characterized by complex terrain features, being shifting gradually from an altitude of 2000 - 3000 meters of the Yunnan-Guizhou Plateau transition to the hilly areas with altitude of about 500 meters from northwest to southeast sections of the Pearl River Basin. And the precipitation in the Pearl River Basin is affected by the southwesterly and the southeasterly flow. Besides, principle factors influencing precipitation changes in both space and time are different in different parts of the Pearl River Basin, in this case, the Pearl River Basin can’t be accepted as a homogeneous region and should be clustered into several homogenous regions for the sake of analysis of drought changes in specific region within the Pearl River Basin.
With this in mind, the objectives of this paper are: 1) to classify homogenous regions across the Pear River basin using cluster algorithm; 2) to construct the Severity-Area-Frequency (SAF) curves within each homogenous region. Besides, implications of drought features within each specific region on water resources management will also be discussed based on results obtained in this study and also on published literatures.
2. Study Region and Data
The Pearl River (102˚14′E-115˚53′E; 21˚31′N-26˚49′N), illustrated in Figure 1, is the second largest river by volume and the third largest river in term of drainage

Figure 1. Study region and meteorological stations.
basin area in China. The Pearl River Basin drainage area is 4.573 × 10⁵ km2, with three major tributaries: West River, North River and East River. The Pearl River Basin is located in the tropical and sub-tropical climate zones. The annual mean temperature ranges from 14˚C to 22˚C, multi-annual average precipitation is 1525.1 mm. Precipitation during April-September accounts for 80% of the yearly total. The Pearl River Basin, especially the Pearl River Delta region, is economically developed and is of great importance in the socio-economic development of China. More detailed information of the study region can be referred to [9]. The daily precipitation dataset covering 1 January 1960-31 December 2005 was collected from 42 rain stations in the Pearl River Basin. Location of the meteorological stations can be referred to Figure 1. Data quality control was done in [9].
3. Methodology
3.1. Construction of SAF Curves
The following procedure was employed in this study for deriving drought severity-area-frequency (SAF) curves [10]: 1) Identify the drought variable of a suitable timescale to be used for estimating drought properties (severity); 2) Apply the theory of runs to drought variables, and find drought properties, and calculate the drought severity for the development of drought SAF curves; 3) Estimate the drought severity associated with different areal extents (in terms of percentage of total area), taking different areal thresholds into account using a suitable spatial interpolation technique; 4) Test drought severity for different areal extents using different probability distributions to determine the best distribution for frequency analysis; 5) Perform frequency analysis using the selected probability distribution for drought severity of different area extents in order to associate drought severity with different return periods; and 6) Construct the drought Severity-Area-Frequency (SAF) curves for the region under consideration.
The standardized precipitation index (SPI) was considered as a drought variable, and as the droughts corresponding to the short-, mediumand long-term periods are of great importance for different water resource management. Then 3, 6 and 9 months respectively are selected as the time scale of SPI to construct the severity-areafrequency curves for each homogeneous region in this study. The Inverse Distance Weighting (IDW) approach was used for the spatial interpolation of precipitation over the Pear River basin, with grid-cells of 0.1˚ × 0.1˚ in latitude and longitude. These spatially interpolated precipitation data were used for calculation of the SPI series to characterize droughts in the basin. Try to avoid long duration drought events, the drought event lasting for a long time interval will be subdivided into two events, the hydrological annual values of drought severity is used for frequency analysis in this study. These severity values were fitted with Lognormal (Logn), General Extreme Value (GEV), General Pareto (GP), Pearson type III (PE3), and Gamma (Gam) probability distributions.
3.2. The Theory of Runs
The theory of runs as proposed by Yevjevich [11] is used to determine properties of hydrologic droughts (Figure 2). Based on the classification of drought (Table 1), the truncation level was held as –0.99 in this runs analysis. A hydrologic drought event is considered as an event during which SPI is continuously below the truncation level. Two important properties, drought duration and severity, are analyzed for each drought event. Drought duration is the period of time when SPI is continuously below the truncation level and drought severity is the cumulative deficit below the truncation level for the duration of a drought event.
3.3. Fuzzy C-Means clustering
The FCM algorithm is a modification of the K-means algorithm. The FCM algorithm minimizes intra-cluster variance [12] and includes grouping of sites using the clustering algorithm. The algorithm assumes that the attributes are from a vector space and is targeted to achieve a minimized total intracluster variance function Dv
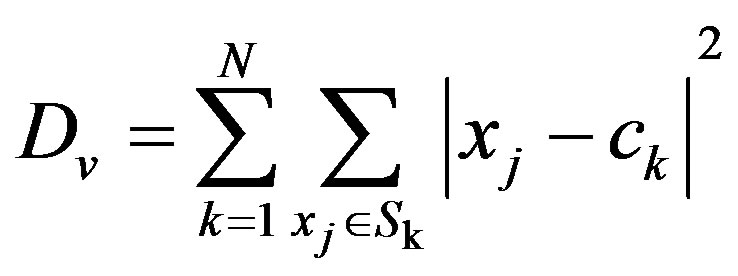 (1)
(1)
where ck is the centroid point of all the points in cluster k; N the total number of clusters; Sk the set of points in the kth cluster; xj the standardized vector for site j.
The FCM algorithm starts by making an initial set of k groups, then calculates the centroid point of each set. The next step is to construct a new partition by associating each point with the closest centroid. Then the centroids are recalculated for the new clusters and the algorithm is
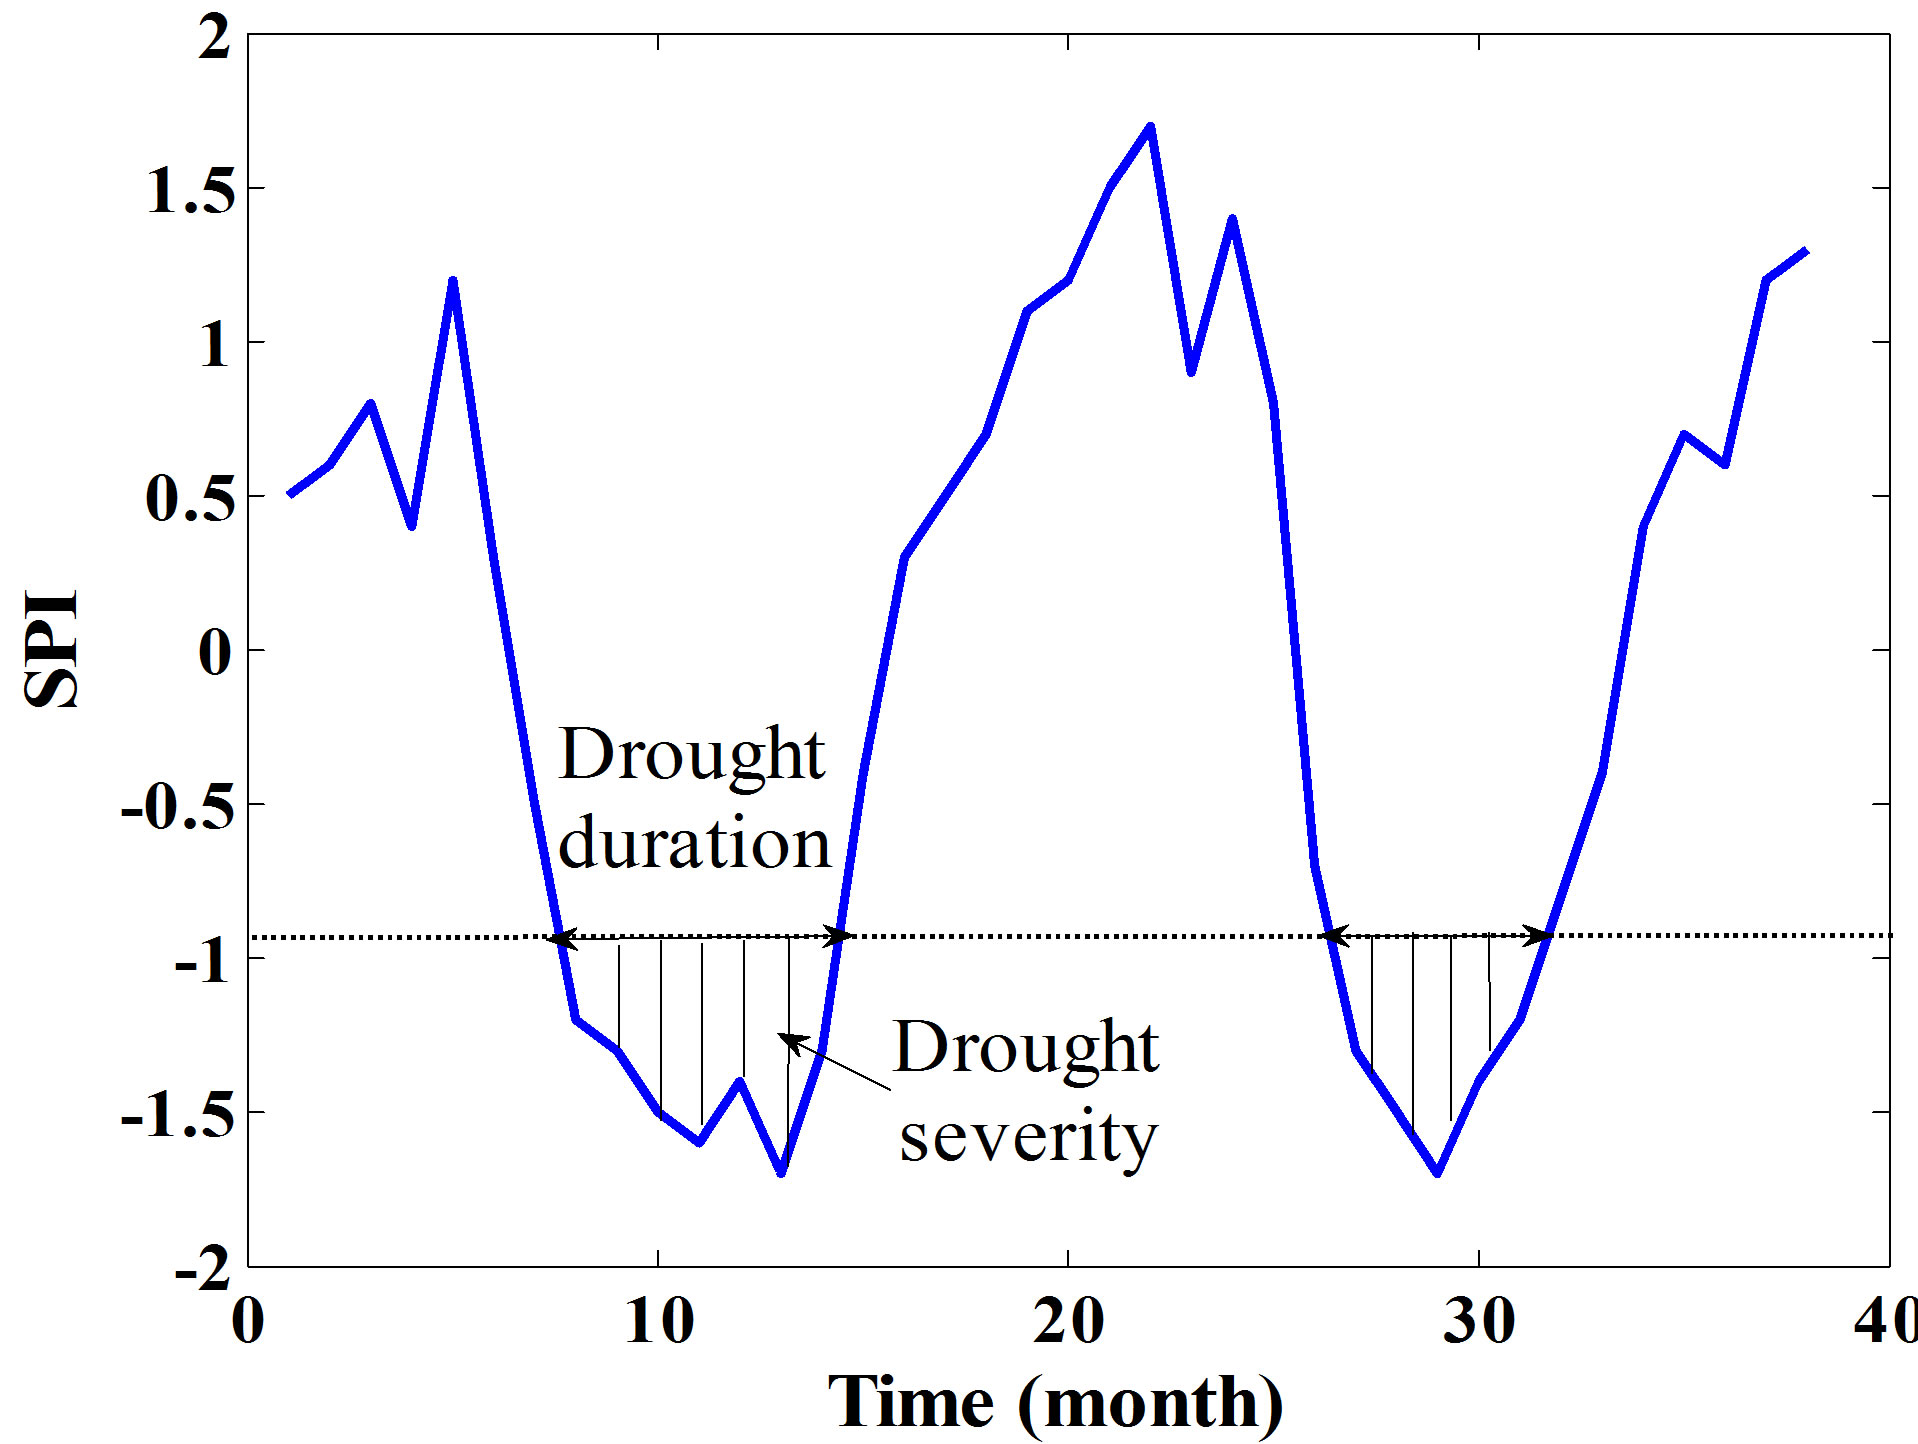
Figure 2. Definition of drought events using runs theory.
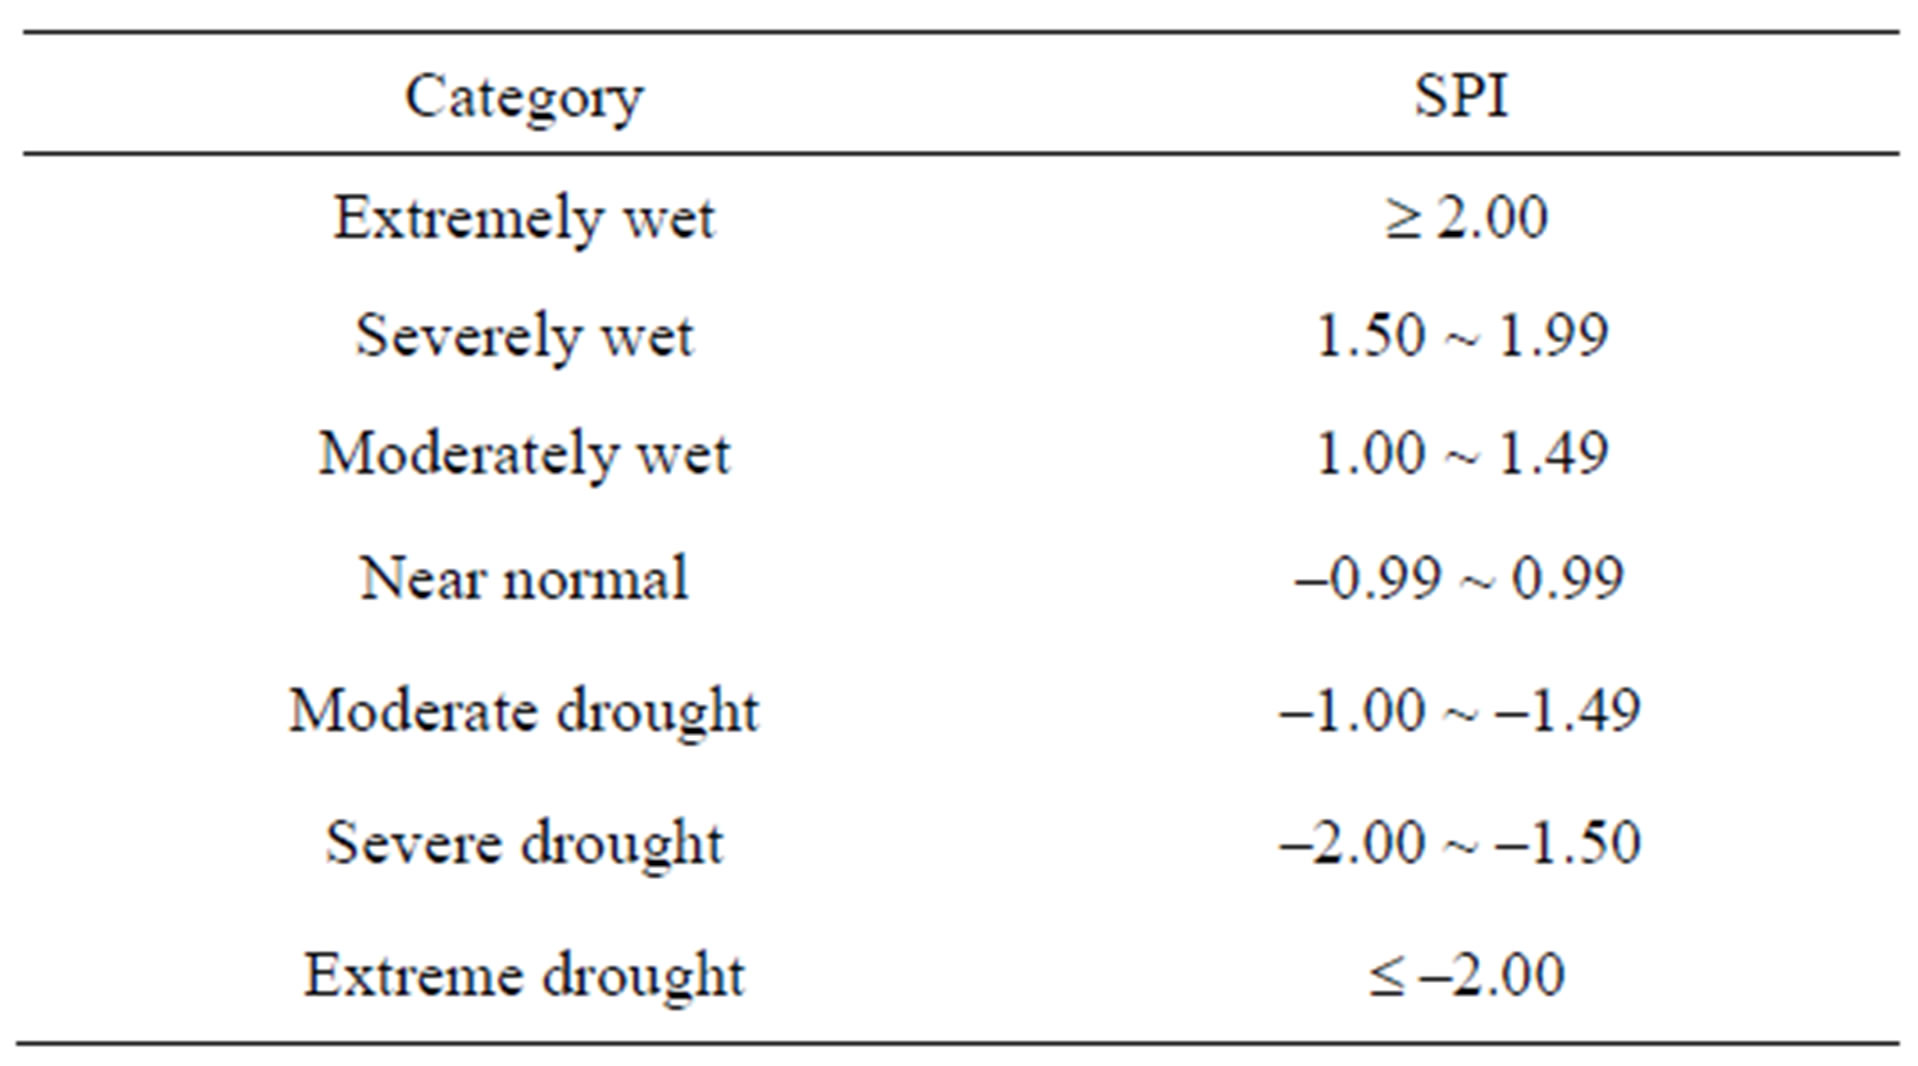
Table 1. The drought categories based on the standardized precipitation index (SPI).
repeated by alternate application of these two steps until convergence [13]. Like K-means, this algorithm minimizes intra-cluster variance, this is obtained when the points no longer switch clusters. In contrast to the K-means algorithm, which assigns each site to only one cluster, partial membership is permitted in FCM, meaning that each point has a degree of membership in each of the clusters. Thus points on the edge of a cluster may be in that cluster to a lesser degree than points in the centre of a cluster. The degree of belonging of site i in the kth cluster is equal to the inverse of the distance of site i to the centroid of cluster:
 (2)
(2)
where bk(i) is the degree that the site i belongs to the kth cluster, d(ck, i) the distance of site i to the centroid of cluster k. Each station is assigned to the cluster with which it has the highest degree of membership. The coefficients are normalized so that the sum of membership of one site of interest to all different clusters is unity [12], that is
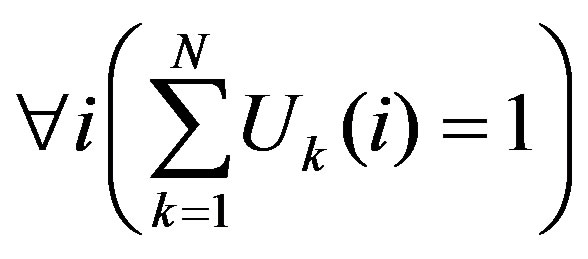 (3)
(3)
where Uk(i) is normalized coefficient of site i in the kth cluster.
4. Results
4.1. Homogenous Regions in the Pearl River Basin
As the annual precipitation mode is different in heterogeneous regions, homogenous regions are formed by identifying FCM clusters in the space of site characteristic of the median of month precipitation in a year. The Pear River basin is divided into 4 homogenous regions (Table 2). Station 42 is initially classified into region I, but since it is far away from region I in geographical distance, so the Station 42 is classified into region IV, similar is done for Station 11 from Regions IV to II.
This study introduces a method to achieve the boundary of the homogeneous regions. Firstly, the membership of any location belongs to each homogeneous region. This has been done by FCM cluster and then is interpolated across the Pearl River Basin by IDW respectively, getting the membership of any location belonging to each
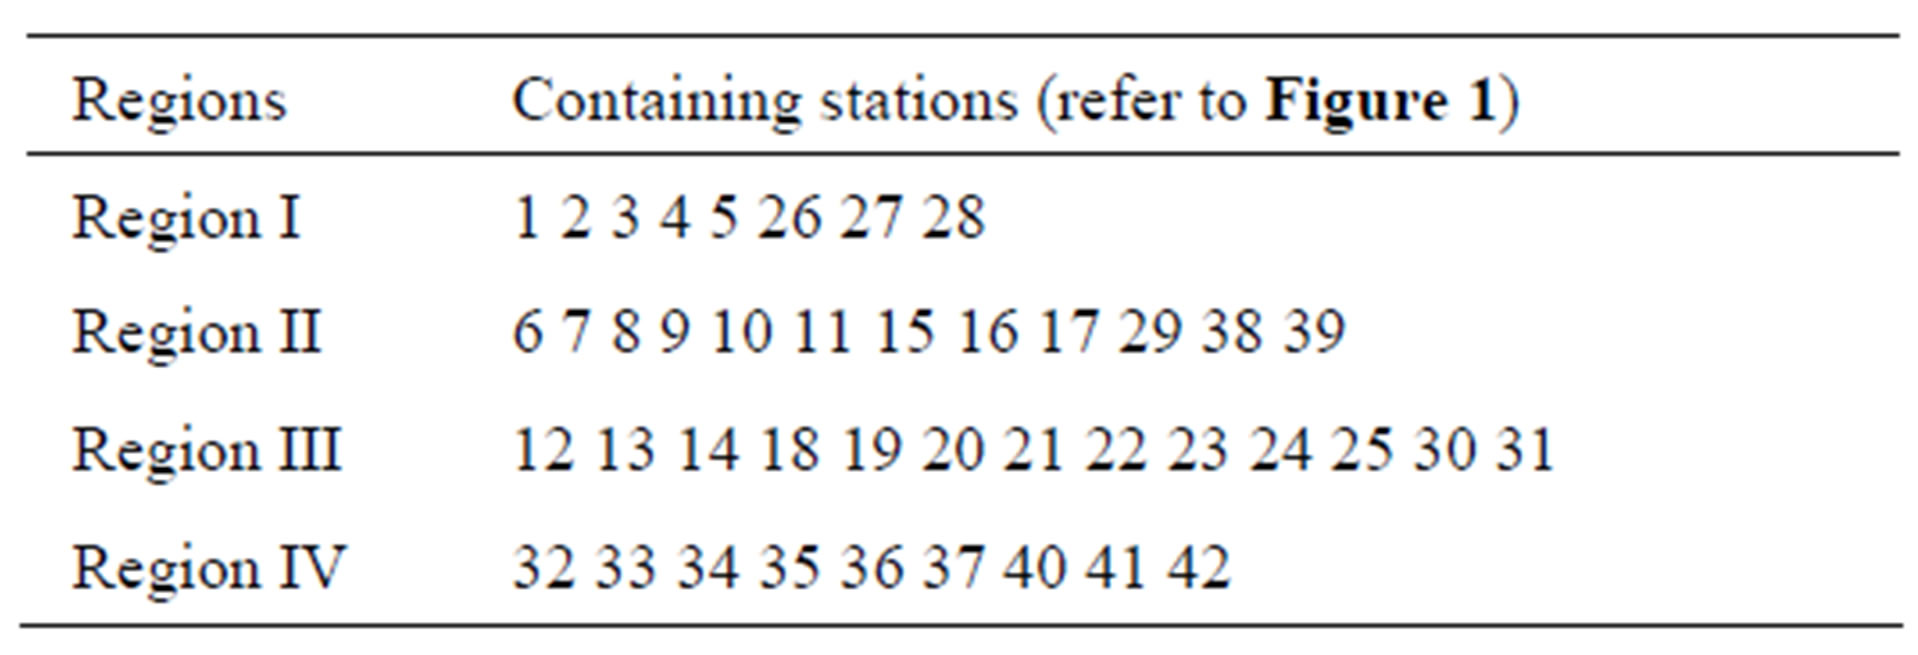
Table 2. The homogenous regions formed by identifying FCM clusters.
homogeneous region. And the location is considered to belong to the homogeneous region with largest membership. Thus we divide a location into a region by the least spatial distance away from a homogeneous region in the Pearl River Basin (Figure 3).
The distributions of median month precipitation in a year for each homogenous region in the Pearl River Basin have been calculated (Figure 3). If the consecutive six month with maximum precipitation in a year are considered as a rainy season, then the rainy season for Region I is from May to October; Region II is from April to September; Region III is from March to August and Region IV is from April to September. So the hydrological year can be defined as Region I from May to April in the following year, Region II from April to March in the following year, Region III from March to February in the following year, and Region IV from April to March in the next year.
4.2. SAF Curves
Droughts corresponding to the short-, mediumand longterm are of great importance for different water resource management strategies. Then the severity-area-frequency curves for each homogeneous region are constructed at 3, 6 and 9 months time scale of SPI respectively in this study. As all of the distributions have passed the K-S test at the 95% confidence level at all homogeneous regions, then the distribution with the least K-S statistic for most regions will be selected as the best fit distribution for each homogeneous region at any time scale of SPI (Table 3).
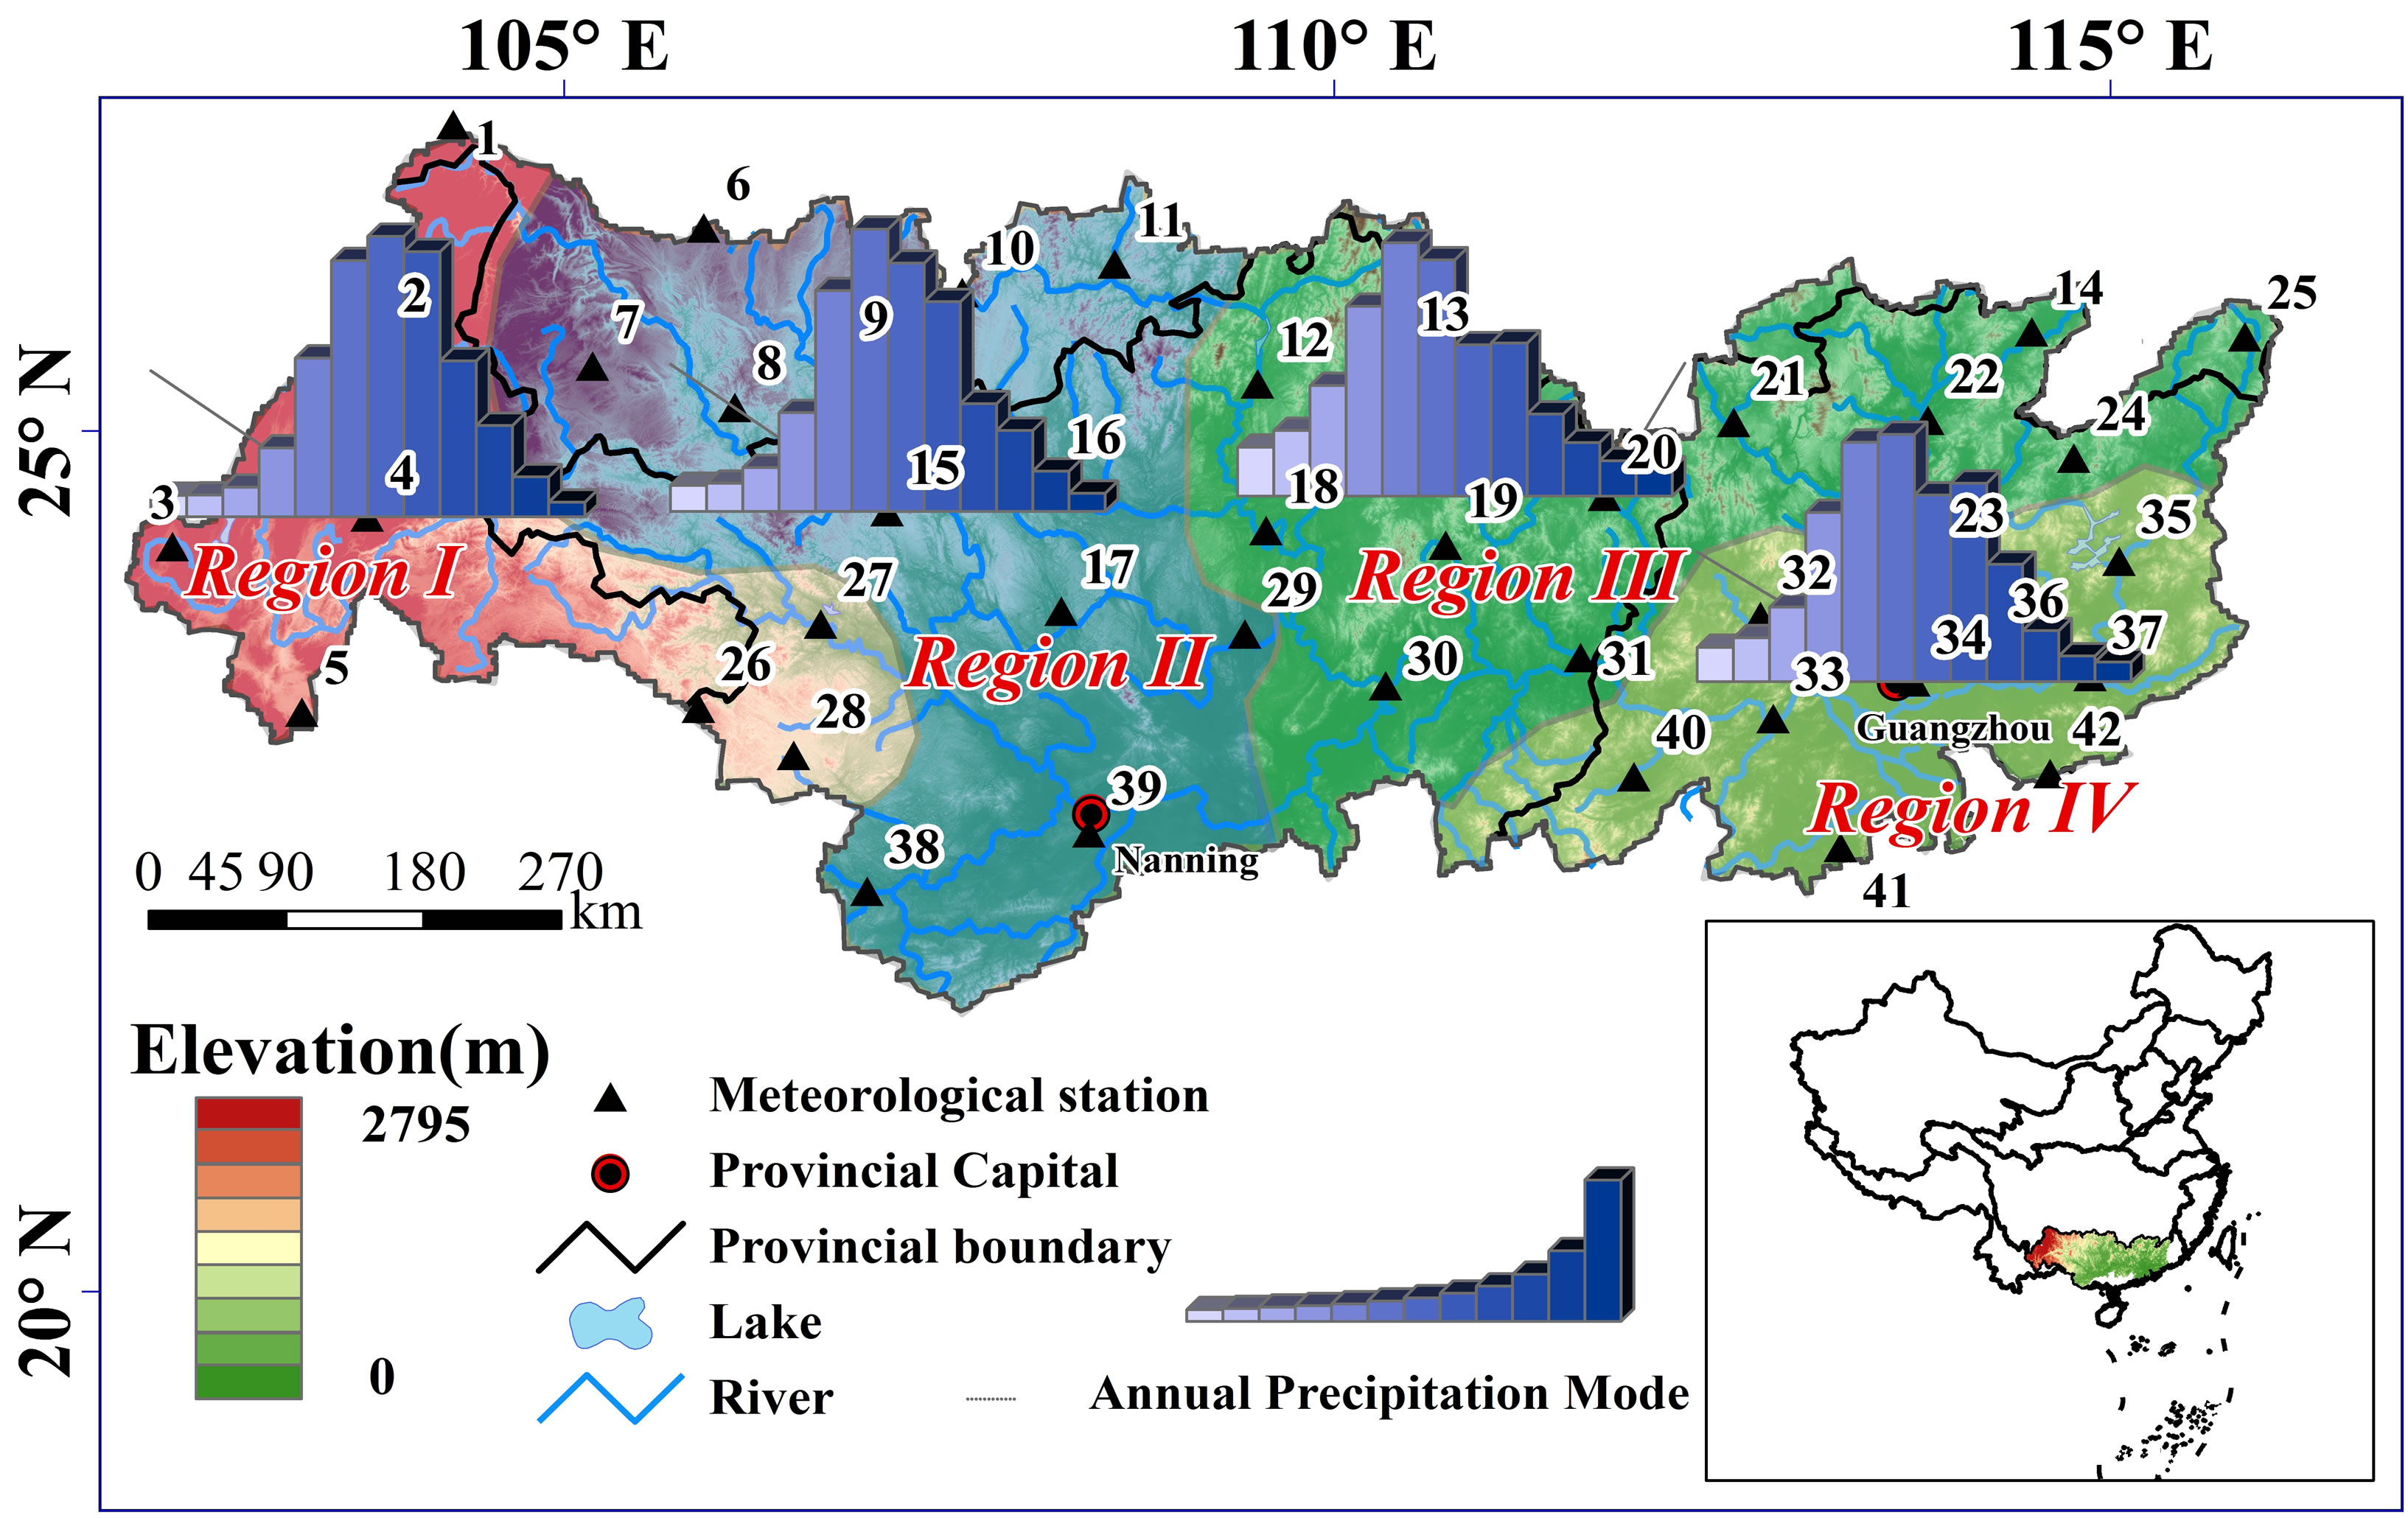
Figure 3. Homogenous regions for median month precipitation distribution in a year across the Pearl River Basin, and the annual precipitation mode for all homogenous regions in the Pearl River Basin are also illustrated.
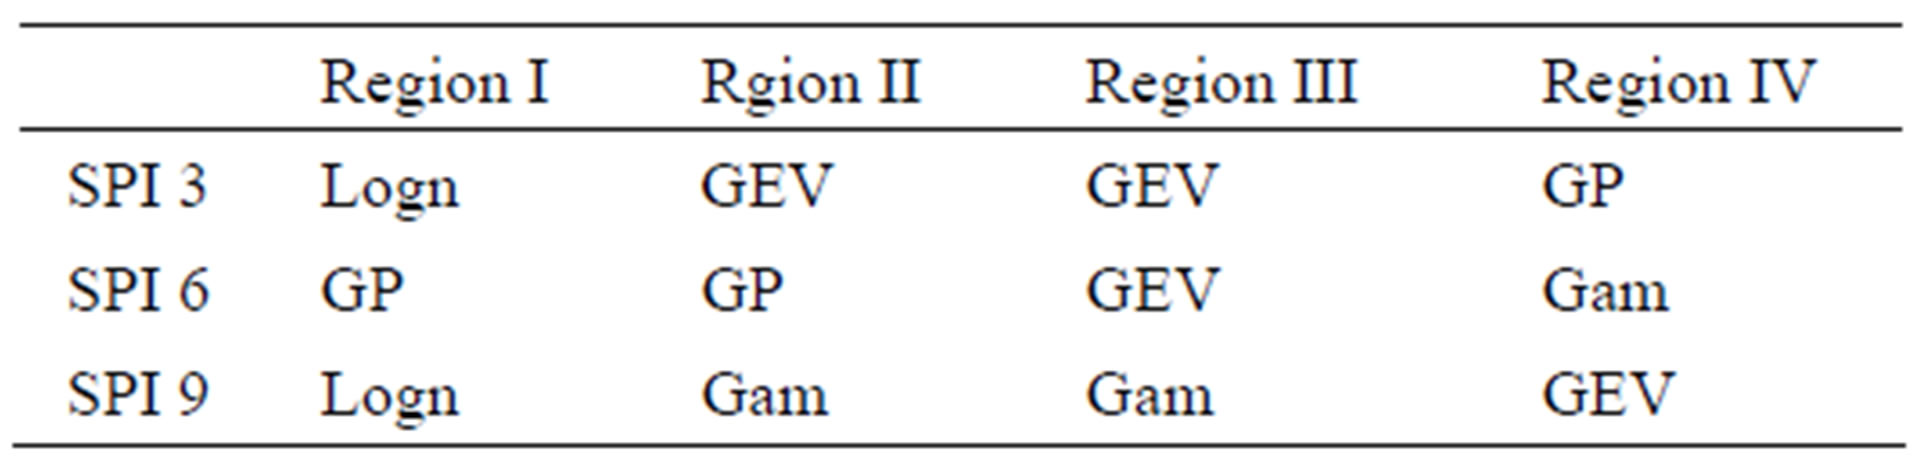
Table 3. The best fit distribution for each homogeneous region at different time scale of SPI, where GP, Logn, Gam and GEV denote Generalized Pareto, Lognormal, Gamma and General Extreme Value distribution respectively.
Figure 4 illustrates the severity-area-frequency curves of SPI 3 for each homogeneous region where (a) is for Region I, (b) for Region II, (c) for Region III and (d) for Region IV. Figure 4 demonstrates that three hydrological annual droughts with the highest severity in Region I occurs during 1992-1993, 1989-1990 and 1962-1963; in Region II during 1989-1990, 1963-1964 and 2003-2004; in Region III during 1963-1964, 1989-1990 and 1991- 1992; and in Region IV during 1963-1964, 1990-1991 and 1977-1978. It can be seen from Figure 4 that, in 1963 and 1990, the entire Pearl River Basin occurred a drought event of a high severity, so for short-term drought when there is a severe drought occurs over the entire Pearl River Basin. These kinds of occurrences of drought events pose considerable challenges for the water resource management in the Pearl River Basin. Meanwhile, when compared to the Severity-Area-Frequency curves for each homogeneous region, it shows that for shortterm drought the drought severity in Region III is higher than that in other regions with respect to the same return period within the same area extent while Region IV is an exception with droughts of lower severity.
Figure 5 shows the Severity-Area-Frequency curves of SPI 6 for each homogeneous region where (a) is for Region I, (b) for Region II, (c) for Region III and (d) for Region IV. Figure 5 demonstrates that the hydrological annual drought of the highest drought severity in Region I
 (a)
(a) (b)
(b)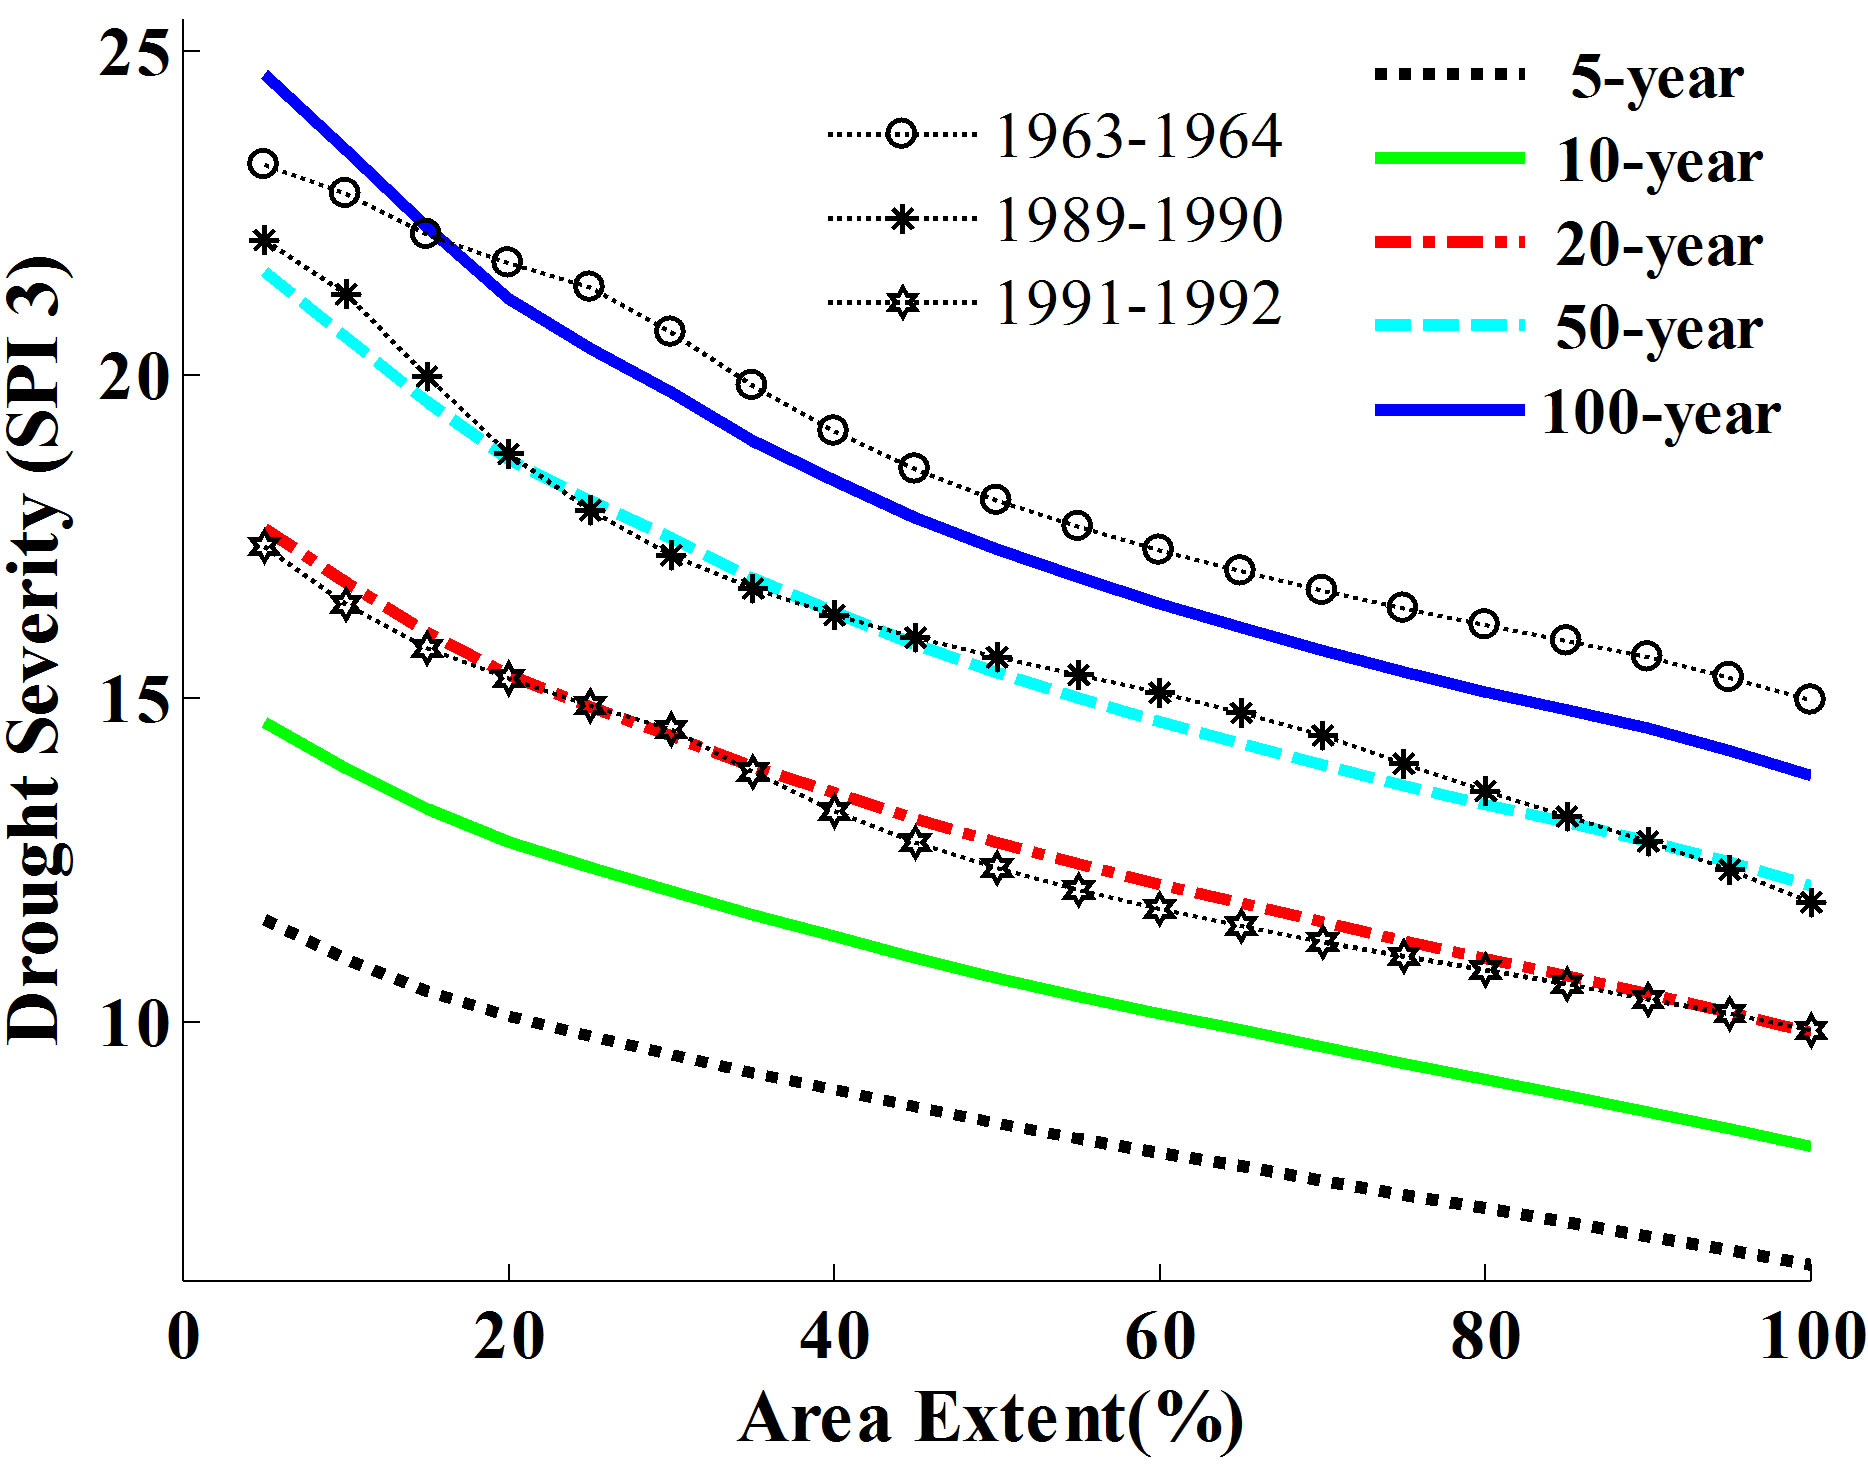 (c)
(c)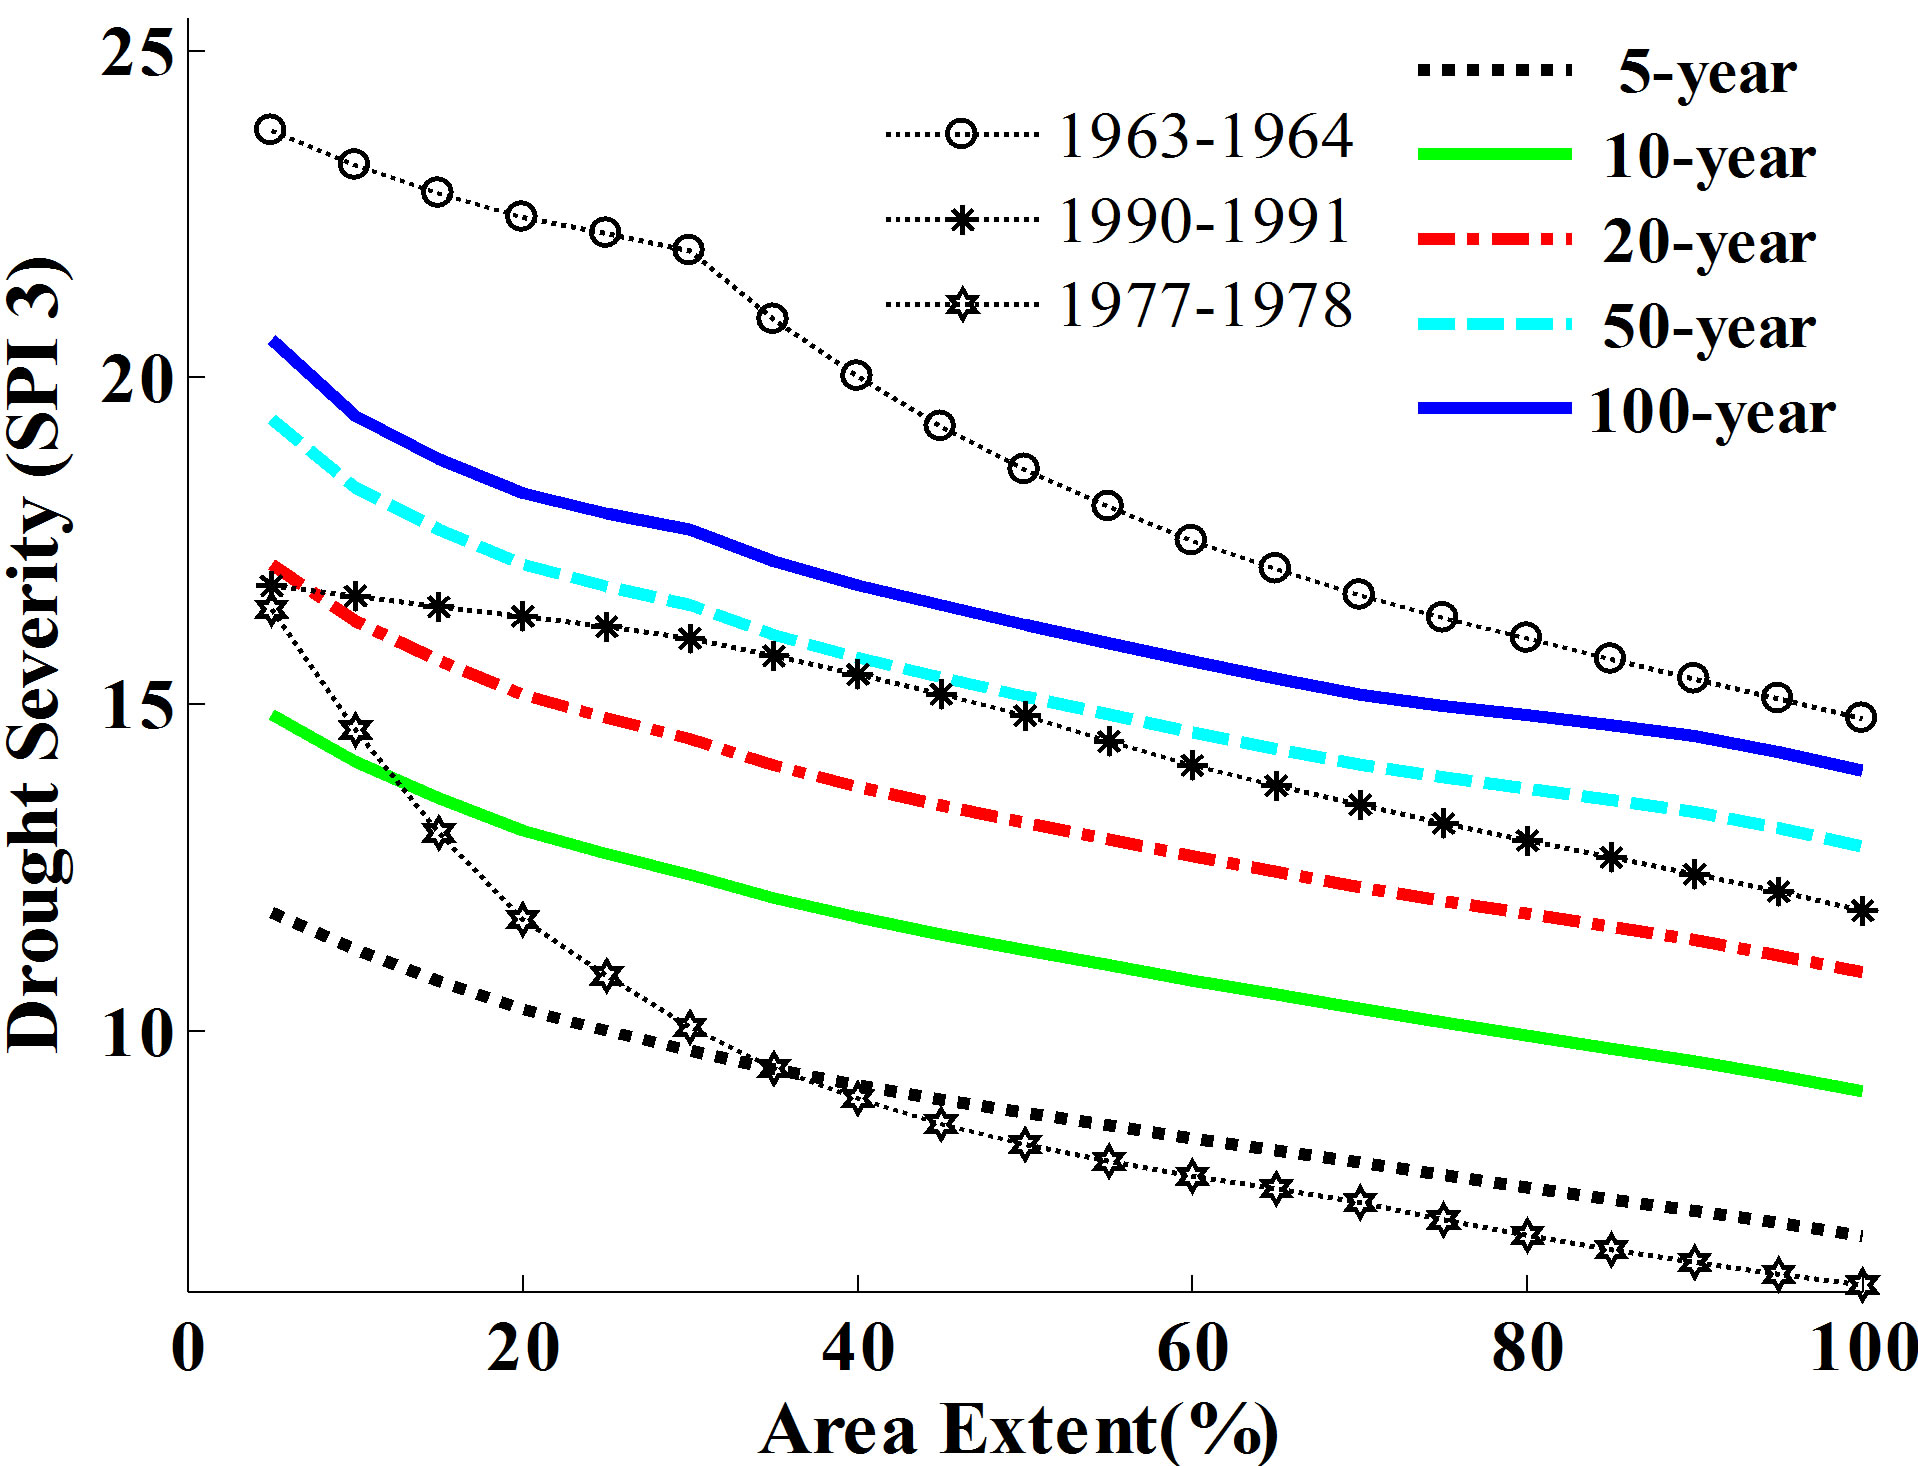 (d)
(d)
Figure 4. The Severity-Area-Frequency (SAF) curves of SPI 3 for each homogenous regions in the Pearl River Basin, (a) region I, (b) region II, (c) region III, and (d) region IV. And three most severity hydrological annual drought in that region are illustrated.
 (a)
(a)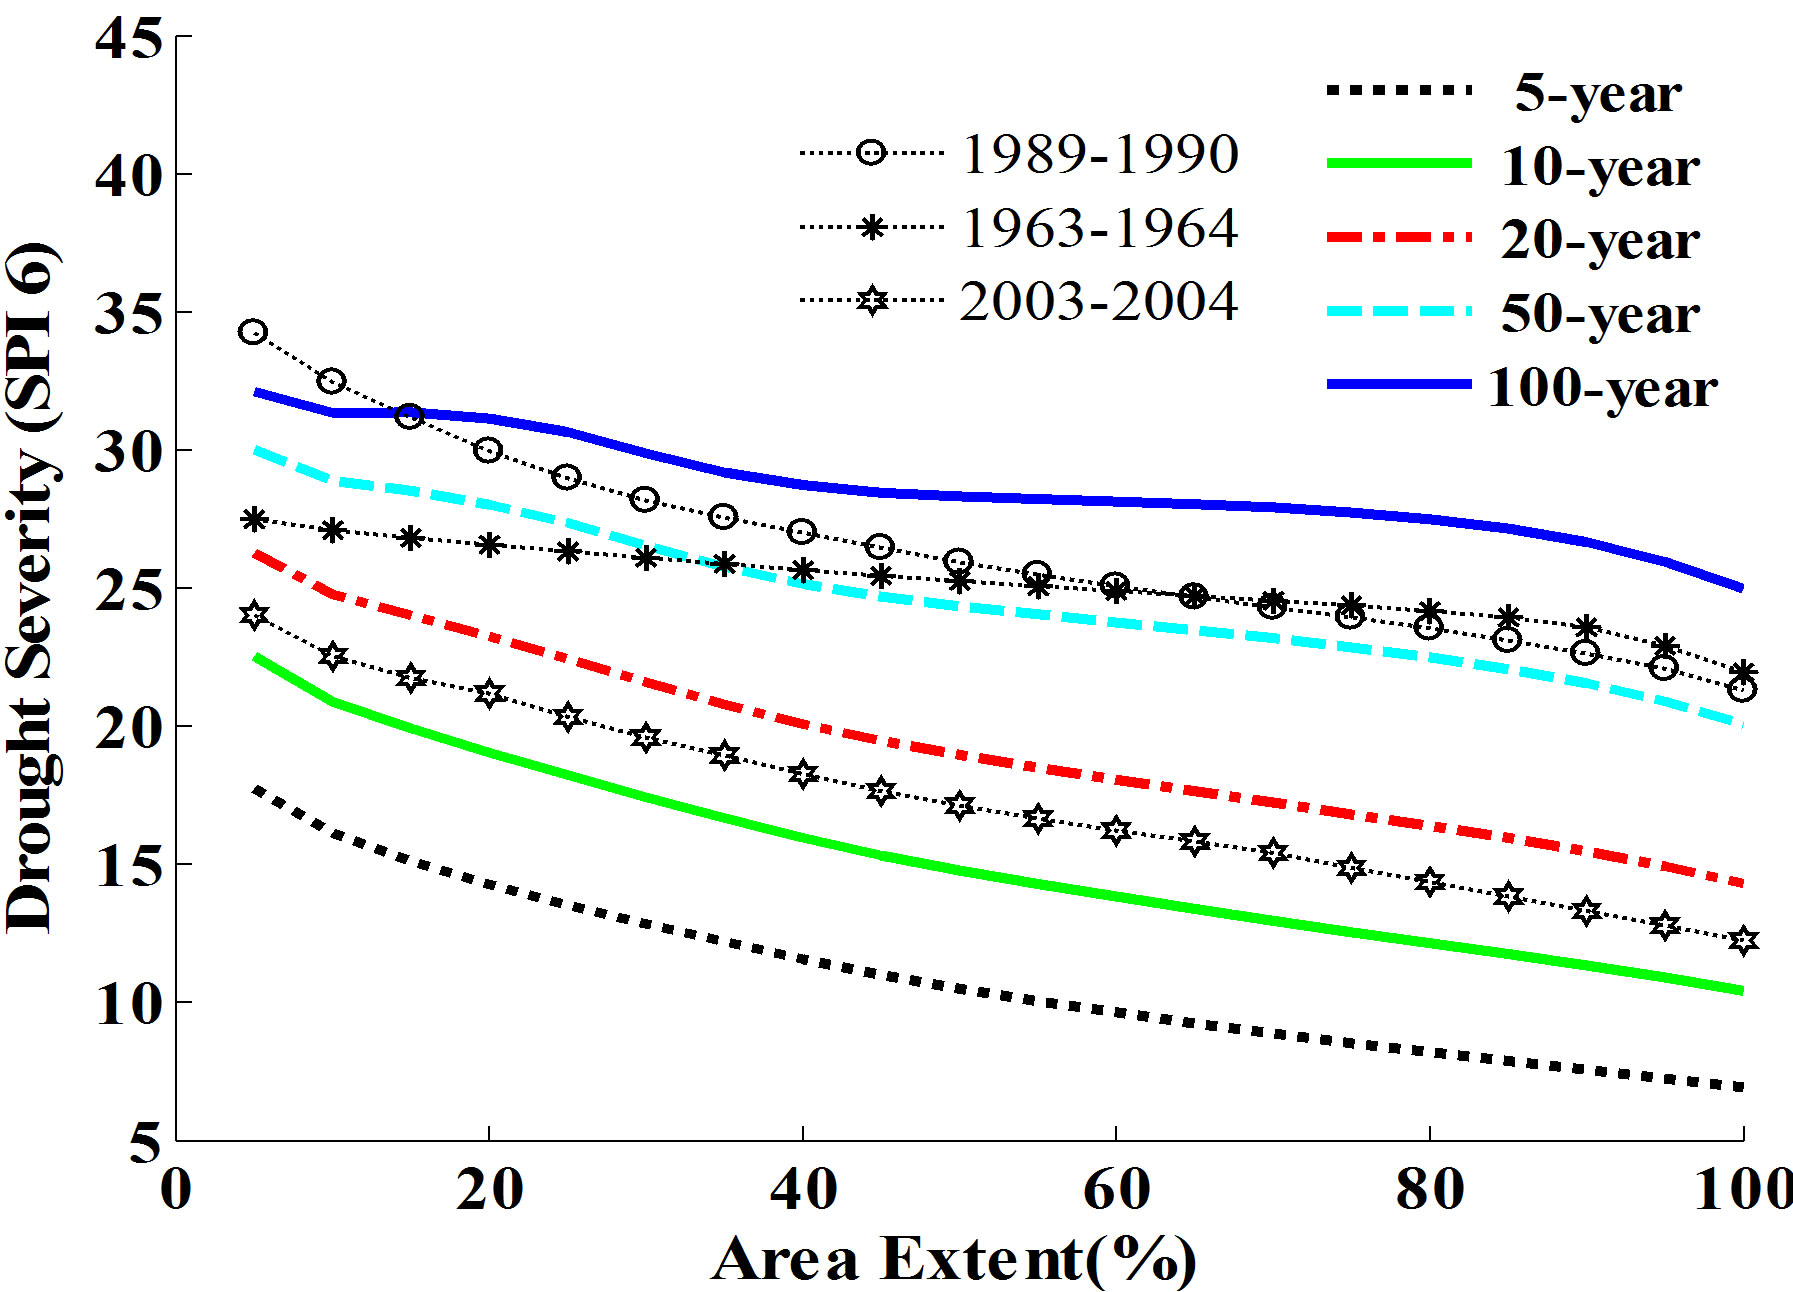 (b)
(b)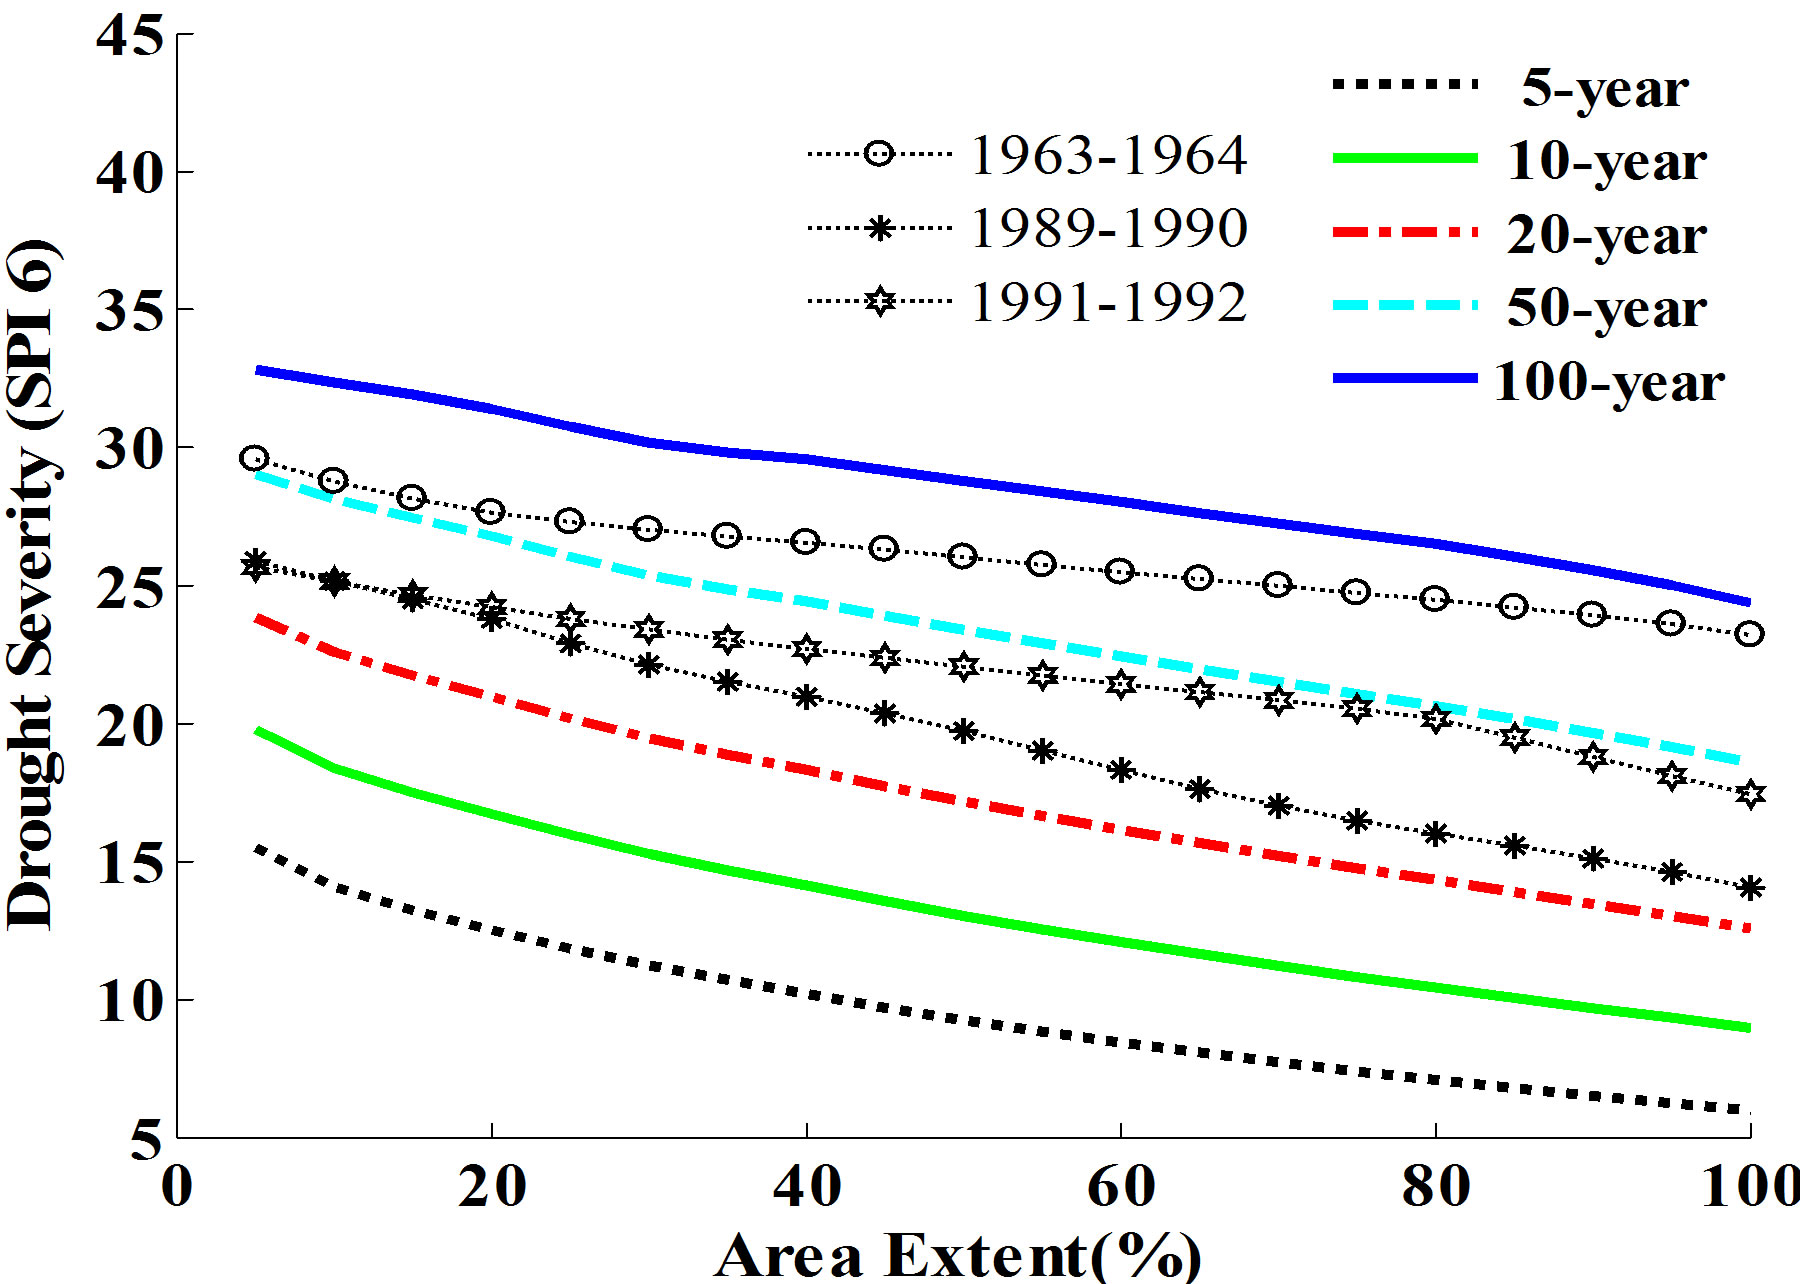 (c)
(c) (d)
(d)
Figure 5. The Severity-Area-Frequency (SAF) curves of SPI 6 for each homogenous regions in the Pearl River Basin, (a) region I, (b) region II, (c) region III, and (d) region IV. And three most severity hydrological annual drought in that region are illustrated.
is during 1989-1990, 1992-1993 and 2004-2005; in Region II is during 1989-1990, 1963-1964 and 2003- 2004; in Region III is during 1963-1964, 1989-1990 and 1991-1992; and in Region IV is during 1963-1964, 1990- 1991 and 2004-2005. Also can be seen is that for the medium-term drought, when there is a severe drought, there usually occurs severe drought events over the entire Pearl River Basin. Meanwhile, when compared to the Severity-Area-Frequency curves for each homogeneous region, it can be shown that, for the medium-term drought, the drought severity in Region IV is higher than that in other regions with the same return period in the same area extent; while drought severity for droughts in Region III is relatively lower.
The Region IV is where the Pearl River Delta is located, and the Pearl River Delta is one of the highly economically developed regions in China with dense cities and large population, a high risk of medium-term droughts will undoubtedly pose tremendous challenges for regional economic development and social stability of that region. In this sense, effective and integrated water resources management is an urgent necessity for the sustainable development of the local socio-economy.
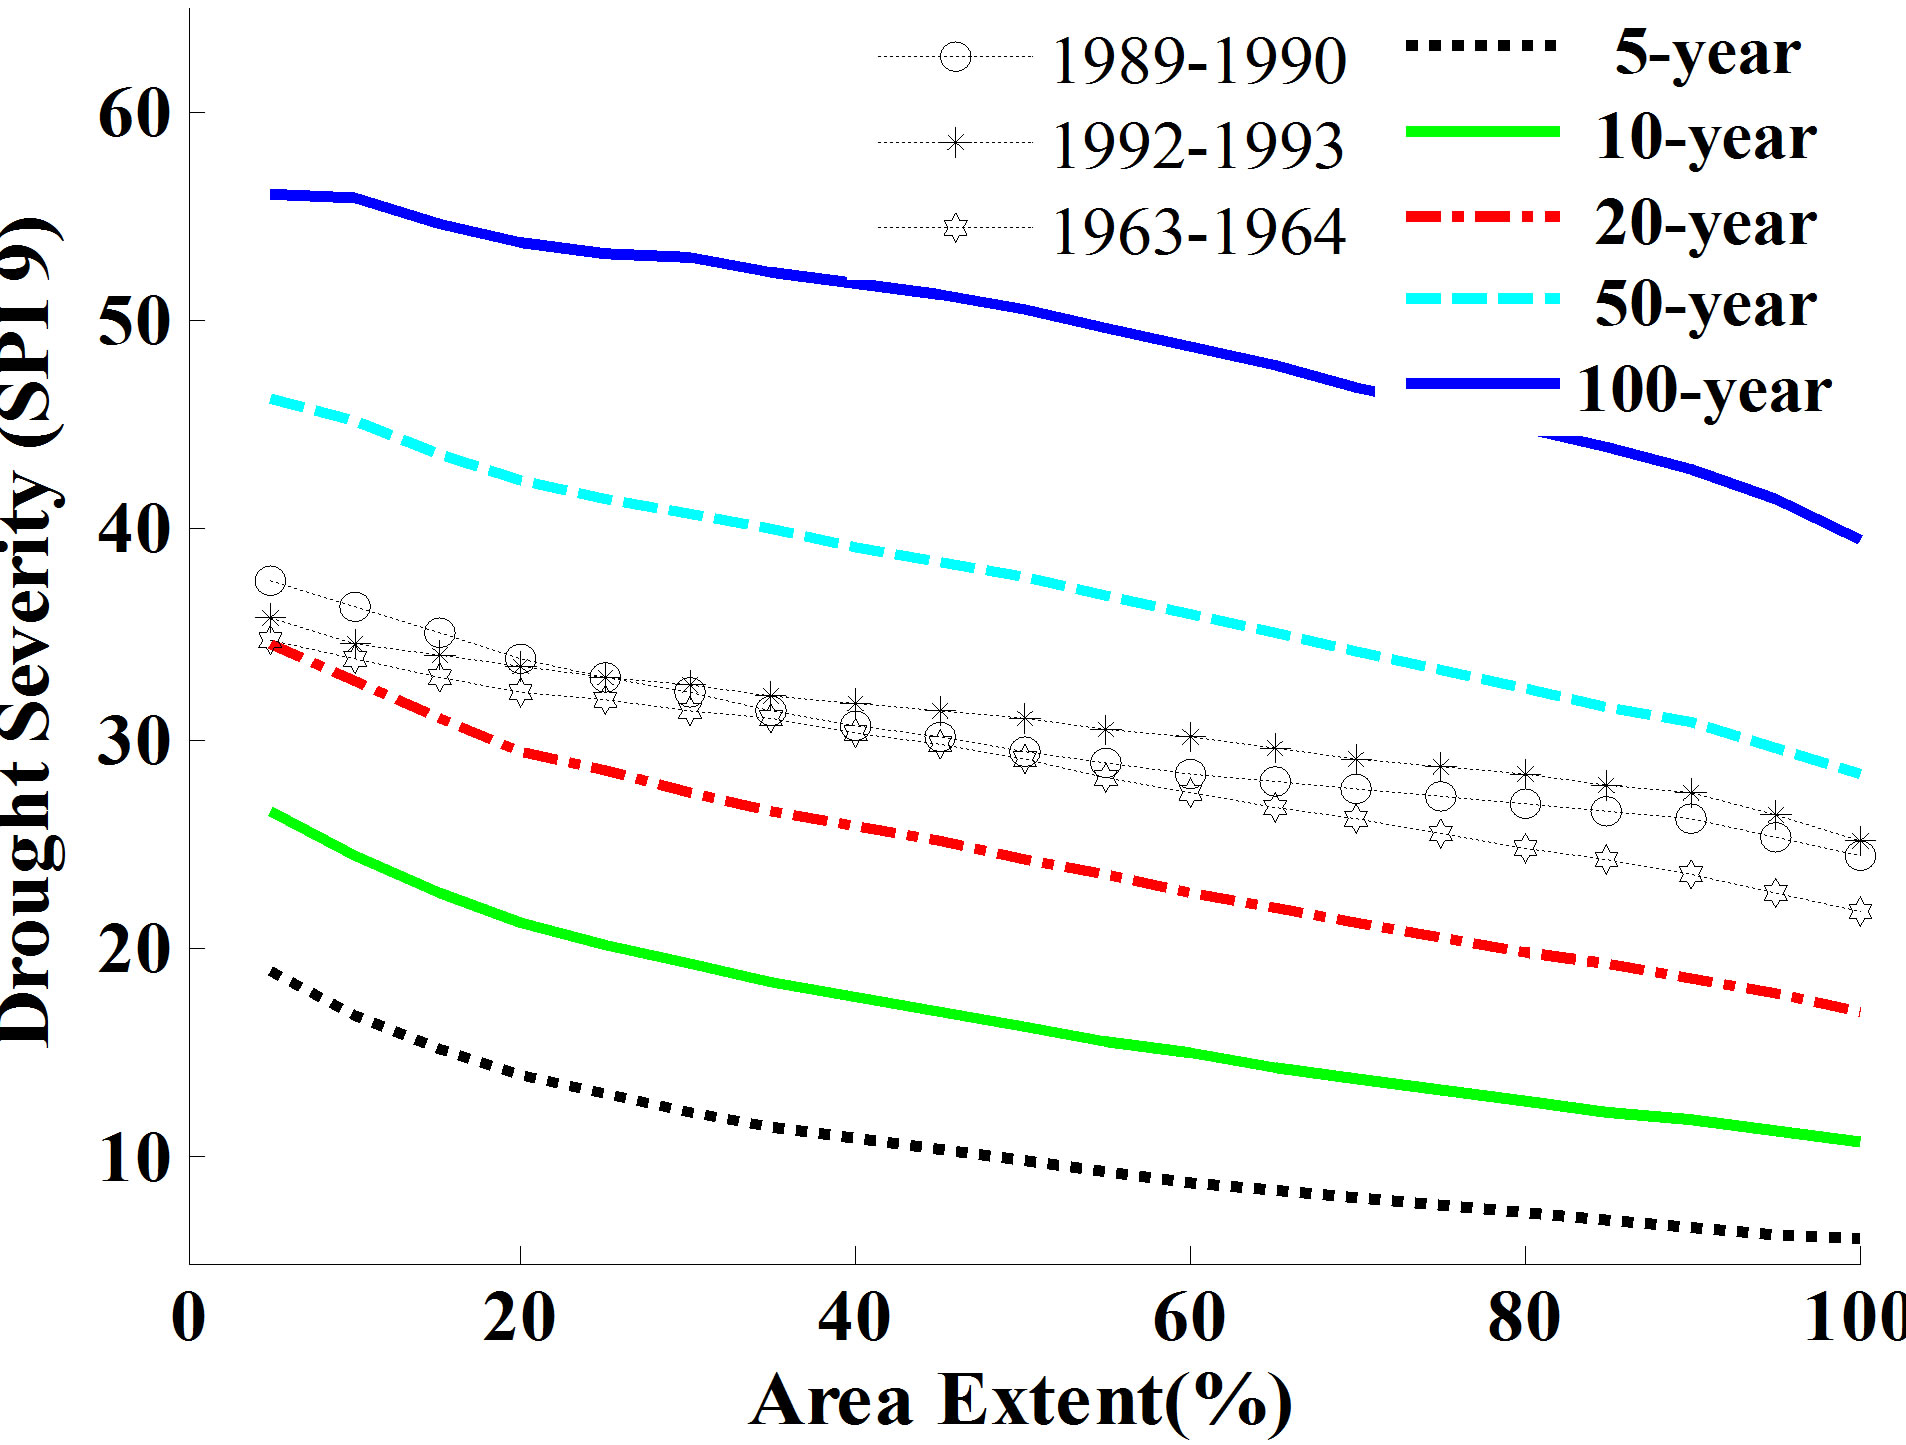
Figure 6 illustrates the Severity-Area-Frequency curves of SPI 9 for each homogeneous region where (a) is for Region I, (b) for Region II, (c) for Region III and (d) for Region IV. Figure 6 demonstrates that three hydrological annual droughts with the highest severity in Region I is during 1989-1990, 1992-1993 and 1963-1964; in Region II is during 1989-1990, 1963-1964 and 1975-1976; in Region III is during 1963-1964, 1991-1992 and 1989- 1990; and in Region IV is during 1963-1964, 1977-1978 and 1991-1992. Similarity, it can be seen from Figure 6 that, for the long-term drought, when there is a severe drought occurs in the Pearl River Basin, there usually occurs severe drought events over the entire Pearl River Basin. Meanwhile, when compared to the SeverityArea-Frequency curves for each homogeneous region, Figure 6 shows that, for the long-term drought, the drought severity in Region I is higher than that in other regions with respect to the same return periods with the same area extent. However, Region III is an exception where the drought is of lower drought severity.
It can be observed from Figures 4-6 that the time interval
 (a)
(a) (b)
(b)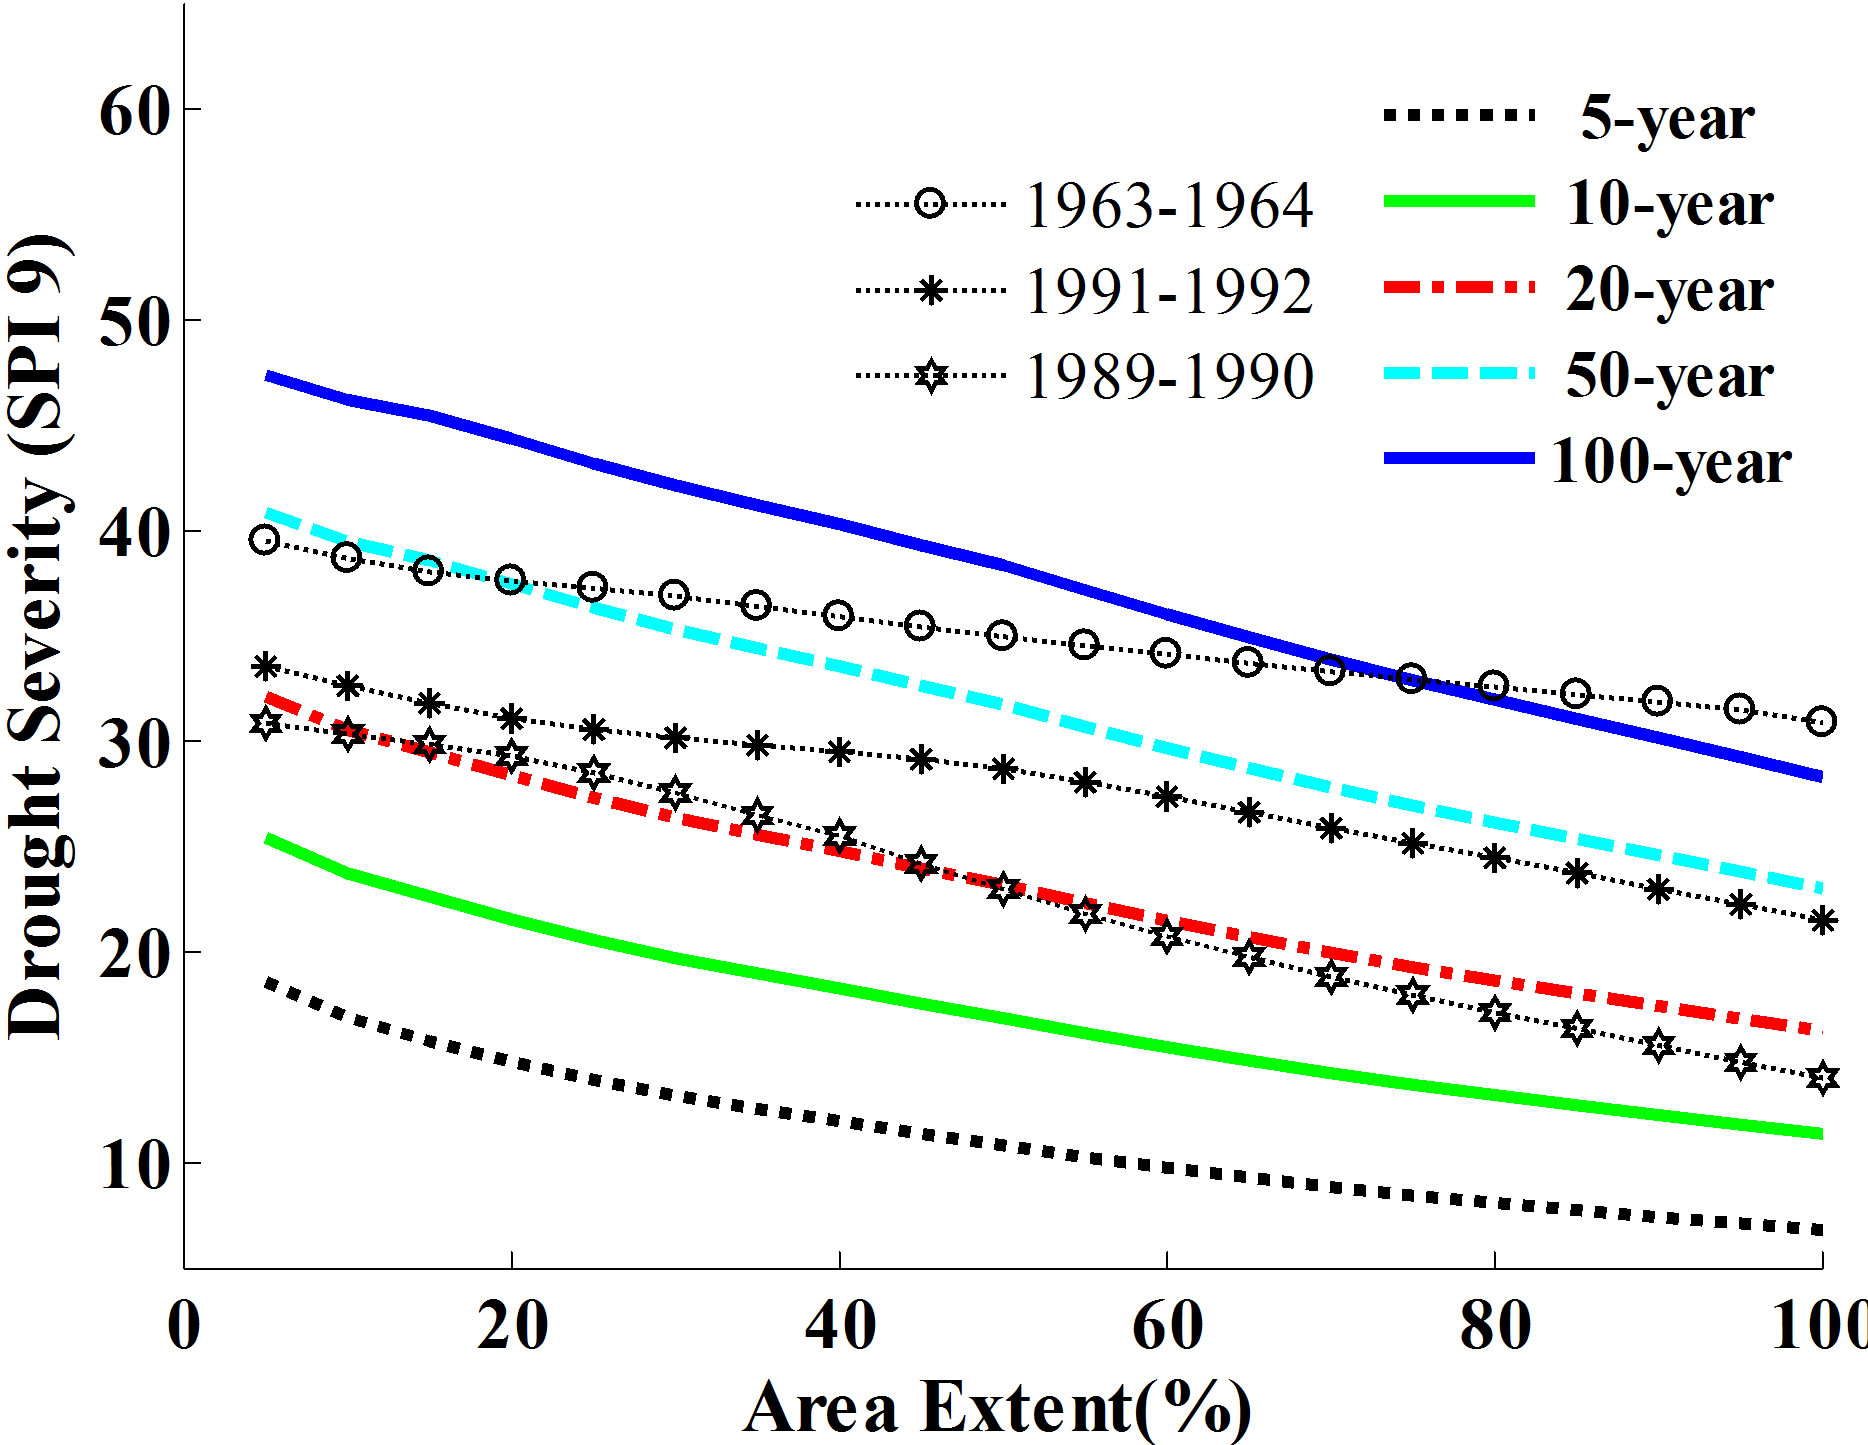 (c)
(c)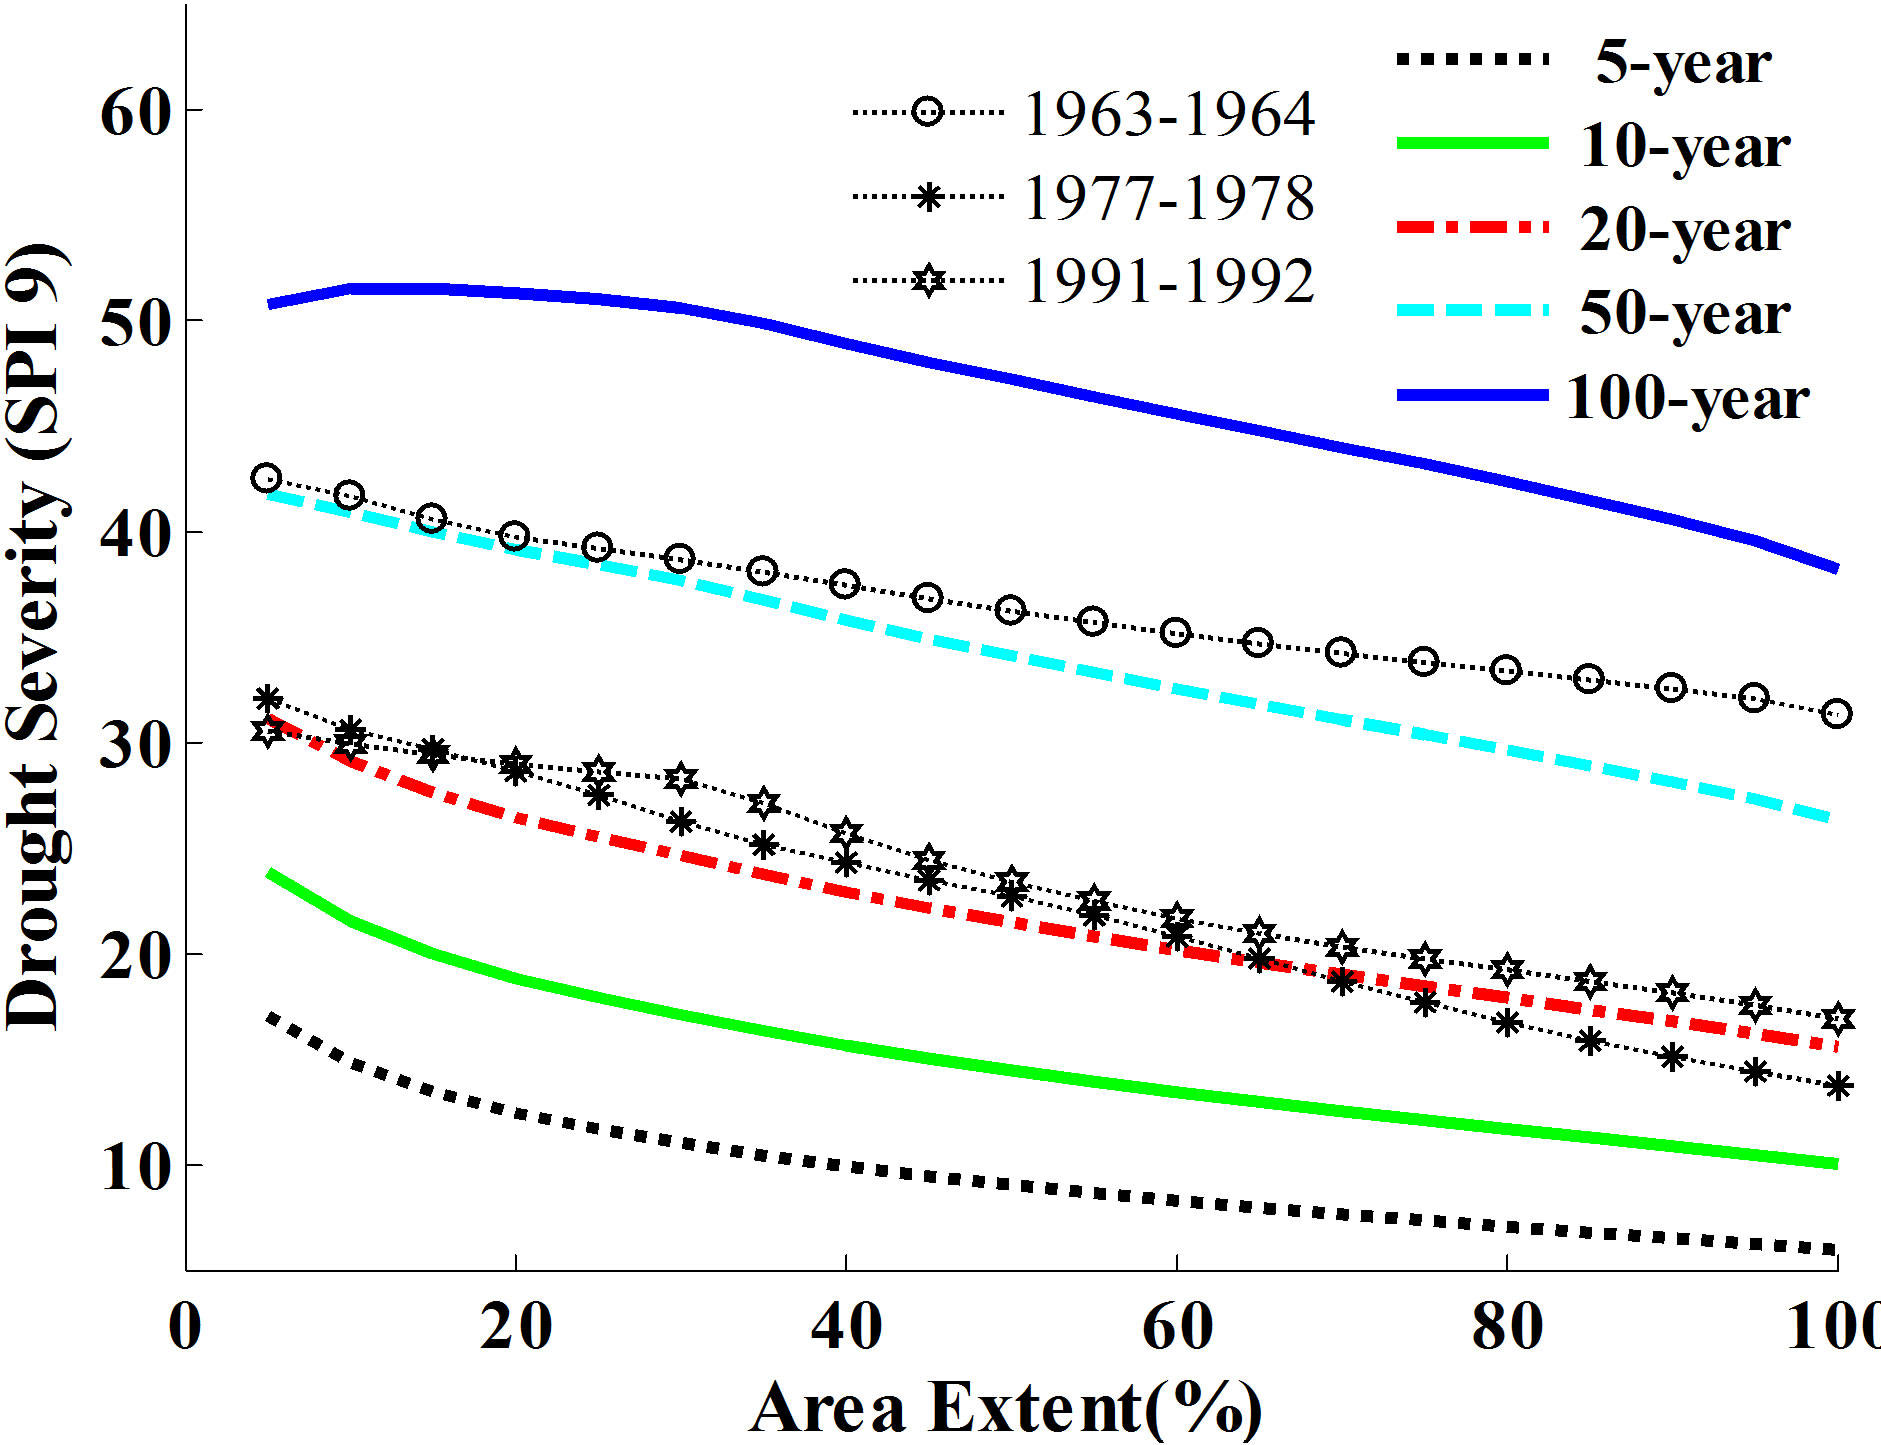 (d)
(d)
Figure 6. The Severity-Area-Frequency (SAF) curves of SPI 9 for each homogenous regions in the Pearl River Basin, (a) region I, (b) region II, (c) region III, and (d) region IV. And three most severity hydrological annual drought in that region are illustrated.
of 1963-1964 is characterized by the hydrological annual droughts with the highest drought severity respectively corresponding to the short-, mediumand long-term drought events. Thus, this time interval can be taken as the typical time for risk evaluation of droughts.. Besides, the time interval of 1989-1990 is the time when hydrological annual droughts are also of high severity corresponding to the short-, mediumand long-term droughts, and can be considered for disaster risk management of the Pearl River Basin.
5. Conclusions
In this study, the homogeneous regions were clustered based on the statistical characteristics of monthly precipitation at a annual time scale. The entire Pearl River Basin can be categorized into 4 homogeneous regions. If the consecutive six month with maximum precipitation in a year are considered as a rainy season, then the rainy season for Region I is from May to October; Region II from April to September; Region III from March to August and Region IV from April to September.
Droughts corresponding to the short-, mediumand long-term periods are of great importance for different water resource management strategies. In this case, the Severity-Area-Frequency analysis for each homogeneous region corresponding to the short-, mediumand long-term drought show that when there occurs a severe drought, the drought events may have impacts on the entire Pearl River Basin. This result poses considerable challenges for the effective and integrated water resources management focusing on the entire Pearl River Basin, but not on specific parts of the Pearl River Basin. As for short-term drought, the drought severity in Region III is higher than that in other regions while Region IV is an exception where the drought is of lower severity. As for the medium-term drought, the drought severity in Region IV is higher than that in other regions while Region III is exception when the drought severity is lower. As for longterm drought, however, the drought severity in Region I is higher than that in other regions while Region III is an exception where drought severity is lower.
The Region IV is where the Pearl River Delta is located, and the Pearl River Delta is one of the highly economically developed regions in China with Dense cities and large population, a high risk of medium-term drought will undoubtedly pose higher risk for sustainable development of the regional socio-economy and also for social stability of that region. In this sense, considerable concerns should be attached to effective and integrated water resources management with focus on the entire Pearl River Basin.
The 1963-1964 is the time interval with the highest drought severity related to the short-, mediumand long-term drought. And drought events occurred in this time interval can be taken as the typical year for drought disaster risk management of the Pearl River Basin. The analysis procedure and ideas behind this study may provide a useful reference for drought risk assessment in other river basins; and the study results will be of some scientific merits in terms of water resource management in the changing environment in the Pearl River Basin.
6. Acknowledgements
The research is financially supported by the National Natural Science Foundation of China (Grant No.: 41071020; 50839005), the Project from Guangdong Science and Technology Department (Grant No.: 2010B050800001; 2010B050300010), the Program for New Century Excellent Talents in University, a grant from the Research Grants Council of the Hong Kong Special Administrative Region, China (Project No. CUHK405308) and by the Geographical Modeling and Geocomputation Program under the Focused Investment Scheme (1902042) of the Chinese University of Hong Kong. Thanks should be owed to the National Climate Centre of China for providing the meteorological data.
REFERENCES
- J. A. Dracup, K. S. Lee and E. G. Paulson Jr., “On the Definition of Droughts,” Water resources research, Vol. 16, No. 2, 1980, pp. 297-302. doi:10.1029/WR016i002p00297
- D. A. Wilhite and M. H. Glantz, “Understanding the Drought Phenomenon: The Role of Definitions,” Water International, Vol. 10, No. 3, 1985, pp. 111-120. doi:10.1080/02508068508686328
- American Meteorological Society, “Statement on Meteorological Drought,” Bulletin of the American Meteorological Society, Vol. 85, 2004, pp. 771-773.
- H. Hisdal and L. M. Tallaksen, “Estimation of Regional Meteorological and Hydrological Drought Characteristics: A Case Study for Denmark,” Journal of Hydrology, Vol. 281, No. 3, 2003, pp. 230-247. doi:10.1016/S0022-1694(03)00233-6
- W. J. Gibbs and J. V. Maher, “Rainfall Deciles as Drought Indicators,” Bureau of Meteorology, Melbourne, 1967.
- W. C. Palmer and Bureau EUW, “Meteorological Drought,” Research Paper of Weather Bureau, US Department of Commerce, 1965.
- T. B. McKee, N. J. Doesken and J. Kleist, “The Relationship of Drought Frequency and Duration to Time Scales,” Paper Presented at 8th Conference on Applied Climatology, American Meteorological Society, Anaheim, 1993.
- T. Yang, Q. Shao and Z.-C. Hao, “Regional Frequency Analysis and Spatio-Temporal Pattern Characterization of Rainfall Extremes in the Pearl River Basin, China,” Journal of Hydrology, Vol. 380, No. 3-4, 2010, pp. 386-405. doi:10.1016/j.jhydrol.2009.11.013
- Q. Zhang, C.-Y. Xu, M. Gemmer, Y. D. Chen and C. Liu, “Changing Properties of Precipitation Concentration in the Pearl River Basin, China,” Stochastic Environmental Research and Risk Assessment, Vol. 23, No. 3, 2009, pp. 377-385. doi:10.1007/s00477-008-0225-7
- A. M. Mishra and V. P. Singh, “Analysis of Drought Severity-Area-Frequency Curves Using a General Circulation Model and Scenario Uncertainty,” Journal of Geophysical Research, Vol. 114, No. D6, 2009, p. D06120. doi:10.1029/2008JD010986
- V. M. Yevjevich, “An Objective Approach to Definitions and Investigations of Continental Hydrologic Droughts,” Colorado State University, Fort Collins, 1967.
- M. T. Ayvaz, H. Karahan and M. M. Aral, “Aquifer Parameter and Zone Structure Estimation Using Kernel-Based Fuzzy c-Means Clustering and Genetic Algorithm,” Journal of Hydrology, Vol. 343, No. 3-4, 2007, pp. 240-253. doi:10.1016/j.jhydrol.2007.06.018
- S. Sadri and D. H. Burn, “A Fuzzy C-Means Approach for Regionalization Using a Bivariate Homogeneity and Discordancy Approach,” Journal of Hydrology, Vol. 401, No. 3-4, 2011, pp. 231-239. doi:10.1016/j.jhydrol.2011.02.027