Open Journal of Fluid Dynamics
Vol.2 No.4(2012), Article ID:25719,4 pages DOI:10.4236/ojfd.2012.24015
External Cake Build Up at Surface of Porous Medim
Department of Petroleum Engineering, Firoozabad Branch, Islamic Azad University, Firoozabad, Iran
Email: hooman.fallah2@gmail.com
Received August 4, 2012; revised September 15, 2012; accepted September 23, 2012
Keywords: Porous Media; Trapping Efficiency; External Filtration; Transition Time; Filtration Coefficient
ABSTRACT
Deep bed filtration of carrier water with particles occurs in numerous processes of environmental, chemical, petroleum and civil engineering. For example in the petroleum industry, deep bed filtration of drilling fluid happens during well drilling; it also takes place near to injection wells during seawater injection or produced water re-injection causing injectivity reduction. In this work, the filtration theory and its mathematical model are given and the filtration coefficient will be discussed. Then the transition time, the time at which the initial layer of external filter cake is completely formed has been derived mathematically. The transition time can be obtained by calculating the trapping efficiency as a function of the number of previously deposited particles where very few particles can invade the rock and the external filtration begins to build. The prediction of particle capturing and particle retention by mathematical model is an essential stage during planning and design of above-mentioned industrial processes.
1. Introduction
Most oil and gas reservoirs have a natural water layer called formation water beneath the hydrocarbon layer. Also to enhanced oil recovery, seawater is usually injected into the reservoir, which may be associated with oil droplets and particles in the injected water causing injectivity reduction. Damage due to flow of dilute oil-inwater emulsions in porous media depends on several factors. The droplets concentration, the permeability of the core, the rate of the injection water and the properties of the crude oil all affect the permeability impairment.
Generally, during the particulate suspension flow and colloids through porous medium, the solid and the liquid phases in the suspension can be separated. The retention process of particles when flowing through porous medium is called Deep Bed Filtration. The deep filtration occurs because of several mechanisms: the contacting of particles with the retention site, the fixing of particles sites, and the breaking away of previously retained particles.
The problem of formation damage is split into two parts which includes external cake build up and internal filtration. In this study, deep filtration, its mathematical modelling and the effect of the different parameters are explained. Then the transition time, the time at which the initial layer of external filter cake is completely formed will be explained. Finally, the transition time calculation has been done, mathematically.
2. Filtration Mechanism
2.1. Interception
It happens when the particle following a streamline hits the surface of a grain and attaches to it. Particles with a density equal to the carrier fluid density follow the streamline in the porous medium at the low velocity. The particles will be brought into contact with grain surfaces, because of the finite size of the particles.
When the particle is retained by a previously deposited particle we refer to it as bridging and the simplest bridging process that exists is blocking or sieving of the mobile particles.
2.2. Impaction
When the density of particle is larger than that of the fluid, inertia forces will deviate the particle from the stream line and it may attach to the surface of a grain. The impaction is more significant for air filtration and not for water filtration.
2.3. Diffusion
Small particles do random Brownian motion that increases the number of collisions between particles and grains. Diffusion is usually neglected for larger particles.
2.4. Size Exclusion
When a particle enters a throat that is too small for it to pass, it gets stuck there. So the large particles are captured in small pores and pass through large pores. Several attempts to correlate the formation damage with size of particles and pores were unsuccessful. The phenomenological model for average concentration is not general/ universal enough.
2.5. Surface Forces
Double layer repulsion forces and Van Der Walls are important to capture the particles. These forces will play role in the particle in contact with the grain surface. The dominance of the force is depending on filtration medium properties, particle properties and flow [1].
3. Filtration Theory
The filtration theory is comprised of a system of two equations: the mass conservation equation and a kinetic equation.
3.1. Mass Conservation
The volumetric balance conducted on either the liquid phase or the solid particles yields the following one dimensional convection-dispersion reaction equation [2].
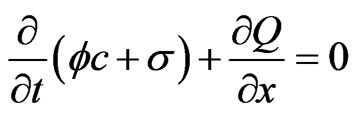 (1)
(1)
where t is time; x is the spatial coordinate in the direction of flow;  is the effective porosity; c is the volumetric concentration of suspended particles with respect to the pore volume;
  is the volumetric concentration of retained particles with respect to the bulk volume.
 (2)
(2)
Here  is the permeate superficial velocity.
3.2. Kinetic Equation
The kinetic equation describes the dynamic interaction between the suspended particles, the deposited particles and the porous medium. Iwasaki (1937) introduced the filtration coefficient, λ, in his formulation of the kinetic equation [3].
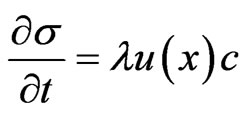 (3)
(3)
It is generally accepted het for deep bed filtration phenomena covering the water injection field the filtration function is dependent on previous retention  only. Thus,
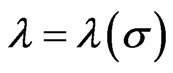 (4)
(4)
So, the filtration theory in the field of petroleum engineering, is defined as following equations:
 (1)
(1)
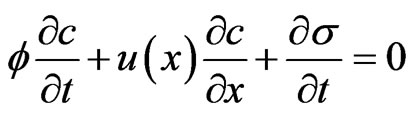 (2)
(2)
 (4)
(4)
The net increase of particles within an infinitesimal filter volume equals the particles entering the volume on the upstream side minus the particles leaving the volume on the downstream side minus the particles leaving the volume on the downstream side minus the loss of particles to the formation through deposition.
4. Filtration Coefficiant
The filtration coefficient changes as particle deposition proceeds. This can be written in as
 (5)
(5)
The filtration coefficient is a dynamic property that changes with the specific deposit, . The value of λ increases during the initial stages of filtration, this process called filter ripening. Iwasaki described the ripening period with an equation
 (6)
(6)
The deposited particles can themselves act as collectors for subsequent retention of flowing particles. If, however, the surface forces between the deposited and suspended particles are strongly repulsive, λ is likely to decrease with time as the collectors are progressively coated with deposited particles. If particles continue to deposit, they will finally begin bridging the pore throats and if the conditions allow a majority of the pore throats to be bridged, the external filter cakes starts forming.
5. Transition Time  Concept
In developing filtration models, both internal and external filter cakes need to be accounted for because both are generally present in the filtration process. We postulate that during some initial period, an internal filter cake is formed. As more particles are trapped on the surface of the rock, a point is reached where very few particles can invade the rock and an external filter cake begins to build (Figure 1).
We refer to the time at which no more particles invade the rock, i.e. the time at which the initial layer of external

Figure 1. Formation damage due to particle filtration.
filter cake is completely formed, as the transition time . The transition time can be obtained by calculating the trapping efficiency as a function of the number of previously deposited particles. The trapping efficiency is defined as the fraction of suspended particles trapped in the porous media [4].
If we can determine the conditions under which particles will form the internal and external filter cakes and the time required to form the initial layer of external filter cake , then the entire filtration process can be approximated by applying an internal cake-filtration model before the transition time and an external cakefiltration model after the transition time. Pure external filtration can be obtained in the limit
  and pure internal filtration can be obtained in the limit
 .
.
Some authors declared that the effect of penetrated particles on formation permeability may be dominant only at the early stages of injection [5]. Once the cake is established and reaches a characteristic thickness, these effects are generally negligible compared to those of filter cake properties.
A Brief Review of Injectivity Decline Models
If the impairment is due to only to a filter cake buildup, the total pressure drop,  (constant), can be equated to the sum of pressure drop across the filter cake,
  , and across the formation boundary,
 . With continuous injection, depending on the filter cake permeability and thickness, only the pressure drop across the filter cake increases. This reduces the formation (matrix) pressure drop, resulting in significant losses in injectivity [6].
Barkman and Davidson developed an equation which expressed the half-life of an injector as a function of formation characteristics, injection rate, Particles concentration and filter cake properties [7].
More assumption has been used in modeling the external filter cake and concluded since the thickness of the filter cake is small for waterflooding, due to lower solids concentration, the filter cake resistance can be assumed linear rather than radial.
The limitation of Barkman and Davidson’s and Eylander’s methods results from the assumptions that the matrix of the filter cake is Incompressible and the cake thickness varies linearly with time. However, must particles encountered downhole could be highly compressible (scale products and corrosion).
Khatib tried to find the relationship between permeability and porosity in order to calculate the pressure drop across the filter cake and thus determine the injectivity decline curve [5]. He the used improved model and concluded that the cake porosity is not constant and varies with applied pressure, particularly for compressible particles such as iron hydroxide and the filter cake characteristics of the solids can be defined by developing empirical permeability/porosity correlations.
6. Simplified Approach for Water Re-Enjection Projects
To summarize, three possible scenarios exist for the time evolution of the filtration coefficient [8]:
1) λ increases monotonically. At some point in the time, the initial layers of grains no longer permit particles to pass. The filtration coefficient at this position diverges to infinity while the collection efficiency, η, goes to one, and external cake starts forming which we refer this time as the transition time.
2) after an initial ripening period, λ starts to decrease and approach zero and no external cake starts builing.
3) λ is constant or decrease slowly, the pore throats start to bridge, leading to external cake formation. The transition time can, however be orders of magnitude larger than for case 1.
The Transition Time
Here, we operate in terms of the filtration coefficient, rather than the collection efficiency and postulate that the time development of any filtration theory can be approximately described by the simplest stated equation:
 (6)
(6)
To derive the transition time,  , from Equation (6) we solve the differential equation
 (7)
(7)
And find the solution for constant flow rate is
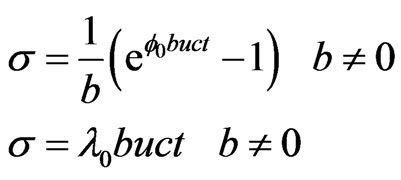 (8)
(8)
Then, we state the only a certain percentage of the porous medium can be filled by particles. When the critical porosity,  , is achieved, no particles can go through. We denote this critical porosity and note that the transition time corresponds to
  and insert it to Equation (8) will give us the transition time.
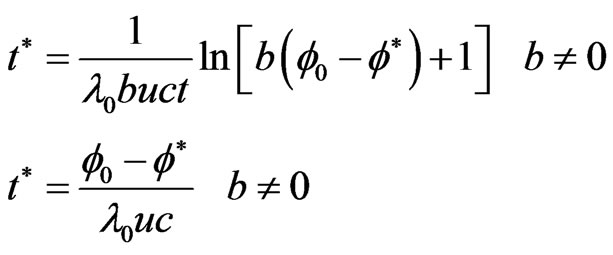 (9)
(9)
Little experimental data are available on the transition time and the corresponding specific deposit just below the surface. The critical porosity  therefore needs to be estimated from theoretical arguments.
If the initial pore space of a formation is completely filled with particles, the remaining porosity will be the product of formation porosity and the filter cake porosity. A reasonable guess could be that about 50% of the pore space is being filled before the cake starts forming  .
.
7. Conclusions
Both internal and external filter cakes are considered in the new model by introducing the term, transition time  that has been derived mathematically.
The external filtration build up in front of the surface of the porous medium can be described by a filtration coefficient  that may vary with time. The initial filtration coefficient can be determined from correlations derived for conditions under which attractive forces act between formation grains and injection particles.
Where the repulsive forces exist, the filtration coefficient must be determined from experiments. The cake porosity is not constant and varies with applied pressure, particularly for compressible particles.
REFERENCES
- R. Farajzadeh, (PWRI), “An Experimental Investigation into Internal Filtration and External Cake Build Up,” MSc. Thesis, Delft University of Technology, Delft, 2004.
- J. P. Herzig, D. M. Leclerc and P. Le Goff, “Flow of Suspension through Porous Media—Application to Deep Filtration,” Journal of Industrial and Engineering Chemistry, Vol. 65, No. 5, 1970, pp. 8-35. doi:10.1021/ie50725a003
- T. Iwasaki, “Some Notes on Sand Filtration.” Journal of the American Water Works Association, Vol. 29, 1937, pp. 1591-1602.
- P. Bedrikovetsky and F. D. Siqeira, “Modified Particle Detachment Model for Colloidal Transport in Porous Media,” Transport in Porous Media, Vol. 86, No. 2, 2011, pp.383-413.
- Z. I. Khatib, “Prediction of Formation Damage Due to Suspended Solids: Modeling Approach of Filter Cake Build up in Injectors,” Paper SPE 28488, 1994.
- S. Pang and M. M. Sharma, “Supplement to SPE 28489, A Model for Predicting Injectivity Decline in Water Injection Wells,” SPE Formation Evaluation, Vol. 12, No. 3, 1997, pp. 194-201.
- J. H. Barkman and D. H. Davidson, “Measuring Water Quality and Prediction Well Impairment,” Journal of Petroleum Technology, 1972, pp. 865-868.
- F. Al-Abduwani, W. M. G. van den Broek and P. K. Currie, “Laboratory and Mathematical Study of Produced Water Re-Injection in Oil Reservoirs,” European Water Management Symposium, Aberdeen, 21-22 May 2004.
Nomenclator
 : Time
 : Spatial coordinate in the direction of flow
 : Effective porosity
 : Volumetric concentration of suspended particles with respect to the pore volume
 : Volumetric concentration of retained particles with respect to the bulk volume
 : Permeate superficial velocity
 : Filtration coefficient
 : Transition Time
 : Critical porosity