Open Journal of Fluid Dynamics
Vol.2 No.4A(2012), Article ID:25796,4 pages DOI:10.4236/ojfd.2012.24A023
Shape Optimization of a Regenerative Blower Used for Building Fuel Cell System
Environmental Engineering Research Division, Korea Institute of Construction Technology, Goyang-Si, Korea
Email: jangcm@kict.re.kr
Received September 9, 2012; revised October 14, 2012; accepted October 27, 2012
Keywords: Regenerative Blower; Optimization; Response Surface Method; Efficiency; Pressure
ABSTRACT
This paper describes the optimal design of a Cathode blower used for a building fuel cell system. The Cathode air blower has a regenerative blower type. Two design variables, extension angle and number of impeller blade are introduced to enhance the blower performance. Pressure and efficiency of the blower are selected as an object function, and the optimal design is performed by a response surface method. Three-dimensional Navier-Stokes equations are introduced to analyze the performance and internal flow of the blower and to find the value of object function for the training data. Throughout the design optimization, it is found that an extension angle is effective to increase blower efficiency in the blower. The pressure rise for the optimal blower is successfully increased up to 3.17% compared with that of reference one at the design flow rate. It is noted that low velocity region disturbs to make strong recirculation flow in the each blade passage, thus increases local pressure loss. Detailed flow field inside a regenerative blower is also analyzed and compared.
1. Introduction
Shape optimization of a regenerative blower used in a building fuel cell system has been performed to enhance the performance of a blower in the present study. A regenerative blower is widely used in the industrial fields: flow circulator of waste water in a sewage disposal tank, BOP of a fuel cell system, core part of medical equipment, and so on. The blower needs high pressure and constant flow rates. According to the shapes of blower’s impellers, the blower has two types of impellers: the open and side channel type. Open channel type impeller is widely selected in the industrial fields due to relatively lower manufacturing costs. Design of a high efficient blower is very important to get higher exit pressure.
Optimal shape design of a regenerative blower is recently introduced to enhance the performance of a regenerative blower [1-3]. Characteristic of design parameters was reported by some researchers [1,3]. They showed that optimal shape design on an impeller and a casing could increase the performance of the blowers.
Recently optimal design method using response surface method (RSM) [4] combined with three-dimensional Navier-Stokes solver is widely used to find optimum shapes of a blower. The RSM is global optimization and can find easily optimal position using the results. The method also can utilize information collected from various sources, thus effective for both of singleand multidisciplinary optimization problems [5].
In the previous study, Jang and Han [2] tried to optimize the shape of impeller for two stage ring blower by RSM combined with numerical simulation.
In the present study, the response surface method (RSM) is introduced to find optimal shape of a regenerative blower used in a building fuel cell system. Two design variables determining extension angle and blade number are used. Pressure and efficiency of the blower are selected as an objective function. Detailed internal flow analysis is also performed and compared with the reference blower.
2. Regenerative Blower
A regenerative blower used for a building fuel cell system is introduced in the present study. The detailed specifications of the blower are summarized in Table 1.
A flow coefficient (F) and a pressure coefficient (Y) are defined as
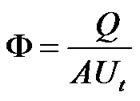 (1)
(1)
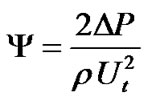 (2)
(2)
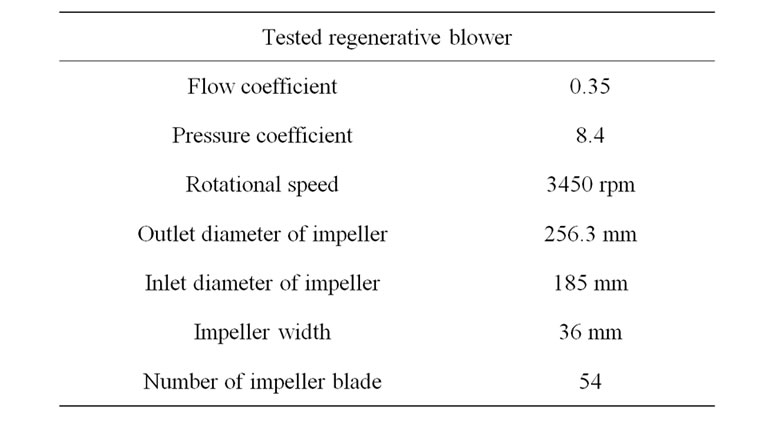
Table 1. Design specifications.
where Q is the volume flow rate, ∆P is the pressure rise, Ut is the impeller tip speed, ρ is the density, and A is the outlet duct area of a blower. The inlet and outlet duct diameter of the impeller used in the present study is 51 mm. The perspective view of the test blower is shown in Figure 1.
The blower mainly consists of a casing (housing) and an impeller. As shown in the figure, impeller blade has an open channel type, and the number of an impeller blade is 54.
3. Experimental Apparatus
Figure 2 shows the schematic view of the experimental set-up, which is an open-loop facility. The facility consisted of a flow control valve, a fan driving motor, nozzle and auxiliary fan. The experimental apparatus was designed according to AMCA 210 [6].
Figure 3 shows the performance curve of the test fan. Pressure linearly decreases as flow rate increases. At the design flow condition, pressure coefficient is 8.43.
4. Shape Optimization
Response surface method (RSM) combined with threedimensional numerical simulation is introduced to enhance the performance of a regenerative blower. Detailed explanation of the RSM was described in the previous paper [2]. A response model f is assumed as a secondorder polynomial, which can be written as follows:
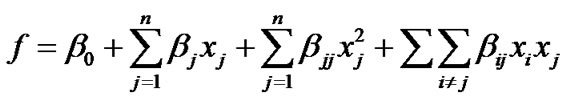 (3)
(3)
where n is the number of design variables, and x and β indicate the design variables and the coefficients, respectively. The number of coefficients (β0, β1, etc.) is  .
.
In the present study, pressure and efficiency are selected as an objective function for the shape optimization in the blower.
To enhance the performance of the blower, the shape
 (a)
(a) 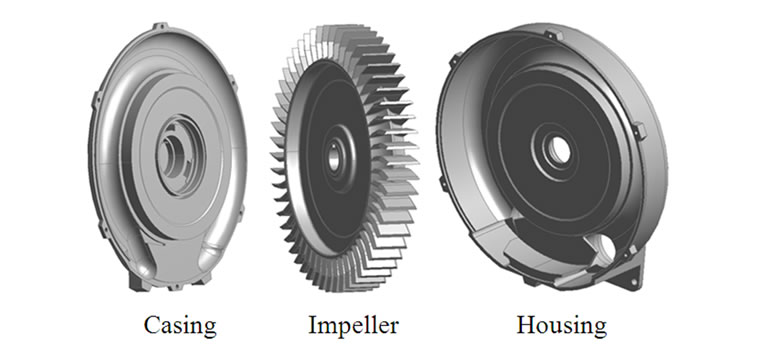 (b)
(b)
Figure 1. Configuration of a test blower: (a) Perspective view; (b) Main parts.
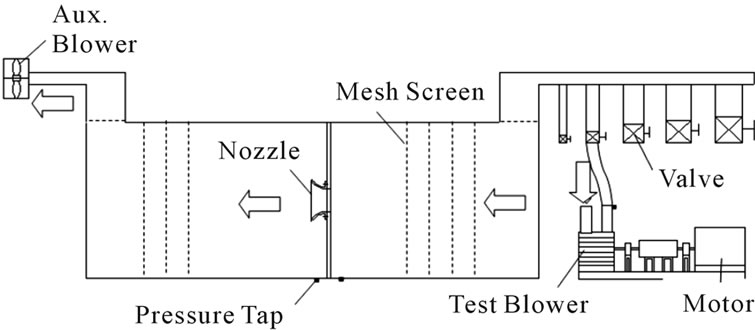
Figure 2. Experimental set-up [2].
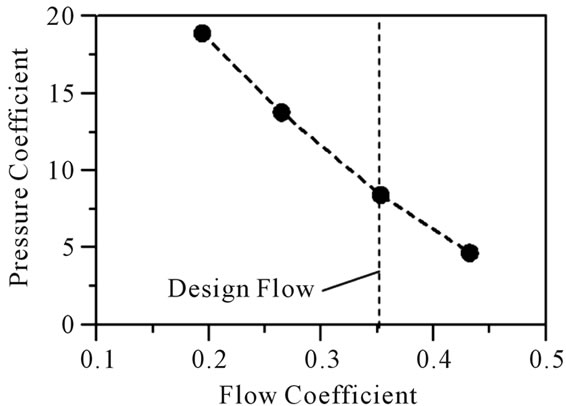
Figure 3. Performance curve of a test blower.
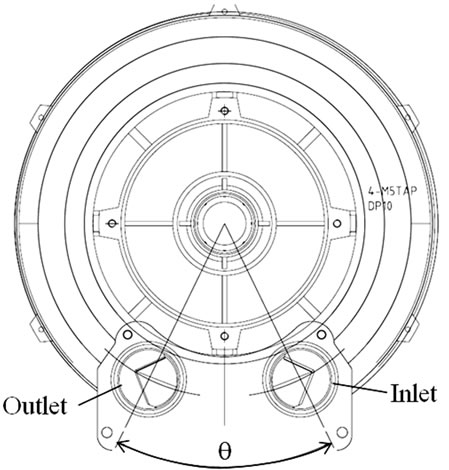
of the blower is optimized by introducing two design variables: extension angle (θ) and number of impeller blade (NOB) as shown in Figure 4.
The range of each variable for selection of the points for response evaluation is determined by preliminary calculations, and is summarized in Table 2" target="_self"> Table 2. In the design space, the middle design values of each design variable are those of reference blower. Even interval is taken for
 (a)
(a)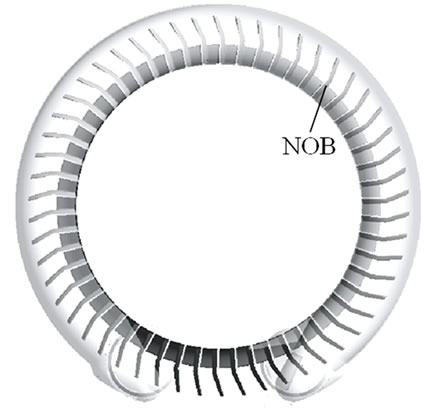 (b)
(b)
Figure 4. Definition of design variables: (a) Extension angle (θ); (b) Number of impeller blade (NOB).
Table 2. Design space.
analyzing the effect of design variables on the object function.
5. Numerical Simulation
To determine the object function and analyze the flow characteristics inside the blower, general analysis code, CFX-13 [7], is employed in the present study. It solves compressible Reynolds-averaged Navier-Stokes equations (RANS) and continuity equation.
SST turbulence model with scalable wall function is employed to estimate the eddy viscosity [8]. In computational grids, unstructured grids are used to represent a composite grid system including the impeller and casing domains.
Figure 5 shows the computational grid system. Tetrahedral element is mainly imposed in the casing and impeller where wedge (prism) element having three layers is introduced near the wall. Hexahedral element is also imposed in the inlet and outlet duct to reduce the grid
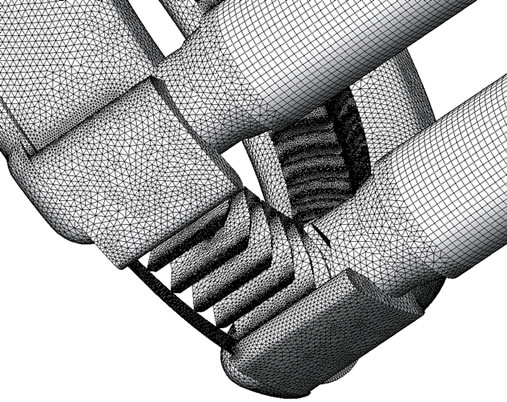
Figure 5. Computational grid.
nodes. The whole grid system in the present simulation has about 2,600,000 nodes. As boundary conditions, atmospheric pressure is specified at the inlet, and mass flow rate is specified at the exit. No-slip and adiabatic wall conditions are used on impeller blade and casing surfaces. Boundary plane between the impeller and casing regions is imposed frozen rotor interference.
Figure 6 shows a computational domain used in the present calculation, which has inlet and outlet ducts and a test blower. The length of inlet and outlet ducts corresponds to 10 times the inner duct diameter.
6. Results and Discussion
6.1. Validation of Numerical Simulation
For the validation of the numerical solutions, the distributions of pressure for the reference blower are compared to the experimental results according to flow rates.
Figure 7 shows that the distributions of local pressure and efficiency, which is obtained by numerical simulation. At the design flow condition, pressure simulated by numerically is 6.92. From the comparisons of pressure of Figures 3 and 7, the tendency of pressure according to the flow rates has almost same. It is noted that maximum efficiency is located at the design flow condition. The shape optimization of the blower is performed at the design flow condition using the numerical results.
6.2. Shape Optimization of the Blower
To evaluate the shape effects of the blower on the objective function, efficiency and pressure, the optimization has been performed. To measure uncertainty in the set of coefficients in a polynomial, ANOVA and regression analysis provided by t-statistic are used and the results are shown in Table 3. Guinta [9] suggested that the typical values of adjusted R2 are in the range, 0.9 ≤ adjusted R2 ≤ 1.0, when the observed response values are well predicted by the response surface model. Therefore, the present response surfaces obtained are reliable.
Figure 8 shows the contour plot of predicted response surfaces for the object functions of efficiency and pressure
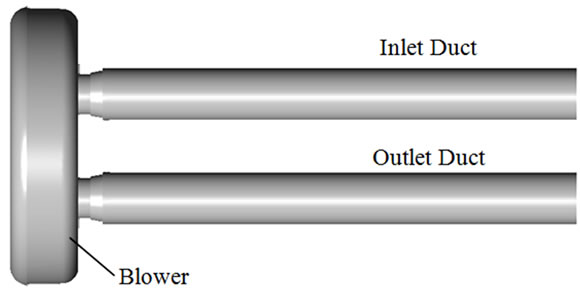
Figure 6. Computational domain.
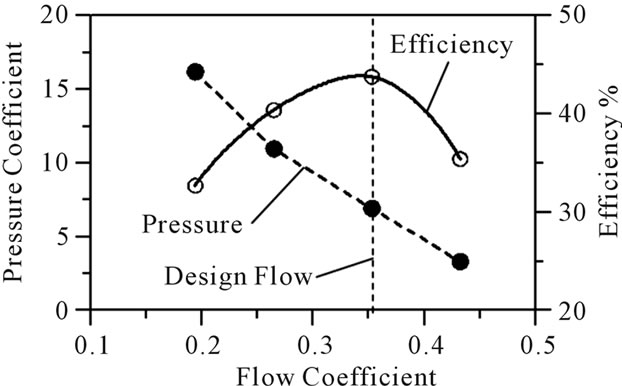
Figure 7. Performance curve obtained by numerical simulation.
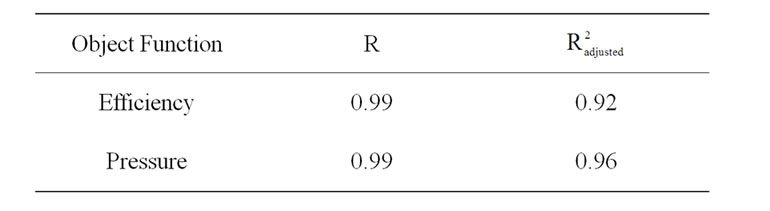
Table 3. Results of ANOVA and regression analysis.
for the design variables. As shown in Figure 8(a), the optimal values for the efficiency are located inside the boundary of the design space. For the pressure in Figure 8(b), optimal value of the NOB is on the outside of the design space. From the response surfaces for efficiency and pressure, optimal positions for each design variable can be found easily. Results of the shape optimization of the regenerative blower for the two design variables at the design flow rate are shown in Tables 4 and 5.
The estimated pressure rise for the optimal blower is successfully increased from 8.89 kPa to 9.18 kPa compared to that of reference one.
Figure 9 shows the results of sensitivity analysis for efficiency. As shown in the figure, the extension angle (θ) is sensitive on the object function compared to that of the number of impeller blade (NOB). This means that the shape optimization using extension angle is more effective to increase efficiency in the blower.
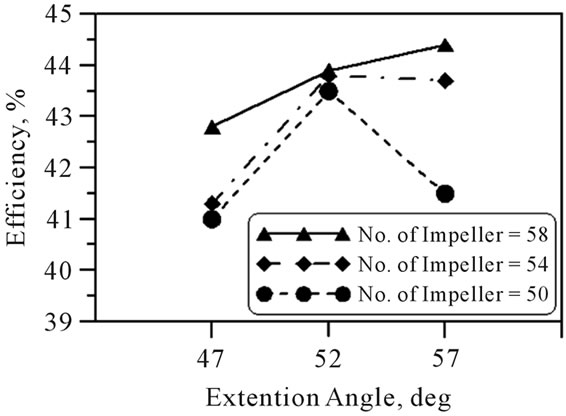
Figure 10 shows blower performance according to extension angles for three different blade numbers. Pressure and efficiency are tendency to increase as the number of impeller blade increases. Pressure has a maximum value at the extension of 52 degree for all number of impeller blades. However, efficiency has the highest value
 (a)
(a) (b)
(b)
Figure 8. Response surface: (a) Efficiency; (b) Pressure.
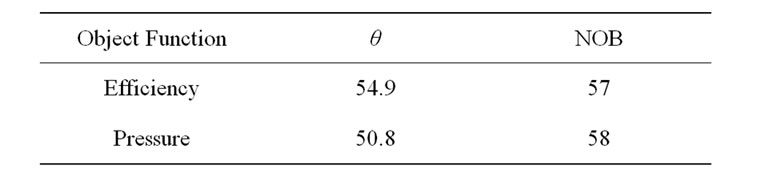
Table 4. Predicted optimum value.
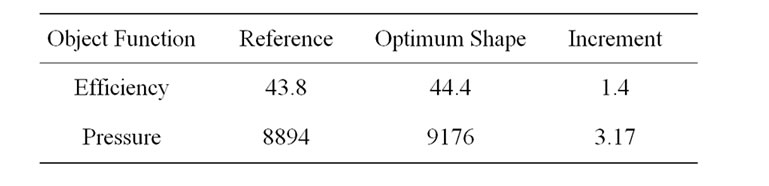
Table 5. Results of optimization.
at the extension of 57 degree for the blade number of 58. It is noted that the positions having maximum pressure and efficiency for the regenerative blower depend on the conditions of design variables.
6.3. Internal Flow Analysis of the Regenerative Blower
To analyze the performance of the regenerative blower
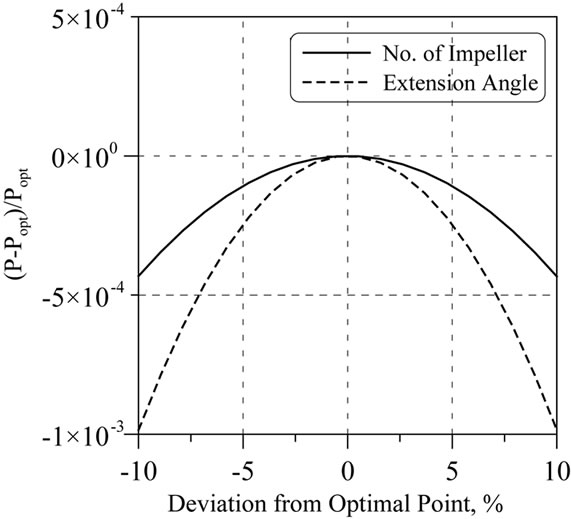
Figure 9. Sensitivity analysis for efficiency.
 (a)
(a)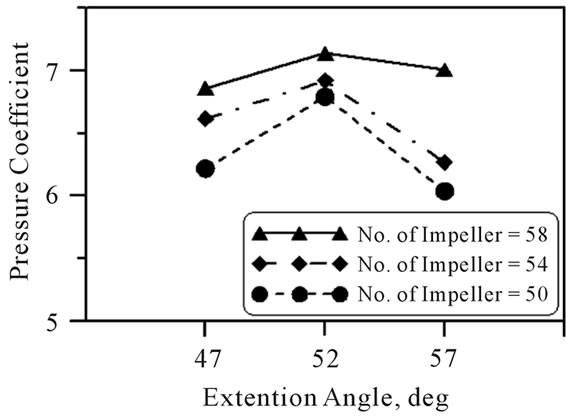 (b)
(b)
Figure 10. Blower performances on the design variables: (a) Efficiency; (b) Pressure.
with the different design conditions, internal flow is compared using the results of numerical simulation.
Figure 11 shows the tangential velocity vectors on the three orthogonal planes to the rotational direction for the reference blower. The positions of each plane represent in Figure 11(a). Non-symmetric recirculation flow is formed in the blade passage at the inlet region (Plane 1).
From the distributions of the tangential velocity vectors, the low velocity region is formed at the center of recirculation flow. Strong radial flow is observed at the middle of blade passage due to centrifugal force, which results in the pressure increase at each pressure passage.
 (a)
(a)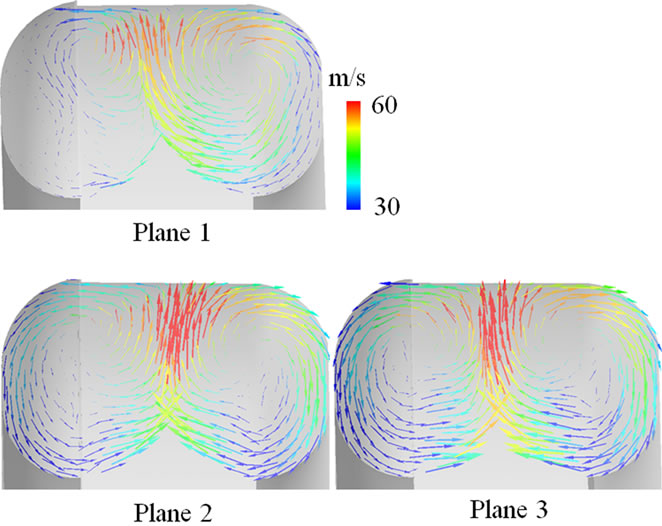 (b)
(b)
Figure 11. Tangential velocity vectors on orthogonal planes to rotational direction for the reference blower: (a) Positions of planes; (b) Tangential velocity vectors.
Relatively symmetric recirculation flow at the blade passage is formed at the middle and outlet blower passage (Planes 2 and 3).
Figure 12 shows the distributions of streamlines for the reference blower, which is side and front view from the casing. The streamlines are colored by velocity. From the figure, the flow comes through the inlet duct is separated to the both sides of the impeller. In the passage of a blower impeller, flow is accelerated to the radial direction with the rotation of the impeller.
Figure 13 shows the velocity distributions at the blower outlet according to extension angles. As described above, the reference blower has 54 blades and extension angle of 52 degree. Pressure has a maximum value when the extension angle of the blower is 52 degree. From the figure, it is noted that relatively large velocity distortion is observed at the extension angle of 47 and 57 degrees compared to that of 52 degree. Due to the non-uniform flow at the blower passage, pressure increase can be deteriorated by velocity defects. The velocity defects makes larger low velocity region. Low velocity region disturbs to make strong recirculation flow in the each blade passage, thus increases local pressure loss.
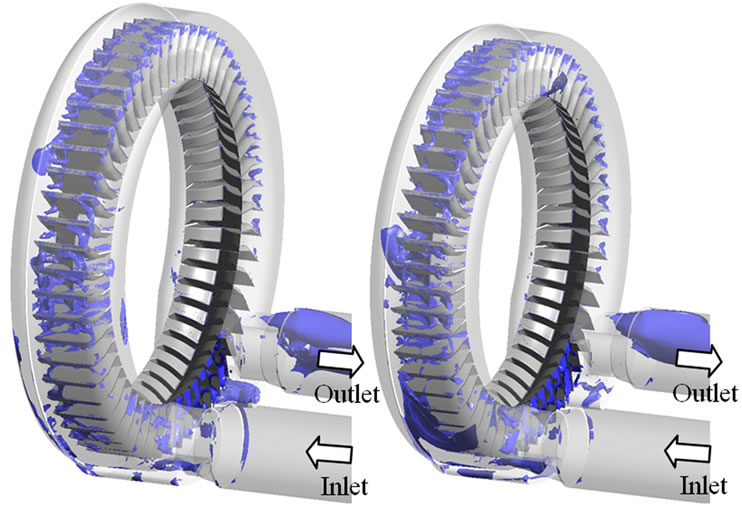
Figure 14 shows the distributions of isosurface having the low velocity of 5 m/s for the blade numbers of 54. In the figure, the low velocity region is formed in the both sides of the impeller.
The low velocity region is induced by horizontal inlet
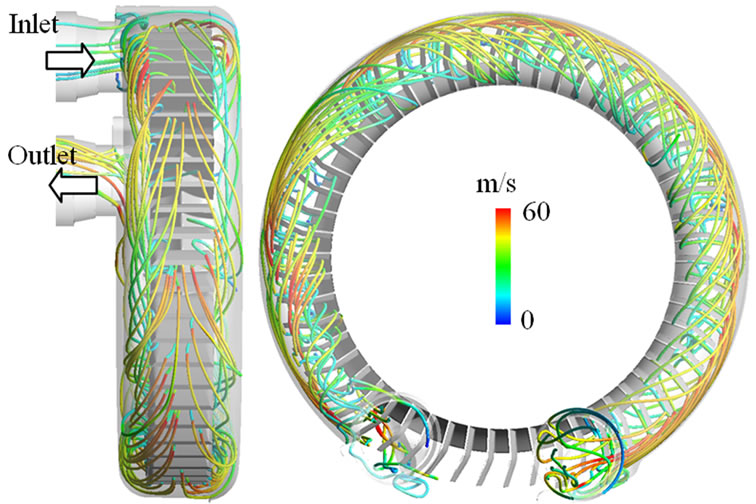
Figure 12. Streamlines for the reference blower.
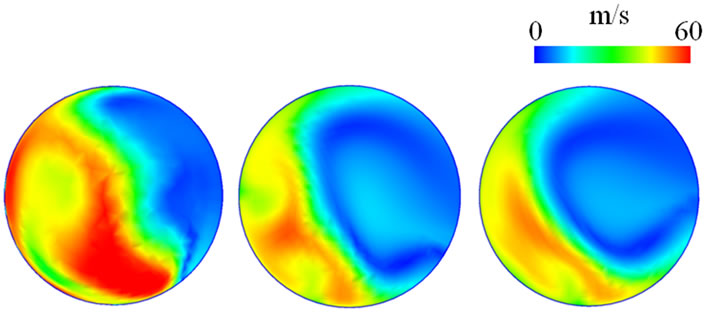 (a) (b) (c)
Figure 13. Velocity at the blower outlet for the blade numbers of 54: (a) θ = 47 deg; (b) θ = 52 deg; (c) θ = 57 deg.
 (a) (b)
Figure 14. Isosurface having low velocity of 5 m/s for the blade numbers of 54: (a) θ = 52 deg; (b) θ = 57 deg.
flow and outlet flow having a radial component as shown in Figure 12. From the figure, relatively larger low velocity region is observed at the extension angle of 57 degree where pressure increase is lower compared to that of 52 degree in Figure 10(b).
Figure 15 shows the distributions of pressure for the blade numbers of 54. The reference blower (Figure 15(a)) has higher outlet pressure compared to larger extension angle of 57 degree.
Figure 16 shows the pressure distributions for the
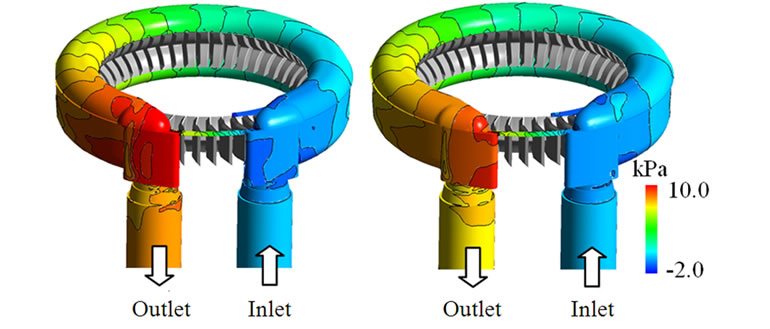 (a) (b)
Figure 15. Pressure distributions on the casing for the blade numbers of 54: (a) θ = 52 deg; (b) θ = 57 deg.
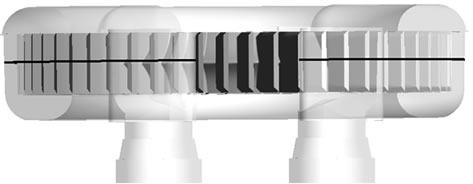 (a)
(a)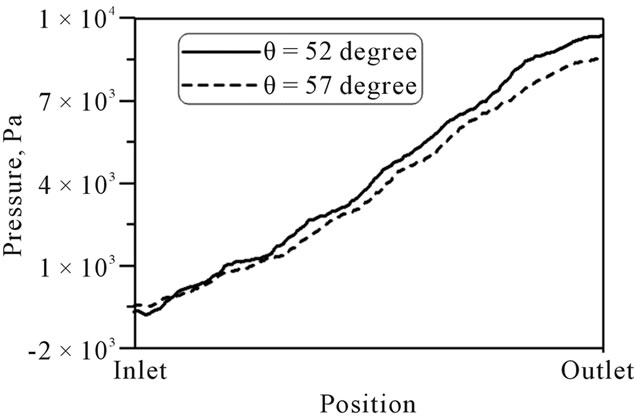 (b)
(b)
Figure 16. Pressure distributions along the casing wall for the blade numbers of 54: (a) Position of line; (b) Pressure.
blade numbers of 54. The measuring position is along the casing wall from inlet to outlet as shown in Figure 16(a). Gradually linear increase of pressure is observed for both cases along the measuring positions. It is noted that the pressure increase is caused by momentum force generated inside blade passage.
7. Conclusions
The optimal design of a Cathode blower used for building fuel cell system has been performed by the response surface method and the three-dimensional Navier-Stokes analysis. Two design variables, extension angle and number of impeller blade, are introduced to enhance the pressure and efficiency at the design flow condition.
Throughout the optimization of the blower shape, the pressure rise for the optimal blower is successfully increased up to 3.17% compared with that of reference at the design flow rate. And efficiency is also increased up to 1.4% compared to reference one. From the sensitivity analysis, an extension angle is more effective to increase efficiency in the blower.
From the internal flow analysis, the low velocity region is formed at the center of recirculation flow in the each blade passage. Low velocity region disturbs to make strong recirculation flow in the each blade passage, thus increases local pressure loss. It is noted that the pressure increase is caused by momentum force generated inside blade passage.
8. Acknowledgements
This work was supported by the New & Renewable Energy of the Korea Institute of Energy Technology Evaluation and Planning (KETEP) grant funded by the Korea Government Ministry of Knowledge Economy (No. 20113010030090).
REFERENCES
- C.-M. Jang, J.-S. Lee, B.-Y. Tak and C.-G. Kim, “Characteristics of Design Parameters for an Industrial Regenerative Blower,” Proceedings of the Summer Conference of The Society of Air-Conditioning and Refrigerating Engineers of Korea, Yongpyeong Resort, June 2012, pp. 175-178. (in Korean)
- C.-M. Jang and G.-Y. Han, “Enhancement of Performance by Blade Optimization in Two-Stage Ring Blower,” Journal of Thermal Science, Vol. 19, No. 5, 2010, pp. 383-389. doi:10.1007/s11630-010-0398-5
- Y.-S. Choi, K.-Y. Lee, K.-H. Jeong, Y.-K. Kim and J.-M. Seo, “Design and Performance Evaluation of Side Channel Type Regenerative Blower,” Proceedings of KSME Manufacturing and Design Engineering Division Spring Conference, Jeju, June 2011, pp. 31-32. (in Korean)
- R. H. Myers and D. C. Montgomery, “Response Surface Methodology: Process and Product Optimization Using Designed Experiments,” John Wiley & Sons, New York, 1995.
- N. E. Sevant, M. I. G. Bloor and M. J. Wilson, “Aerodynamic Design of a Flying Wing Using Response Surface Methodology,” Journal of Aircraft, Vol. 37, No. 4, 2000, pp. 562-569. doi:10.2514/2.2665
- “AMCA 210(ASHRAE 51) Standard: Laboratory Methods of Testing Fans for Aerodynamic Performance Rating,” Air Movement and Control Association (AMCA) International, Inc. and ASHRAE, Inc., Arlington Heights, Atlanta, 1999.
- “CFX-13 User Manual,” ANSYS Inc., Canonsburg, 2011.
- F. R. Menter, “Two-Equation Eddy-Viscosity Turbulence Models for Engineering Application,” AIAA Journal, Vol. 32, No. 8, 1994, pp. 1598-1605. doi:10.2514/3.12149
- A. A. Guinta, “Aircraft Multidisciplinary Design Optimization Using Design of Experimental Theory and Response Surface Modeling Methods,” Ph.D. Dissertant, Virginia Polytechnic Institute and State University, Blacksburg, 1997.