Journal of Sustainable Bioenergy Systems
Vol.3 No.1(2013), Article ID:29077,8 pages DOI:10.4236/jsbs.2013.31005
A Set of Coherent Indicators for the Assessment of the Energy Profitability of Energy Systems*
1Department of Chemical, Mining and Environmental Engineering (DICMA), Alma Mater Studiorum, University of Bologna, Bologna, Italy
2Institute for Prospective Technological Studies, European Commission-Joint Research Centre, Seville, Spain
Email: #mauro.cordella@ec.europa.eu, carlo.stramigioli@unibo.it, francesco.santarelli@unibo.it
Received January 24, 2013; revised February 27, 2013; accepted March 8, 2013
Keywords: Energy Indicators; Energy Profitability; EROI; LCA; Product System; Renewable and Non-Renewable Resources
ABSTRACT
The concern on climate change and on the limitations of fossil fuels is leading to the promotion of renewable-based energy options. However, the assessment of the energy profitability of a technology is still a controversial topic, especially when renewable-based systems are compared with non-renewable ones and when the depletion of the stocks of available resources is not accounted properly. As a matter of fact, some popular energy indicators do not seem to cover all the aspects of the problem, with the risk of drawing ambiguous conclusions. A set of life cycle-based indicators is proposed in order to establish a more reliable approach to the assessment of energy products which decouples the different contributions given by renewable and non-renewable resources. The proposed set of indicators has been quantified for different groups of energy products and compared with an energy indicator frequently used (i.e. EROI). A coherent assessment of the depletion of energy resources and of the energy profitability of the products is presented. The indicators could even contribute to understand the feasibility of energy projects and plans by evaluating their impact on the stock of energy resources.
1. Introduction
World energy scenarios point out an increasing energy demand which collides with the environmental, economic and geo-politic limits of fossil fuels, the source of energy most commonly used by mankind. The need for producing energy in a sustainable way has brought in the course of time to the development of several “green” technologies based on renewables [1].
The increasing use of renewables for energy production raises the problem of a sound evaluation of their sustainability [2,3]. This can be achieved only if the focus of the analysis is broadened from a process-specific point of view to a wider system perspective where all the stages contributing to the production of energy are taken into account [4,5]. Following the approach described with the LCA methodology [6,7], this means that the evaluation of an energy system has to include aspects related both to energy conversion and to production and supply of energy flows.
The development of a coherent and universally accepted metric of sustainability indicators has not been achieved yet, as suggested by the significant attention given to this problem by many important organisations operating in different fields [8-13].
With regard to a strictly energy analysis, many indicators are available in literature under different names [14, 15], generally referring to two main parent indicators: Energy Return On (Energy) Investment (EROI) [16,17] and Cumulative Energy Demand (CED) [18,19]. EROI intends to express the energy return on the energy invested in a process, while CED measures the primary energy demanded in a system. EROI does not account for the energy embodied in the processed resources, while CED is composed of different contributions based on the nature of the energy spent. The application of the two indicators to the assessment of the energy profitability of an energy system is therefore affected by some critical issues which need to be pointed out and overcome.
The present paper presents a set of energy indicators which are proposed with the aim of moving further than the process approach of EROI and to adapt CED to the accounting of the stocks of resources involved. This has been recently recognised in [20] as significant issue in sustainability analysis.
2. A Sustainable Perspective in Energy Assessment
An energy production system could be simplified with the scheme shown in Figure 1, where three significant steps are recognized, i.e. resources acquisition; resources processing and transformation into energy carriers; energy transport and distribution.
The following variables are considered:
• A is the energy content of the feedstock to be transformed, which can be a pure energy stream, as in the case of solar and wind energy, or associated with a material stream;
• B = B1 + B2 + B3 is the external energy required for the activities in place within each stages of the scheme, logistics included. B1 is the energy required for the production and supply of the energy feedstock; B2 is the energy required for the energy conversion processes and B3 is the energy required for the distribution of the energy product. These terms should account for the overall primary energy demand due both to the supply of process energy Bpr and to the relevant quota of the energy embodied in machinery and equipments Bem. From the previous definition it follows that B1 = 0 for solar and wind energy;
• C is the energy product made available for the final use (i.e. a given amount of thermal or electric energy or a given energy content of a fuel).
With reference to the scheme represented on Figure 1, it is apparent that the overall performance of a system is affected also by the end-use energy efficiency, which depends on a large number of factors (e.g. the energy class of household electrical appliances or the engine efficiency of a car and the driving mode). The final use phase was not considered because the effort of considering a large variety of situations would not add, in this context, significant knowledge on the basic aspects of the problem. The terms A, B and C must be referred to the same calculation basis which can be chosen as an arbitrary amount of energy or energy flow.
With reference to the previous general scheme, indi-
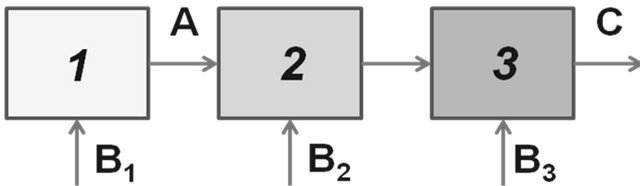
Figure 1. General scheme of an energy production system: 1. raw resource acquisition; 2. resource processing and transformation into energy carriers; 3. energy transport and distribution. A, B and C represent: the energy content of the feedstock, any external inputs of energy and the energy content of the output, respectively.
cators can be defined in order to assess the energy profitability of different resources. One of the most popular is EROI [16], which was introduced in Eighties by analogy with economic analysis. According to the scheme reported on Figure 1, EROI is defined as:
 (1)
(1)
Despite its popularity [17,21-26], EROI can be considered an indicator which is focused on a portion of the system and which does not take into account for the nature of the resources involved and for the resulting effects in terms of stocks conservation. As a consequence, the use of EROI is affected by significant limitations.
EROI was apparently created in similitude with the well known economic index ROI-Return on Investment. ROI is the ratio between “annual monetary net benefits” and “capital cost” invested in a project. EROI expresses a sort of dimensionless ratio between the energy output C obtained in a given time frame and the demand of process energy B in the same period.
The following critical observations seem appropriate from a theoretical point of view:
• The energy demand B is provided by a set of energy products C’ each one requiring an amount of energy A’ + B’. The evaluation of B requires that the production scheme is replicated by moving backwards until the overall demand is completely quantified in terms of primary energy;
• The feedstock energy A is always excluded from the definition of EROI no matter the energy feedstock used. The general validity of this assumption results questionable, at least when non-renewable resources are used;
Although several papers [17,21,23,25,26] have dealt with methodological issues related to the calculation of EROI, no standard procedure has been developed to set the energy contributions to include in the definition of the term B. Moreover, it does not seem enough emphasized that a coherent comparison among energy products should be limited within groups of products which provide the same function and are similar with respect to use, properties and technological aspects (e.g. it seems appropriate that bio-ethanol is compared with petrol but not with crude oil) [see for all 16,17].
The previous observations can be summarized in the following points:
• All the primary energy contributions of concern should be included in the definition of the energy indicators giving due attention to the nature of the energy resources exploited and to the consequent effects on the available stocks;
• Standard procedures for the system boundaries definition and for the calculation of the energy indicators should be provided in order to conduct clear and coherent analyses;
• Only equivalent categories of energy products (i.e. products providing the same function) should be compared.
Indicators to overcome these inconveniences and criteria for their use are proposed and discussed in the following sections.
3. Quantification of the Energy Demand of a System
The evaluation of an energy system should take into account both for the feedstock energy A and for the request of external energy B. The overall demand of energy A + B is to be expressed in terms of primary energy which can be quantified according to the procedure followed for the calculation of the Cumulative Energy Demand (CED) in Life Cycle Assessment [18]. The demand of primary energy results from the contribution of different resources. Single contributions can be classified in two main categories: non-renewable resources (NR) and renewable ones (R). An appropriate measure of the renewability of a resource is given by the ratio between its restoration rate (vr) and its exploitation rate (ve):
• When vr/ve < 1 the energy stock cannot be completely restored and therefore the resource is considered non-renewable;
• When vr/ve ≥ 1 the energy stock is not affected by the exploitation rate of the resource, which can thus be considered renewable.
An energy expense should be accounted every time the use of a resource produces an irreversible depletion of overall stock. This is the case of inherently non-renewable resources, i.e. fossil and nuclear fuels, whose vr is in practice equal to 0 as a consequence of space-time limitations.
On the contrary, an energy expense equal to 0 can be set for the use of renewables. Nevertheless, since the ratio vr/ve is controlled by the availability of adequate land extensions, the concrete renewability of the resource depends on the territorial scale of interest for the assessment. The renewable energy stock which can be made available on a certain territory defines the limit until which resources can be exploited without compromising their inherent renewability. If the demand of renewable resources were larger than the actual production and/or procurement capacity, the unbalanced energy demand should be fulfilled with other resources.
Variations to the approach previously outlined may result embracing a different cultural perspective [27,28]. If it is accepted that the complete depletion of the resource can happen in a fixed time frame, which is equivalent to saying that no resource is left to future generations, a virtual vr could be assigned to non-renewable resources. This would produce a credit in the balance which could be for instance calculated by dividing the estimated amount of available energy “Ea” by the allowed depletion time “td”. A similar situation may occur when no concern is raised on the abundance of the resource over time, which may be the case of nuclear power. If neither nuclear nor fossil fuels were considered in the assessment it would result that the feedstock energy is always not relevant for the assessment, as in the case of EROI. However, it is apparent from a sustainability perspective that the conservation of non-renewable stocks should be pursued.
4. Energy Indicators in Sustainability Assessment
On the basis of the previous considerations some indicators can be defined in order to evaluate the energy profitability of energy products from a system perspective.
The term energy product is used to identify the final energy output (e.g. power, fuel, process heat) resulting from the processing of a given resource. Energy products can stand alone or can be grouped in categories of products being similar with respect to function, technology or application.
In accordance with the fundamentals of the Life Cycle Assessment methodology [6,7], some preliminary observations are needed before presenting the indicators:
• The functional unit of an energy system can be defined in terms of energy units (i.e. with the energy output made available in form of energy products) and with reference to a specific application (e.g. the production of electricity from the direct combustion of wood in a specific geographical and technological context). The functional unit can thus correspond with the energy output of the system. The same functional unit should be considered to allow for a sound comparison among alternative product options.
• The scheme represented in Figure 1 is a simplification of a real energy system, where one or more output flows may result (e.g. when oilseeds are pressed for the production of vegetable oil, a residual cake is produced which can be used as fuel or as cattle feed). A problem of allocation of the energy inputs arises any time two or more products are generated in a system. The procedure followed to deal with this allocation problem should be clearly stated when results from an energy assessment are reported;
• The system boundaries of the analysis should be described carefully in order to define which stages and which contributions are included in the assessment, with particular reference to the backwards path for the production and supply of external energy;
• Data appropriateness and representativeness should be always assured.
It is apparent that energy indicators can be significantly affected by these factors and standard guidelines should be followed in order to yield comparable and robust results.
4.1. System Energy Return (SER) and System Energy Efficiency (SEE)
The System Energy Return (SER) is an intensive indicator which expresses the energy yield of an energy product system resulting from the energy investment of non-renewable resources. SER can defined as:
 , (2)
, (2)
where A, B, C are average amounts of energy or energy flows referred to a certain time frame and to a specific energy product. As introduced previously, B includes even Bem, i.e. the total energy embodied in machinery and equipments with reference to the time frame considered.
From the definition above, it is apparent that the inverse of SER measures the overall input of non-renewable energy (i.e. the sum of ANR and BNR) required for a single energy unit of the energy product evaluated. In any case, the higher is the SER the lower is the depletion of the non-renewable stocks. When SER is higher than 1 the energy output is higher than the non-renewable energy demanded in the system. A SER lower than 1 generally results for non-renewable energy products since in this case (A + B)NR is necessarily higher than the energy output C. However, different outcomes could result when the non-renewable inputs were not fully accounted because of the allocation procedure (see Section 3) or the cultural perspective embraced in the assessment (see Section 2).
If all the contributions of primary energy were considered (i.e. the sum of A and B), an indicator expressing the System Energy Efficiency (SEE), and generally lower than 1, would be obtained:
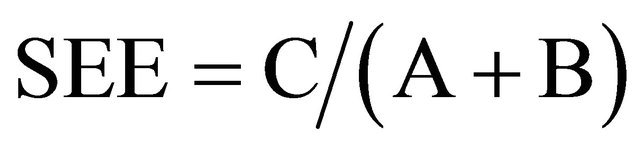 . (3)
. (3)
The two indicators refer to different quantities of energy: the overall amount of primary energy required by a system (i.e. the SEE) or the non-renewable fraction of it (i.e. the SER). However, from a sustainability point of view the lowest possible use of non-renewable resources should be pursued, as previously highlighted in Section 2.
4.2. System Energy Gain (SEG)
The System Energy Gain (SEG) represents the energy gain/loss achieved with the production of C and the use of feedstock energy A and external energy B, both expressed in terms of non-renewable energy. Fixed a time or a quantitative basis, SEG can be defined as:
 . (4)
. (4)
When calculated on an annual basis, this parameter can be considered equivalent to an energy cash flow, since it somehow recalls the definition of cash flow used in economic analysis.
Scores referred to a certain timeframe or to specific amounts of energy units can be obtained from the definition above through a change of the calculation basis.
A positive score of SEG results when SER is higher than 1.
4.3. Energy Return Time (ERT)
When the energy flow C (energy/year) and the flows and amounts of non-renewable energy associated with A (energy/year), with Bpr (energy/year) and with Bem (total energy/infrastructure) are calculated, an Energy Return Time (ERT) can be defined according to:
 . (5)
. (5)
The return time expresses the time needed to produce an amount of energy output equal to the overall investment of non-renewable energy in the product energy system.
It could be demonstrated that ERT is a finite number only when SER is higher than 1. In all the other cases, a geological time scale could be considered necessary to cover the energy investment.
5. Application of the Indicators
In order to evaluate the implications associated with the set of indicators presented above, the indicators have been calculated for different energy products and the resulting scores have been compared with those calculated according to EROI.
The basket of products selected for this assessment belongs to three different energy categories: power, heat and transport fuels. Following a typical LCA approach, single energy production and supply chain have been decomposed in a sequence of unit processes. The associated energy requirements have been evaluated for each unit process on the basis of the data available in the Ecoinvent database 2.2 [29-31], which is one of the most comprehensive Life Cycle Inventory dataset in Europe. Results of the assessment are shown in Table 1. SEG values are reported with reference to 100 energy units (e.u.) of the single energy product Cj.
A range of values results for each indicator as a consequence of the assessment of the different options considered for each group of energy products. A wide group of inventory dataset has been considered: 140 for power production; 56 for heat production; and 24 for transport fuel production. Further details are provided in Annex 1.
From the assessment it results that:
Table 1. Table type styles EROI, SEE, SER and SEG calculation for different resources and intended uses. Calculation based on the Ecoinvent 2.2 dataset [29-31].
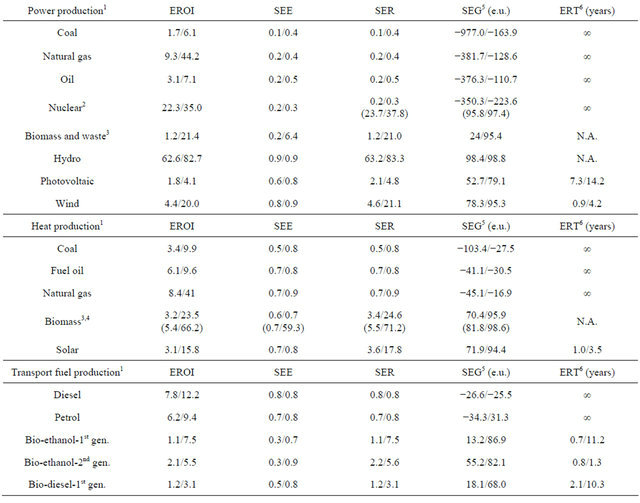
1Range values depending on different production sites and technologies; 2(A + B)NR calculation limited to fossil fuels for values within brackets; 3Different processes and allocation procedures considered (SEE values larger than 1 can result depending on the procedure followed); 4Values referred to co-generation reported in brackets; 5Reference: 100 e.u. of energy output Cj; 6N.A.: evaluation not possible on the basis of the data considered.
• The difference in results between the presented indicators and the EROI is appreciable. EROI scores are close to those of SER for renewables, while they are considerably greater for options based on non-renewables resources. The same SER and SEE scores are obtained in case of products based only on fossil fuels;
• A significant dispersion of the results is observed. This is due to the consideration of different scenarios for each energy product and to the presence of allocation issues in some energy conversion processes, as in the case of biomass-based products [32]. Results are moreover affected by the uncertainty associated with the calculation of the contributions A, B and C from the LCI datasets. Generic information is used in the assessment; the calculation of the energy profitability of specific energy systems should be based on representative and relevant data;
• The ranking of the products changes significantly depending on the indicator considered. The different energy options should be ranked based on the intensity with which the stock of non-renewable resources or the overall stock of energy resources is depleted (i.e. based on the inverse of SER or SEE, respectively). Sound comparisons should be limited to equivalent uses of the resources within the same product category;
• SEG is always negative for non-renewable resources pointing out a reduction of the global stock of resources (SER < 1). A positive score could be obtained only assigning a discount to the feedstock energy (see Sections 2 and 3.2);
• Renewable-based options become more attractive than fossil fuels when SER is considered in place of EROI. An incomplete representation of the system is depicted by EROI due to its inherent limitations (see Section 1);
• SER and SEG scores for nuclear power depend on the inclusion or less of nuclear resources within the definition of (A + B)NR. If no concern were paid on the depletion of the nuclear stock, the production of power from nuclear or renewable fuels would yield similar energy performances;
• ERT is a finite positive number only when SEG > 0 (SER > 1). The time needed to return the energy investment depends on the amount of energy embodied in the equipments and on the net gain of energy potentially achieved each year. It must be observed that shorter ERTs do not imply higher overall energy gains.
6. Conclusions
This paper was motivated by the increasing concern on the depletion of non-renewable resources and the limitations which could arise from a massive exploitation of renewables in order to reduce greenhouse gases emissions.
Popular energy indicators were revisited and discussed based on a product system approach. This suggested the introduction of a set of indicators which can take into account for the whole life cycle of the energy products and which can be used to assess the impact on the stocks of non-renewable resources.
The presented indicators were quantified for different energy products using the information available from the Ecoinvent database 2.2, a well-known and widespread data set in the field of Life Cycle Assessment. A range of values was obtained for each individual energy product as the result of technological and territorial differences. Different energy products were grouped within product categories identified on the basis of a specific use. A coherent comparison among the indicators was carried-out and the energy benefits of renewable-based products resulted apparent.
The application of the proposed set of indicators provides a reliable and coherent assessment of the impact due to energy product systems on the stocks of resources. These pieces of information can contribute, together with the consideration of economical, environmental and social aspects, to support the promotion of sustainable energy production options.
REFERENCES
- V. V. N. Kishore, “Renewable Energy Engineering and Technology: Principles and Practice,” Earthscan, London, 2009.
- J. Hamrin, H. Hummel and R. Canapa, “Review of the Role of Renewable Energy in Global Energy Scenarios,” Report Prepared for The International Energy Agency Implementing Agreement on Renewable Energy Technology Deployment, 2007. http://www.iea-retd.org/files/REVIEW%20OF%20RENEWABLE%20ENERGY%20IN%20GLOBAL%20ENERGY%20SCENARIOS_final.pdf
- Directive 2009/28/EC of the European Parliament and of the Council of 23 April 2009 on the Promotion of the Use of Energy from Renewable Sources and Amending and Subsequently Repealing Directives 2001/77/EC and 2003/ 30/EC. Official Journal L 140, 2009, pp. 0016-0062.
- N. Wrisberg, H. A. Udo de Haes, B. Bilitewski, S. Bringezu, F. Bro-Rasmusse, R. Clift, P. Eder, et al., “Demand and Supply of Environmental Information,” In: N. Wrisberg and H. A. Udo de Haes, Eds., Analytical Tools for Environmental Design and Management in a Systems Perspective: The Combined Use of Tools, Kluwer Academic Publishers, Boston, 2002.
- J. Dewulf and H. Van Langenhove, “Renewables-Based Technology: Sustainability Assessment,” John Wiley & Sons, Hoboken, 2006. doi:10.1002/0470022442
- ISO 14040, “Environmental Management—Life Cycle Assessment—Principles and Framework,” International Organisation for Standardisation (ISO), Geneve, 2006.
- ISO 14044, “Environmental Management—Life Cycle Assessment—Requirements and Guidelines,” International Organisation for Standardisation (ISO), Geneve, 2006.
- International Atomic Energy Agency, United Nations Department of Economic and Social Affairs, International Energy Agency, Eurostat and European Environment Agency, “Energy Indicators for Sustainable Development: Guidelines and Methodologies,” International Atomic Energy Agency, Wien, 2005. http://www-pub.iaea.org/MTCD/publications/PDF/Pub1222_web.pdf
- International Institute for Sustainable Development, “Energy Sustainability Gauge,” 2010. http://www.iisd.org/energy/gauge.asp
- Organisation for Economic Co-operation and Development, “Contribution to the United Nations Commission on Sustainable Development 15. Energy for Sustainable Development,” 2007. http://www.oecd.org/dataoecd/6/8/38509686.pdf
- World Bank Group, “World Bank Group Brief on Sustainable Energy,” 2006. http://siteresources.worldbank.org/EXTENERGY/Resources/336805-1148481921459/WorldBankGroupBriefonSustainableEnergy.pdf
- European Commission—Eurostat, “Sustainable Development Indicators Introduced,” 2010. http://epp.eurostat.ec.europa.eu/statistics_explained/index.php/Sustainable_development_indicators_introduced
- American Institute of Chemical Engineering—Institute for Sustainability, “Renewable Fuels Metrics Roundtable,” 2010. http://www.aiche.org/IFS/Corporate/GrantProjects/RenewableFuelsMetrics.aspx
- P. E. Fitch and J. M. Cooper, “Life Cycle Energy Analysis as a Method for Material Selection,” Journal of Mechanical Design, Vol. 126, No. 5, 2004, pp. 798-804.
- J. Malca and F. Freire, “Renewability and Life-Cycle Energy Efficiency of Bioethanol and Bio-Ethyl Tertiary Butyl Ether (bioETBE): Assessing the Implications of Allocation,” Energy, Vol. 31, No. 15, 2006, pp. 3362- 3380. doi:10.1016/j.energy.2006.03.013
- C. J. Cleveland, R. Costanza, C. A. S. Hall and R. Kaufmann, “Energy and the US Economy: A Biophysical Perspective,” Science, New Series, Vol. 225, No. 4664, 1984, pp. 809-897. doi:10.1126/science.225.4665.890
- D. J. Murphy and C. A. S. Hall, “Year in Review—EROI or Energy Return on (Energy) Invested,” Annals of the New York Academy of Sciences, Vol. 1185, No. 1, 2010, pp. 102-118. doi:10.1111/j.1749-6632.2009.05282.x
- R. Frischknecht, N. Jungbluth, H. J. Althaus, C. Bauer, G. Doka, R. Dones, et al., “Implementation of Life Cycle Impact Assessment Methods,” Ecoinvent Report No. 3, v2.0, Swiss Centre for Life Cycle Inventories, Dübendorf, 2007.
- T. Nussbaumer and M. Oser, “Evaluation of Biomass Combustion Based Energy Systems by Cumulative Energy Demand and Energy Yield Coefficient,” Final Report Prepared for International Energy Agency (IEA) BioenergyTask 32: Biomass Combustion and Co-Firing and Swiss Federal Office of Energy (SFOE), 2004. http://www.ieabcc.nl/publications/Nussbaumer_IEA_CED_V11.pdf
- J. E. Stiglitz, A. Sen and J. P. Fitoussi, “Report by the Commission on the Measurement of Economic Performance and Social Progress,” 2009. http://www.stiglitz-sen-fitoussi.fr/documents/rapport_anglais.pdf
- C. J. Cleveland, R. K. Kaufmann and D. I. Stern, “Aggregation of Energy,” Encyclopedia of Energy, Vol. 1, 2004, pp. 17-28. doi:10.1016/B0-12-176480-X/00231-X
- M. Giampietro, S. Ulgiati and D. Pimentel, “Feasibility of Large-Scale Biofuel Production,” BioScience, Vol. 47, No. 9, 1997, pp. 587-600. doi:10.2307/1313165
- C. A. S. Hall, S. Balogh and D. J. R. Murphy, “What Is the Minimum EROI That a Sustainable Society Must Have?” Energies, Vol. 2, No. 1, 2009, pp. 25-47. doi:10.3390/en20100025
- I. Kubiszewski, C. J. Cleveland and P. K. Endres, “MetaAnalysis of Net Energy Return for Wind Power Systems,” Renewable Energy, Vol. 35, No. 1, 2010, pp. 218- 225. doi:10.1016/j.renene.2009.01.012
- A. J. Mansure and D. A. Blankenship, “Energy Return on Energy Investment, an Important Figure-Of-Merit for Assessing Energy Alternatives,” Proceedings of the ThirtyFifth Workshop on Geothermal Reservoir Engineering, Stanford University, Stanford, 1-3 February 2010.
- K. Mulder and N. J. Hagens, “Energy Return on Investment: Toward a Consistent Framework,” A Journal of the Human Environment, Vol. 37, No. 2, 2008, pp. 74-79. doi:10.1579/0044-7447(2008)37[74:EROITA]2.0.CO;2
- P. Hofstetter, “Perspectives in Life Cycle Impact Assessment; A Structured Approach to Combine Models of the Technosphere, Ecosphere and Valuesphere,” The International Journal of Life Cycle Assessment, Vol. 5, No. 1, 2000, p. 58. doi:10.1007/BF02978561
- M. Thompson, R. Ellis and A. Wildavsky, “Cultural Theory,” Westview Press, Boulder, 1990.
- R. Frischknecht, N. Jungbluth, H. J. Althaus, G. Doka, R. Dones, R. Hischier, et al., “Overview and Methodology,” Final Report Ecoinvent Data v2.0, No. 1, Swiss Centre for Life Cycle Inventories, Dübendorf, 2007.
- R. Hischier, B. Weidema, H. J. Althaus, C. Bauer, G. Doka, R. Dones, et al., “Implementation of Life Cycle Impact Assessment Methods,” Final Report Ecoinvent v2.2, No. 3, Swiss Centre for Life Cycle Inventories, Dü- bendorf, 2010.
- B. Weidema, R. Hischier, H. J. Althaus, C. Bauer, G. Doka, R. Dones, et al., “Code of Practice,” Final Report Ecoinvent Data v2.1, No. 2, Swiss Centre for Life Cycle Inventories, Dübendorf, 2009.
- E. Van der Voet, R. J. Lifset and L. Luo, “Life-Cycle Assessment of Biofuels, Convergence and Divergence,” Biofuels, Vol. 1, No. 3, 2010, pp. 435-449. doi:10.4155/bfs.10.19
Annex 1. Supporting Information on the Datasets Consulted to Calculate EROI, SEE, SER and SEG
Ranges of the indicators for power production have been obtained by comparison of Life Cycle Inventory data from:
• 25 datasets for coal combustion and 21 datasets for oil combustion around Europe;
• 23 datasets for natural gas combustion around the World;
• 4 datasets for nuclear fission in continental Europe, Switzerland and the USA;
• 22 datasets for electricity from waste or biogas, with or without cogeneration, in Switzerland (20 datasets), Brazil (1 dataset) and China (1 dataset);
• 27 datasets for hydroelectric energy around the World;
• 41 datasets for photovoltaic energy (26 for power plants around the World, 15 for domestic applications in Switzerland);
• 8 datasets for wind farms in Switzerland and around Europe, from 30 kW to 2 MW power plants, in land or off-shore.
Ranges of the indicators for heat production have been obtained by comparison of Life Cycle Inventory data from:
• 4 datasets for coal combustion around Europe, from 5 kW to 10 MW thermal plants;
• 8 datasets for the combustion of light or heavy oils around Europe, from 10 kW to 1 MW thermal plants, with or without heat recovery through water condensation;
• 11 datasets for natural gas combustion around Europe, in boilers or industrial furnaces, with or without heat recovery through water condensation;
• 29 datasets for wood combustion in Swizerland in 6 - 1000 kW heaters and 8 datasets referring to combined heat and power production from biogas and waste;
• 4 datasets for solar energy in Switzerland (domestic application).
Ranges of the indicators for transport fuel production have been obtained by comparison of Life Cycle Inventory data from:
• 4 datasets for low sulphur or conventional diesel in Switzerland and in Europe;
• 4 datasets for low sulphur or unleaded petrol in Switzerland and in Europe;
• 5 datasets for first generation bio-ethanol from corn (USA), potatoes (Switzerland), rye (European average), sugar beet (Switzerland), sugar cane (Brazil);
• 6 datasets for second generation bio-ethanol from grass (Switzerland), molasses of sugar (Switzerland and Brazil), sorghum (China) and wood (Switzerland and Sweden);
• 5 datasets for biodiesel from palm oil (Malaysia), rape oil (Switzerland and rest of Europe), soybean oil (Brazil and the USA).
NOTES
*Disclaimer: The opinions expressed are purely those of the author and may not in any circumstances be regarded as stating an official position of the European Commission.
#Corresponding author.