American Journal of Analytical Chemistry
Vol.06 No.12(2015), Article ID:61195,18 pages
10.4236/ajac.2015.612090
Temperature Fractionation (TF) of Hg Compounds in Gypsum from Wet Flue Gas Desulfurization System of the Coal Fired Thermal Power Plant (TPP)
Matej Sedlar1,2, Majda Pavlin2,3, Radojko Jaćimović3, Andrej Stergaršek4, Peter Frkal3, Milena Horvat2,3*
1Esotech, d.d., Velenje, Slovenia
2International Postgraduate School Jožef Stefan, Ljubljana, Slovenia
3Jožef Stefan Institute, Ljubljana, Slovenia
4KEMEK d.o.o., Ljubljana, Slovenia

Copyright © 2015 by authors and Scientific Research Publishing Inc.
This work is licensed under the Creative Commons Attribution International License (CC BY).
http://creativecommons.org/licenses/by/4.0/


Received 18 October 2015; accepted 15 November 2015; published 18 November 2015
ABSTRACT
Gypsum from the wet flue gas desulfurization system of the lignite fired thermal power plant Šoštanj, Slovenia, can efficiently retain mercury (Hg), of which most is contained in finer gypsum fractions, with concentrations above 10 kg−1. The aim of this work was to identify and study the temperature stability of Hg species in gypsum by a temperature fractionation (TF) method. A self- constructed apparatus was used that consisted of an electrical furnace for controlled heating up to 700˚C, with a heating rate of 2.2˚C・min−1, and an AAS detector with Zeeman background correction. The pattern of Hg release during temperature increase depends highly on the matrix/substrate in which it is contained. Based on spiking gypsum with known Hg compounds we concluded that the largest proportion of Hg in gypsum belongs to Hg-Cl and Hg-Br compounds appearing at 160˚C to 200˚C, followed by smaller amounts of HgO, HgS and Hg sulfates appearing at 300˚C and 450˚C. Further development of methodology for identifying Hg species would require identification of the decomposition fragments of Hg and other compounds, complemented by a better understanding of Hg reactivity at higher temperatures.
Keywords:
Temperature Fractionation, Mercury Compounds, FGD Gypsum, Multi-Element Analysis, Spiking

1. Introduction
Mercury (Hg) is a global pollutant, the main source in the atmosphere being the combustion of fossil fuels in particulate coal burning and other high temperature industrial processes [1] . One of the main objectives of the recently adopted Minamata Convention [2] is to reduce Hg emissions into the environment. More stringent emission standards for Hg are therefore expected in the near future, and much effort is focused on developing efficient and economically acceptable technologies for Hg removal. Flue gas released from coal combustion contains elemental Hg (Hg(0)), oxidized Hg(II) and Hg bound to particles, Hg(P) [3] [4] . Hg(P) could be retained in electrostatic precipitators (ESP) or baghouses, while Hg(0) and Hg(II) remain predominantly in the gaseous phase of the flue gas [4] . Hg could be oxidized in the gas phase on particles (e.g. active carbon) over a selective catalytic reduction unit (SCR) [5] , in interaction with different gases or in a wet flue gas desulfurization (WFGD) system. Oxidized Hg is much more soluble in water than Hg(0) and could therefore be effectively removed in wet scrubbers.
WFGD scrubbers are very efficient in reducing SO2 emissions and, simultaneously, retain Hg(II), however oxidation of Hg(0) to Hg(II) is also possible under appropriate conditions (temperature, pH, Eh, additives and others compound present, etc.) [6] - [8] . Oxidation of Hg(0) is much more efficient when a prior SCR unit is installed [9] . Additionally, reduction of Hg(II) into Hg(0) was observed, which can lead to re-mobilization of oxidized Hg into the gaseous phase and increased emissions into the atmosphere [4] . Other contaminants, originating from coal (As, Se, etc. [10] - [13] ), could be present in FGD slurry and are partitioned between solid by-pro- ducts (e.g. gypsum) and water solution. In general, all the ions present in the slurries of WFGD plant affect the chemistry and stability of Hg and Hg species [14] - [16] . Some additives are very successful in Hg oxidation therefore it is very important during the disposal to be aware of the toxic products they contain [8] [17] . Finally, most of the WFGD wastes are landfilled but some portion is used for wallboard production [18] - [21] , as an additive to cement and concrete production and as a soil amendment [19] . The amount of Hg released from wallboard production at the temperature where this process begins is very important in developing efficient production without Hg re-emission.
Generally, various Hg compounds are present in gypsum and in solid samples. Recently, their presence has been determined with various methods such as the leaching test [22] [23] and thermal fractionation [24] - [33] . Hg compounds have different properties, including different vapor pressures at different temperatures [18] . This is why the temperatures at which Hg compounds are decomposed and evaporated are different. Therefore, investigations of thermal stability of Hg compounds in different solid samples are of interest, and, for two reasons: i) to understand temperature stability of Hg in solid substrates/wastes and ii) to define Hg fractions released during controlled heating as proxies for the identification of Hg compounds present in solid substrates. However, as evident from the literature [22] [30] [34] - [36] , the experimental conditions (amount of sample, heating rate, flow rate, gas type, presence of substrate mixed with Hg compounds…) may contribute to the differences between published results. Calibration with pure Hg compounds may be of help, although properties of solid substrates may affect the breakdown process and appearance of Hg peaks at different temperatures [36] - [39] .
Retention of Hg in WFGD slurry and consequently the latter’s stability is very important. Hg could be partitioned between the solid (gypsum, unconsumed limestone, insoluble constituents of limestone and solids washed out of the flue gas) and aqueous phases, and has the affinity for retention in the finer fractions. The particle size and porosity of gypsum are very important in partitioning Hg between phases. Limestone that is added continuously into scrubber contains Mg (as dolomite, CaMg(CO3)2), Si (quartz, SiO2), Fe, Mn, Al and other metals [40] . For example, 12% of total gypsum mass contains 62% of its Hg bound on small particles [6] . Gypsum slurry settles in two layers, upper brownish slowly-settling and bottom white-grey layers. The upper layer contains much more Hg and is also enriched with Si, Al, Fe, Mg and some trace elements such as Ti, Mn and Ba [41] . Thermal and dissolution stability can vary between Hg compounds and complexes in the gypsum. Knowledge about the interactions of Hg, ligands, metals and particles present in WFGD slurry is very important. When considering sorption properties, the well-known correlation of Hg and Fe as iron oxyhydroxides, could also be present [42] . There is evidence showing increased Hg concentration in the solid fraction when Fe species are available in the slurry. Probably, Fe is introduced with the lime or limestone added to the WFGD scrubber, where it can be found as Fe-coated clay minerals or Fe-oxide/hydroxide particles [41] . Kim et al. [43] showed a correlation between Fe and Hg where an additional leaching test described strong chemical sorption rather than physical adsorption of Hg. The importance of ligands (chloride, sulfate) presents in solutions that increase/de-
crease the Hg sorption to mineral sorbents such as goethite (α-FeOOH), γ-alumina (Al2O3) and bayerite (β- Al(OH)3) has also been demonstrated [43] .
Furthermore, during some extraction experiments in gypsum and wallboard production, a major Hg-releasing step―and therefore possible minerals of Hg-binding material―was also revealed. Fe, Al, K, Mg, Si, and S were the most common elements, indicating some of the minerals responsible for affecting the Hg-adsorption―iron oxides, iron hydroxide, phyllosilicate minerals (illite (K,H3O)(Al,Mg,Fe)2(Si,Al)4O10[(OH)2,(H2O)], glaucoite (K,Na)(Fe3+,Al,Mg)2(Si,Al)4O10(OH)2) and iron sulfides [19] . X-ray diffraction analysis confirmed the presence of phyllosilicate minerals (illite and kaolinite (Al2Si2O5(OH)4)) in post-leaching gypsum and wallboard residues [42] . Limestone that is introduced into a WFGD system contains only little of these minerals [44] .
The effect of a WFGD system on Hg retention is clearly evident in the thermal power plant (TPP) in Šoštanj, Slovenia where the retention of total Hg in the WFGD is as high as 89% [6] . The results of research reported here shows that the majority of Hg is retained in the slow-settling, finer particulate phase of the WFGD, with concentrations exceeding values of 10 mg∙kg−1 of Hg.
TPP Šoštanj consists of five power blocks with combined power of 779 MW. As a fuel it uses lignite from the local mine with a heating value of 9.5 MJ∙kg−1 and a consumption rate between 3.5 and 4.2 million tons per year. TPP Šoštanj has 2 WFGD units installed for removing sulfur oxides, the first covering blocks 1 to 4 and the second just block 5, both units using the wet limestone process with forced oxidation [6] [45] .
The aim of this work was to study the temperature stability of Hg and to identify the Hg compounds present in gypsum from Šoštanj TPP. Multi-element analyses of gypsum samples and Velenje lignite were also conducted in order to assist interpretation of the results. The processes of Hg retention in the WFGD have recently been studied in detail [6] - [8] , but have not so far included gypsum. The present paper adds to the knowledge of Hg behavior in the TPP with its high retention in the WFGD.
2. Materials and Methods
To achieve the objectives of better understanding the temperature stability of TPP gypsum samples from Šoštanj TPP, several methodological approaches have been taken to identifying Hg compounds. TPP gypsum samples were analyzed using the temperature fractionation method. Pure Hg compounds mixed with CaSO4∙2H2O substrate were prepared, as calibration standards and to study the effect of solid substrate on the temperature stability of the Hg compounds. These mixtures were then added to Šoštanj TPP gypsum in order to observe the effects of matrix on the temperature at which Hg compounds were released from the samples.
Multi-element analysis in different fractions of the gypsum and lignite samples was also performed.
2.1. Sample Preparation
2.1.1. Preparation and Characterization of the Gypsum Samples
Particles in 3 liters of the WFGD slurry from TPP Šoštanj were first separated into fine and coarser fractions labelled as FF and CF, with the help of a hydro cyclone. Half of the FF was returned into the separation process, where it was again separated into fine and coarser fractions labelled as FF1 and FF2. Four different size fraction samples were thus obtained in which FF contains both granulation sizes of FF1 and FF2. Granulation analyses of gypsum samples were conducted with Microtrac PSA FRA 9200 based on Fraunhofer laser diffraction. The size distribution of particles in each sample is presented in Figure 1.
Samples were then oven dried at 38˚C for a week to constant weight, in an electric drier/oven MEMMERT UFE 500. Moisture content lost during drying was 7.9% for FF, 8.7% for FF1, 3.2% for FF2 and 4.8% for sample CF.
After drying, samples were homogenized in the agate containers of a planetary mill (Fritsch planetary mill Pulverisette 7).
An aliquot of the original gypsum sample (not oven dried) was also kept for studies of the potential influence of moisture on Hg release during the temperature fractionation process.
2.1.2. Preparation of Samples of Pure Hg Compounds
Mercury compounds chosen for examination are presented in Table 1.
2.1.3. Preparation of Pure Hg Compounds Mixed with CaSO4∙2H2O
These pure compounds were “diluted” by mixing with CaSO4∙2H2O powder (Sigma-Aldrich Co. LLC.; purity

Figure 1. Size fractions of TPP gypsum samples.

Table 1. Type of mercury compound, suppliers and purity.
99% - 101% based on anhydrous substance). This substrate resembles gypsum from the WFGD in coal burning power plants. Each pure Hg compound (10 - 12 mg) was added to 5 g of substrate powder. The mixtures were carefully homogenized by mixing in zirconium containers placed in a planetary mill (Fritsch planetary mill Pulverisette 7). Homogenization was achieved in short mixing intervals of 10 minutes in order to avoid increase of temperature. The bulk homogeneity of each mixture sample (80 - 140 mg) was checked by wet digestion of 6 independent analyses of total Hg, followed by Hg determination by cold vapor atomic absorption spectrometry (CV AAS) after reduction with SnCl2 [46] .
2.1.4. Preparation of Gypsum Samples Spiked with Pure Mercury Compounds Mixed with CaSO4∙2H2O
Only the sample with the highest Hg content (sample FF) and finer particle size was chosen. It was spiked with ten different pure Hg compounds (Table 1), each previously mixed with CaSO4∙2H2O (1 - 7 mg). The mixtures were placed in a planetary mill (Fritsch planetary mill Pulverisette 7) for several homogenization periods of 10 minutes.
2.1.5. Preparations of Lignite Samples
Lignite samples were obtained at random from a conveyer belt during a normal working day to ensure representative samples. The combined mass of the samples was around 3 kg. They were dried to constant weight at 38˚C for a week in an electric drier/oven MEMMERT UFE 500. After the drying process, the combined samples
were ground with a ball mill and sieved with a Fritsch Pulverisette 0 Vibratory Micro Mill to a particle size of less than 250 µm.
2.2. Multi-Element Analysis of Gypsum and Lignite Samples
For k0-instrumental neutron activation analysis (k0-INAA) an aliquot (varied from 0.1 to 0.26 g) of gypsum and lignite samples was sealed into a pure polyethylene ampoule (SPRONK system, Lexmond, The Netherlands). Determination of short lived radionuclides was conducted by staking an aliquot and standard Al-0.1% Au (IRMM-530R) together, fixed in the polyethylene vial in sandwich form, and irradiated for 5 minutes in the carousel facility of the TRIGA reactor with a thermal neutron flux of 1.1 × 1012 cm−2∙s−1. For determination of medium and long lived radionuclides an aliquot and standard Al-0.1% Au were prepared on the same way as already described above for the short lived radionuclides. In this case irradiation lasted for 12 hours and was conducted in the carousel facility of the TRIGA reactor as well.
When short irradiation (5 minutes) was completed, the aliquot was measured after 10 and 35 minutes cooling time on absolutely calibrated HPGe detectors with a 40 and 45% relative efficiency. After long irradiation (12 hours) the aliquot was measured after 4, 8, and 20 days cooling time on the same HPGe detectors. For peak area evaluation, the HyperLab 2002 program was used. The values f = 28.63 (thermal to epithermal flux ratio) and α = − 0.0011 (epithermal flux deviation from the ideal 1/E distribution) were used to calculate element concentrations [47] [48] . Software package Kayzero for Windows was applied [49] to calculate the elemental concentrations and effective solid angle.
The k0-INAA procedure is accredited according to ISO/IEC 17025:2005 by the Slovenian Accreditation Agency (Accreditation certificate LP-090).
2.3. Experimental Apparatus for Temperature Fractionation
2.3.1. Apparatus
An RA-915+ Hg Analyzer with a PYRO-915+ pyrolysis unit was used for the detection of Hg. The instrument was developed for direct determination of total Hg by combustion of samples and cold vapor atomic absorption detection (CV AAS) with Zeeman background correction [50] .
The apparatus used for temperature fractionation was a home-constructed device (Figure 2). It consists of a

Figure 2. Scheme of the measuring line.
gas tank (1) for the supply of carrier gas, a flow meter (2) for flow adjustment and quartz tubes. The first quartz tube, with an outer diameter of 20 mm and inner diameter of 16 mm, was placed in the electric tube furnace (3). The quartz boat used for samples (4) was carefully positioned in the first quartz tube in the middle of the electric tube furnace Nabertherm RT 50/250/11 where the thermocouple is located. The quartz boat is semi-circular, with an inner diameter of 5 mm and length of 35 mm. The tube furnace consists of a ceramic tube, inner diameter 50 mm, and two plugs of ceramic fiber on each side. Each plug has a drilled hole in the middle for a tight fit to a quartz tube to reduce heat loss. The second quartz tube, with same dimensions as the first, was packed with quartz wool (5) and heated to 700˚C in a small electric furnace with inner diameter of 27 mm (6) to ensure the transformation of all volatile Hg compounds to elemental Hg and to retain any particles that may be released from the sample. The Lumex Pyro 915+ pyrolysis unit, with dimensions of 350 × 350 × 120 mm (7), ensured additional decomposition of any remaining volatile compounds of Hg that might interfere with the atomic absorption measurement [50] . Elemental Hg was detected by the Lumex Ra-915+ atomic absorption detector with Zeeman correction with detector dimensions of 470 × 210 × 110 mm (8), which was connected directly to a computer (9) for data collection. An impinger containing H2SO4-KMnO4 solution (10) was connected to the exhaust from the Lumex Ra-915+ to retain Hg(0) in solution by oxidation.
2.3.2. Procedure
Around 50 mg of each gypsum sample (FF, CF, FF1 and FF2) and each spiked FF sample was weighed in a quartz boat. When pure Hg compounds mixed with CaSO4∙2H2O were tested only 10 - 30 mg of the sample was weighed into the sample boat and as small amount of pure Hg compound as possible, not to exceed the upper limit of the detection range (2 - 30,000 ng∙m−3) [50] . However, for a signal to even be recognized as a peak of released Hg, at least 20 ng of Hg should be present in the sample―due to noise caused by the detector Lumex Ra-915+. The results of mass balance for different samples showed that the intensity of the peaks does not match perfectly to recording units (ng∙m−3), due to a drifting measuring baseline, as a software deficiency. However, these units serve for easier comparison of the signal intensity. To resolve the drifting baseline problem, corrections were made on every thermogram by deducting the thermogram area, obtained by averaging several thermograms of blank samples. In addition to baseline correction, temperature correction was also considered, due to difference in the temperature measured at the sample and that recorded by the electric tube furnace (Figure 2, (3)). An independent measuring thermocouple was fused directly into the quartz tube, where the sample is located, giving precise temperature readings. After several experiments, the average of the temperature data was calculated and deducted from the data recorded by electric tube furnace to provide correct temperature. The sample boat (Figure 2, (4)) was carefully positioned in the middle of the quartz tube which was heated from room temperature to 700˚C with a linear heating rate of approximately 2.2˚C∙min−1. Nitrogen (99.996%) was used as a carrier gas to flush Hg vapor released from the sample through the measurement train at a flow rate of 1 L∙min−1. To verify that the peaks, shown on computer, really belong to Hg release, impingers were changed before every peak release and content was measured to determine retained Hg concentration.
2.3.3. Data Interpretation
To receive correct readings, the pyrolysis unit (Figure 2, (7)) has several different setting modes to choose the most appropriate gas flow rate and heating temperatures according to the type of a given sample. In our case, mode 1, using a gas flow rate of 0.8 - 1.2 L∙min−1 and the atomizer at 680˚C - 740˚C was selected, which suits sample materials such as soils, sediments, ores, coal and minerals. Data are interpreted by the Lumex software as a signal for continuous measurement of the concentration in ng∙m−3 shown on the ordinate axis as a function of time in seconds displayed on the abscissa axis. Due to known heating rate and precise temperature readings, the concentration signal per time was adapted to a concentration signal per degree temperature, ˚C, to observe Hg release on increment of temperature.
2.3.4. Total Hg in Samples
For quantitative determination of Hg in gypsum samples, around 0.5 g of sample was digested in acid solution of HNO3-HClO4 in a ratio of 1:1 (2% v/v) and H2SO4 (5% v/v) in Milli-Q water at 240˚C for 20 minutes. Hg content was then determined by the CV AAS method (Automatic Hg Analyzer Model Hg-201, Sanso Seisakusho Co., LTD). For every sample at least two replicas were prepared and measured. For testing the homogeneity of samples, the same procedure was used for 6 replicas, to check the repeatability of the measured Hg concentration.
2.3.5. Mass Balance
Hg released from the sample during temperature fractionation was trapped into impinger solution (4% W/V KMnO4, 10% v/v H2SO4 in Milli-Q water) placed at the exit of a Lumex detector (Figure 2, (7)). The permanganate solution was sequentially pre-reduced with NH2OH∙HCl to destroy the excess of potassium permanganate. An aliquot of the sample was reduced to Hg(0) with an acid solution of 10% SnCl2 and determined by CV AAS (Automatic Hg Analyzer Model Hg-201, Sanso Seisakusho Co., LTD) [46] . The quantity of Hg released from the sample was used to assess the mass balance, by comparing the amount of Hg contained in solid sample aliquots and the amount trapped in the impingers.
3. Results and Discussion
This section is organized in two parts, in which the first discusses the results of multi-element analysis in gypsum samples from the TPP Šoštanj and the second part the results of thermal fractionation analysis. The results of the latter are divided into two sub-sections the first of which contains results presented as thermograms of different TPP gypsum samples from TPP Šoštanj (FF, FF1, FF2, CF) (Figure 3) and the second, results in thermograms of TPP gypsum samples spiked with pure Hg compounds mixed with CaSO4∙2H2O (Figures 4-7).

 (a) (b)
 (c) (d)
Figure 3. Thermograms of a dry and moist gypsum samples FF (a), CF (b), FF1 (c) and FF2 (d).

 (a) (b)
 (c) (d)
Figure 4. Thermograms of Hg2Cl2 (a), HgCl2 (b), HgBr2 (c) and HgF2 (d) spikes.
3.1. Multi-Element Composition of Gypsum and Lignite Samples
The results for different size fractions of gypsum and for lignite are presented in Table 2. From Table 2 and Figure 8(a) and Figure 8(b), it is evident that the highest concentrations of most elements are found in the finer fractions of gypsum (FF and FF1). In FF2 sample, the ratio of elements is lower, by factor of around 2, than those the finer fractions. This is proportional to the size fraction difference (Figure 1). This is in agreement with earlier reports [6] .
The concentration ratios between finer fractions compared with a coarser fraction (Figure 8(a) and Figure 8(b)) provide an interesting observation on partitioning of elements in the different size fractions. The elements such as Br, Ca, Sr, and Cl (Figure 8(a)) show smaller accumulation in fine fractions, which is due to the fact that the calcium, sulfate, chloride, and bromide represent the major components of the solids in the WFGD system. The largest concentration factors can be observed for aluminum (Figure 8(a)) and europium (Figure 8(b)). Aluminum enters the WFGD with calcite and is known to form colloids in WFGD suspension [6] . The concentration of europium is very low in all fractions especially in CF therefore the ratio is high. Other elements, belonging to different groups in the periodic system with different chemical properties show surprisingly similar concentration factors (30 to 70) indicating similar mechanisms. Prevailing mechanism which is responsible for such course of reactions is most probably the adsorption. As the salts of alkali and earth alkali elements have

 (a) (b)
Figure 5. Thermograms of Hg2SO4 (a) and HgSO4 (b) spikes.

 (a) (b)
Figure 6. Thermograms of HgO-red (a) and HgO-yellow (b) spikes.
solubility several orders of magnitude higher that the salts of the transition elements, the precipitation reactions alone cannot explain these findings.
3.2. Temperature Fractionation Experiments
The results obtained by the temperature fractionation method are shown in two sections, of which the first (section 2.1.) summarizes the results obtained for different size fractions (FF, FF1, FF2 and CF) of TPP gypsum samples. As explained in the experimental section, dried and moist samples were studied and the results are shown in the eight thermograms presented in Figure 3.
In 2.2 are described and discussed the results of temperature fractionation for the fine fraction (FF) only and spiked with ten different pure Hg compounds, previously mixed with CaSO4∙2H2O (Figures 4-7).
3.2.1. Temperature Fractionation of Gypsum Samples
The amount of the sample taken for temperature fractionation varied between 50 to 57 mg. Corresponding Hg content is given in Table 3, which also provides information on Hg recovered in the KMnO4 impingers.
Every sample of a gypsum size fraction was measured at least twice. Mercury recovered in KMnO4 impingers
 (a) (b)
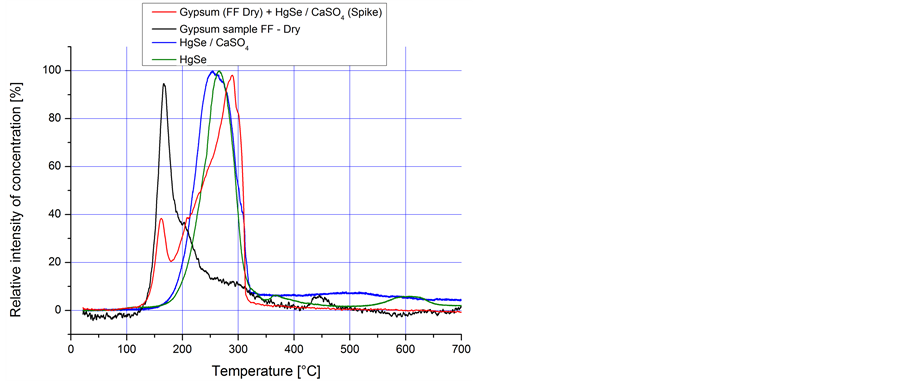
Figure 7. Thermograms of HgS (a) and HgSe (b) spikes.

 (a) (b)
Figure 8. Concentration ratios of different elements in finer fractions (FF, FF1 and FF2) compared to coarse fraction (CF) fraction. Labels at the columns mark a group of element in the periodic table of elements.
ranged between 90% and 120%.
The results of the gypsum samples separated by granulation are shown as thermograms of concentration in ng∙m−3 of released Hg in the carrier gas versus temperature (Figure 3).
Evidently, dry gypsum sample FF (Figure 3(a)) exhibits the most distinctive peaks with a maximum temperature of 160˚C, followed by a smaller peaks at 200˚C, 290˚C and 440˚C. The thermogram of CF does not show any peaks of Hg release (Figure 3(b)) due to low Hg concentration. The intensity of Hg peaks in fine fractions corresponds to the concentrations of Hg in gypsum samples.
A slight difference in the pattern is seen between those for dry and moist FF and FF1 samples (Figure 3(a) and Figure 3(c)). The first peak, at temperature of less than 200˚C, is lower in the moist sample than in the dry one. It seems that humidity affects Hg release from moist samples; it is less likely that the structural changes in
Table 2. Results of multi-element analysis for dried gypsum and lignite samples obtained by k0-INAA (Values marked as “<” fall under the limit of detection).
Table 3. Mercury content in gypsum samples.
moist samples occur during the process of sample drying. In FF2 gypsum sample the Hg release pattern for moist and dry samples is similar (Figure 3(d)).
3.2.2. Gypsum Samples Spiked with Hg Compounds Mixed with CaSO4∙2H2O
Dried fraction (FF) of gypsum was used in all subsequent experiments with spiking. The results are shown as thermograms (Figures 4-7) in order to facilitate and enable qualitative comparison of thermograms. In every figure four thermograms are shown where the black line represents a thermogram of the FF gypsum sample, the red one represents FF sample spiked with a particular Hg compound mixed with pure CaSO4∙2H2O, the blue line represents a thermogram of pure Hg compound mixed with substrate CaSO4∙2H2O, and the green represents a thermogram of pure Hg compound. Thermograms were smoothed to reduce the noise from the measuring equip- ment for easier comparison and clarity. The contents of total Hg in each sample are listed in Table 4, which also provides the information on Hg recovered in KMnO4 impingers. Evidently, the recovery ranged from 70 to 100%. Losses encountered during heating may be related to evaporation loses of Hg(0), instability of some Hg compounds in air, adsorption on colder parts of the instrumentation, as well as analytical errors.
As the main intention of this work was to use thermal fractionation as a tool for identifying Hg compounds present in technical gypsum, the thermogram of the fine gypsum fraction (FF) is presented as a reference in all thermograms.
The thermograms are grouped into four subgroups including Hg halides, sulfates, oxides and HgS and HgSe for easier understanding and interpretation.
Mercury halides
Based on the presence of halogen elements (Cl, Br, F) in the WFGD system (Table 2) we selected Hg2Cl2, HgCl2, HgBr2 and HgF2 as test compounds (Figure 4).
Thermograms for pure Hg chlorides and bromide are identical (Figures 4(a)-(c)), while that for pure HgF2 differs significantly (Figure 4(d)), with several overlapping peaks between 200 and 370˚C and one strong peak at 440˚C [51] .
The reason for similar patterns of thermograms for Hg2Cl2 and HgCl2 lies in Hg(0) and HgCl2 having the same vapor pressure [16] . At higher temperatures, Hg2Cl2 follows a decomposition step, described in Equation (1) where, as a result, two peaks are released (Hg(0) and HgCl2) [34] [52] [53] , emerging at the same temperature due to the same vapor pressure [51] . At the same temperature HgCl2 compound also decomposes, following the decomposition step shown in Equation (2). Because of the similar chemical properties of Hg-Cl compounds, HgBr2 decomposes at the same temperature.
 (1)
(1)
 (2)
(2)
Owing to the HgF2 high boiling and melting points and the reactivity of HF (in the presence of residual moisture) released during thermal decomposition (Equation (3)) [54] , the resulting thermograms show very different patterns. The first peaks can be attributed to the decomposition of the HgF2, while the second peak, at 440˚C, corresponds to HgO decomposition as described later (Figure 4(d)) [51] .
 (3)
(3)
Consistent with the general observation, the thermograms of pure Hg halides and those mixed with CaSO4∙2H2O substrate differ considerably. The released peaks of Hg from Hg2Cl2, HgCl2 and HgBr2 mixed with CaSO4∙2H2O (Figures 4(a)-(c)), appearing at temperatures of around 670˚C, are difficult to explain since no theoretical background exists. We assume that this is caused by the experimental set up in which ionic Hg could have been deposited on the cooler surfaces of the inner wall of the tubing and finally released by high temperature gas flow towards the end of the temperature cycle [51] . This may be confirmed by the good mass balance observed during the experiments (Table 4).
The analyses of thermograms of technical gypsum (FF fraction) spiked with Hg halides show the two typical initial peaks and skewed declining trend up to 400˚C, the exception being a new clear peak at 340˚C for HgF2. The relative intensities of the first two peaks in spiked and non-spiked FF gypsum are most similar for Hg2Cl2, and HgCl2, less so for HgBr2 and much less for HgF2. The Hg halides can be concluded to be present in the gypsum samples with a high degree of certainty, the Hg chlorides predominating. This is in agreement with the relative concentrations of halogens in the WFGD solution [7] [34] [52] [53] .
Mercury sulfates
The thermograms shown in Figure 5 indicate some distinct differences in the decomposition patterns of Hg(I) and Hg(II) sulfates, which was not observed for Hg(I) and Hg(II) chlorides.
Pure Hg(I) sulfate (Figure 5(a)) shows a larger peak at 300˚C and a second at 520˚C, while Hg (II) sulfate (Figure 5(b)) exhibits only one major peak at 540˚C [51] . According to a report [55] this is a result of a multistep decomposition of Hg(I, II) sulfates. Decomposition of Hg2SO4 should follow the following decomposition steps as follows:
 (4)
(4)
 (5)
(5)
 (6)
(6)
The presence of pure CaSO4∙2H2O causes a change in the appearance of the second peak for Hg(I) sulfate. A new peak appeared at 420˚C, while the second peak of pure substance Hg2SO4 almost disappeared. In the case of Hg(II) sulfate mixed with CaSO4∙2H2O a new peak at around 420˚C appeared beside a strong peak with a maximum at about 560˚C. These phenomena can be explained by the change in chemistry induced by the presence of crystalline water in CaSO4∙2H2O.
The thermograms of Hg(I) and Hg(II) sulfates mixed with technical FF gypsum differ significantly (Figure 5(a) and Figure 5(b)). In the case of Hg(I) sulfate, besides the two indicative peaks, two additional peaks ap-
Table 4. Mercury content in spiked gypsum samples.
peared at 260˚C and 340˚C but no peaks above 400˚C. This observation indicates that Hg(I) sulfate is not present in the FF gypsum sample. Hg(II) sulfate, however, shows a number of non-separated peaks in the temperature range from 320 to 500˚C and no peaks above 500˚C. A small peak of the FF gypsum sample (black line) appears within this temperature range (with a maximum at 450˚C) which indicates the possible presence of a small amount of Hg(II) sulfate in the original FF sample. This conclusion is further strengthened by the fact that only Hg(II) sulfate spiked to FF gypsum sample shows the peak within this temperature range.
Mercury oxides
Thermograms of red and yellow Hg oxides are shown in Figure 6(a) and Figure 6(b).
Similar thermograms are observed for pure Hg oxides with maximum temperatures of 460˚C and 420˚C for red and yellow HgO, respectively [51] . Both HgO compounds have an orthorhombic crystalline structure but they differ in particle size [56] . Yellow HgO (Figure 6(b)) consists of smaller particles which may affect the decomposition temperature. A multistep decomposition of HgO is suggested [57] , with the first decomposition step occurring at a temperature of 160˚C - 220˚C, the second at 220˚C - 400˚C and the third decomposition step at 400˚C - 500˚C. This is consistent with the results obtained in this study.
The presence of CaSO4∙2H2O caused the release of Hg at lower temperatures, with an additional, not well separated peak at about 300˚C. The effect of the matrix (substrate) on Hg release from the samples, especially from spiked gypsum samples, where Fe2+ and Mn2+ could play a role of catalysts and in the presence of Cl, could additionally enhance the reactions [7] . Thermograms of spiked FF gypsum exhibit the appearance of a maximum peak at about 350˚C and 300˚C for red and yellow HgO, respectively. This temperature range corresponds to the area of the not well separated skewed region of Hg release from technical FF gypsum sample. This is indicative of the presence of a small amount of HgO in FF gypsum.
Mercury sulfide and selenide
The thermograms presented in Figure 7 show that pure compounds exhibit patterns similar to those of substrates mixed with pure compounds [51] . Major peaks for HgS (Figure 7(a)) appear in the range between 290 and 310˚C, while for HgSe (Figure 7(b)) the maximum peaks appear between 250 and 290˚C [51] . The decomposition temperatures for the two compounds appear in a much narrower range (within 60˚C) than those for other Hg compounds, where Hg appears in much larger temperature ranges. Therefore, we can conclude that HgS and HgSe interact with the constituents of the substrate to a much lesser degree than other tested Hg compounds [51] .
According to published data and without considering the fugacity effect, the decomposition temperature of HgS should be 585˚C. Thus, when all factors are taken into account, a lower decomposition temperature is expected [58] . The single peak observed, is a consequence of a decomposition process of HgS consisting of only one step, which can also be termed a reactive sublimation (Equation (7)) [58] .
 (7)
(7)
It has been assumed by other authors that HgSO3 and HgO compounds could appear as decomposition product of HgS, which is probable when considering the gypsum produced in forced oxidation FGD. However, until now there is no evidence of such a decomposition process (Equations (8)-(10)) [32] also confirmed by our experiments.
 (8)
(8)
 (9)
(9)
 (10)
(10)
The decomposition of pure HgSe follows just one step, according to the single released peak. It is interesting to note, that Hg and Se are among all elements far more enriched in fine fractions of the gypsum compared to lignite (Table 2). The enrichment factors are 110 and 88 for Se and Hg respectively. For other elements, these factors are in the range between 0.3 and 8.8. Both, Se and Hg are volatile, but highly concentrated in fine gypsum fraction, so we assumed the presence of a very stable HgSe in the gypsum. Based on the thermograms presented in Figure 7(b) this assumption could not be confirmed.
Both, HgS and HgSe, appear in the temperature range where the technical gypsum (FF sample, black line) shows a declining skew of Hg release with unclear peaks that cannot clearly be attributed to a specific compound tested.
More detailed analysis of all thermograms reveals that, in all cases except for HgS, those for FF gypsum spiked with different Hg compounds show two initial peaks at 170 ± 10 and 205˚C ± 5˚C. Although the oxidative environment of the WFGD system would prevent the formation of HgS in the scrubber, small amounts of H2S present in the flue gas can produce trace amounts of highly insoluble HgS.
4. Conclusions
The results obtained in this study have confirmed previous findings that Hg is effectively retained in the WFGD system, particularly when bound to the fine fraction of the gypsum. The primary goal of this work was to identify Hg species in the gypsum using temperature fractional procedure. The methodology, however, suffers from nonspecific responses, highly dependent on the substrate in which Hg compounds are present and/or in contact with.
The thermograms of pure Hg compounds and mixtures of pure compounds with CaSO4∙2H2O differ significantly in all cases, except for HgS and HgSe. This indicates that the release of Hg from Hg compounds during heating is importantly influenced by the presence of a substrate due to the chemical reactions occurring during heating. Furthermore, the thermograms of the fine fraction (FF) of technical gypsum spiked with the mixture of pure substance and analytical grade CaSO4∙2H2O, also differ significantly from thermograms of mixtures of pure substance and analytical grade CaSO4∙2H2O. It has to be noted, however, that the technical gypsum is a complex matrix in which Hg can be incorporated in the matrix structure in the form of different compounds and/or adsorbed on the surface of the particles. The methodology based on spiking with pure compounds applied in our work does not fully represent gypsum obtained from TPPs.
Due to the large effect of the substrate on Hg release it is decisive to use an approach based on the addition of a known Hg compound to the substrate. Detailed quantitative and qualitative analysis of Hg compounds and other constituents in gypsum is necessary for the selection of these compounds. To our knowledge the exact identification of Hg compounds in gypsum is still largely unknown. Appropriate reference materials and a reliable analytical method for speciation of Hg compounds at various concentration levels in solid samples are required.
Our results enable us to confirm that, in the gypsum obtained from a WFGD with forced oxidation, Hg halides, in particular chloride, prevail. The method used in our work cannot distinguish between Hg(I) and Hg(II) chloride. It does, however, have the potential to distinguish between Hg(I) and Hg(II) sulfates, though present at much lower levels in gypsum, of which only traces of Hg(II) sulfates were identified in the technical gypsum sample. Traces of other Hg compounds cannot fully be excluded as well.
Although, the method is not sufficiently specific for identification of the Hg species, it has proved very useful to study the temperature stability of Hg in gypsum. This stability can be altered by the addition of various substrates which may either accelerate Hg release or stabilize it. This is of importance in Hg waste characterization including of gypsum containing high Hg concentrations.
For accurate identification of Hg species, more needs to be known about the behavior of Hg compounds at higher temperatures. For accurate determination of Hg compounds present in complex matrices other, complementary, instrumental techniques could be of great help, such as for example mass spectrometry for identification of temperature decomposition fragments.
Highlights
・ Hg in the coal fired TPP is effectively retained in the WFGD with forced oxidation.
・ Fine gypsum fraction contains the majority of Hg and other elements.
・ Identification of the Hg compounds by TF largely depends on the matrix.
・ Hg in the fine gypsum fraction is mostly present as halides, primarily as chloride.
Acknowledgements
This work has been supported by the ARRS program P1-0143, a project J1-4288 and the ARRS young researcher program as well as the program “Young researchers from Industry 2010” partly financed by the European Union, European Social Fund. The authors acknowledge financial support from the state budget by the Slovenian Research Agency. Linguistic corrections of R. Pain are also acknowledged.
Cite this paper
Matej Sedlar,Majda Pavlin,Radojko Jaćimović,Andrej Stergaršek,Peter Frkal,Milena Horvat, (2015) Temperature Fractionation (TF) of Hg Compounds in Gypsum from Wet Flue Gas Desulfurization System of the Coal Fired Thermal Power Plant (TPP). American Journal of Analytical Chemistry,06,939-956. doi: 10.4236/ajac.2015.612090
References
- 1. UNEP Division of Technology, Industry and Economics, Chemicals Branch International Environment House (2013) Global Mercury Assessment 2013: Sources, Emissions, Releases and Environmental Transport.
http://www.unep.org/PDF/PressReleases/GlobalMercuryAssessment2013.pdf - 2. (2013) UNEP Conference of Plenipotentiaries on the Minamata Convention on Mercury, Kumamoto, Japan, 10 and 11 October 2013. Text of the Minamata Convention on Mercury for Adoption by the Conference of Plenipotentiaries.
- 3. Galbreath, K.C. and Zygarlicke, C.J. (2000) Mercury Transformations in Coal Combustion Flue Gas. Fuel ProcessingTechnology, 65-66, 289-310.
http://dx.doi.org/10.1016/S0378-3820(99)00102-2 - 4. Pavlish, J.H., Sondreal, E.A., Mann, M.D., Olson, E.S., Galbreath, K.C., Laudal, D.L., et al. (2003) Status Review of Mercury Control Options for Coal-Fired Power Plants. Fuel Processing Technology, 82, 89-165.
http://dx.doi.org/10.1016/S0378-3820(03)00059-6 - 5. Niksa, S. and Fujiwara, N. (2005) Predicting Extents of Mercury Oxidation in Coal-Derived Flue Gases. Journal of the Air & Waste Management Association, 55, 930-939.
http://dx.doi.org/10.1080/10473289.2005.10464688 - 6. Stergarsek, A., Horvat, M., Kotnik, J., Tratnik, J., Frkal, P., Kocman, D., et al. (2008) The Role of Flue Gas Desulphurisation in Mercury Speciation and Distribution in a Lignite Burning Power Plant. Fuel, 87, 3504-3512.
http://dx.doi.org/10.1016/j.fuel.2008.06.003 - 7. Stergarsek, A., Horvat, M., Frkal, P. and Stergarsek, J. (2010) Removal of Hg-0 from Flue Gases in Wet FGD by Catalytic Oxidation with Air—An Experimental Study. Fuel, 89, 3167-3177.
http://dx.doi.org/10.1016/j.fuel.2010.04.006 - 8. Stergarsek, A., Horvat, M., Frkal, P., Guevara, S.R. and Kocjancic, R. (2013) Removal of Hg-0 in Wet FGD by Catalytic Oxidation with Air—A Contribution to the Development of a Process Chemical Model. Fuel, 107, 183-191.
http://dx.doi.org/10.1016/j.fuel.2012.08.001 - 9. Pudasainee, D., Kim, J.H., Yoon, Y.S. and Seo, Y.C. (2012) Oxidation, Reemission and Mass Distribution of Mercury in Bituminous Coal-Fired Power Plants with SCR, CS-ESP and Wet FGD. Fuel, 93, 312-318.
http://dx.doi.org/10.1016/j.fuel.2011.10.012 - 10. Yan, R., Gauthier, D. and Flamant, G. (2000) Possible Interactions between As, Se, and Hg during Coal Combustion. Combustion and Flame, 120, 49-60.
http://dx.doi.org/10.1016/S0010-2180(99)00079-6 - 11. Yudovich, Y.E. and Ketris, M.P. (2005) Mercury in Coal: A Review Part 2. Coal Use and Environmental Problems. International Journal of Coal Geology, 62, 135-165.
http://dx.doi.org/10.1016/j.coal.2004.11.003 - 12. Ito, S., Yokoyama, T. and Asakura, K. (2006) Emissions of Mercury and Other Trace Elements from Coal-Fired Power Plants in Japan. Science of the Total Environment, 368, 397-402.
http://dx.doi.org/10.1016/j.scitotenv.2005.09.044 - 13. Meij, R. and TeWinkel, B. (2004) The Emissions and Environmental Impact of PM10 and Trace Elements from a Modern Coal-Fired Power Plant Equipped with ESP and Wet FGD. Fuel Processing Technology, 85, 641-656.
http://dx.doi.org/10.1016/j.fuproc.2003.11.012 - 14. Ochoa-González, R., Díaz-Somoano, M. and Mar-tínez-Tarazona, M.R. (2013) Effect of Anion Concentrations on Hg2+ Reduction from Simulated Desulphurization Aqueous Solutions. Chemical Engineering Journal, 214, 165-171.
http://dx.doi.org/10.1016/j.cej.2012.09.037 - 15. Tang, T., Xu, J., Lu, R., Wo, J. and Xu, X. (2010) En-hanced Hg2+ Removal and Hg0 Re-Emission Control from Wet Fuel Gas Desulfurization Liquors with Additives. Fuel, 89, 3613-3617.
http://dx.doi.org/10.1016/j.fuel.2010.07.045 - 16. Wu, C.L., Cao, Y., He, C.C., Dong, Z.B. and Pan, W.P. (2010) Study of Elemental Mercury Re-Emission through a Lab-Scale Simulated Scrubber. Fuel, 89, 2072-2080.
http://dx.doi.org/10.1016/j.fuel.2009.11.045 - 17. Ochoa-González, R., Díaz-Somoano, M. and Martínez-Tarazona, M.R. (2013) Control of Hg0 Re-Emission from Gypsum Slurries by Means of Additives in Typical Wet Scrubber Conditions. Fuel, 105, 112-118.
http://dx.doi.org/10.1016/j.fuel.2012.05.044 - 18. Milobowski, M.G., Amrhein, G.T., Kudlac, G.A. and Yurchison, D.M. (2001) Wet FGD Enhanced Mercury Control for Coal-Fired Utility Boilers. Proceedings of the US EPA/DOE/EPRI Combined Power Plant Air. Pollutant Control Symposium: The Mega Symposium, Chicago, 20-23 August 2001.
- 19. Beatty, W.L., Schroeder, K. and Beatty, C.L.K. (2012) Mineralogical Associations of Mercury in FGD Products. Energy Fuels, 26, 3399-3406.
http://dx.doi.org/10.1021/ef300033u - 20. Liu, X., Wang, S., Zhang, L., Wu, Y., Duan, L. and Hao, J. (2013) Speciation of Mercury in FGD Gypsum and Mercury Emission during the Wallboard Production in China. Fuel, 111, 621-627.
http://dx.doi.org/10.1016/j.fuel.2013.03.052 - 21. Heebink, L.V. and Hassett, D.J. (2005) Mercury Release from FGD. Fuel, 84, 1372-1377.
http://dx.doi.org/10.1016/j.fuel.2004.06.040 - 22. Biester, H. and Scholz, C. (1996) Determination of Mercury Binding Forms in Contaminated Soils: Mercury Pyrolysis versus Sequential Extractions. Environmental Science & Technology, 31, 233-239.
http://dx.doi.org/10.1021/es960369h - 23. Issaro, N., Abi-Ghanem, C. and Bermond, A. (2009) Fractionation Studies of Mercury in Soils and Sediments: A Review of the Chemical Reagents Used for Mercury Extraction. Analytica Chimica Acta, 631, 1-12.
http://dx.doi.org/10.1016/j.aca.2008.10.020 - 24. Do Valle, C.M., Santana, G.P. and Windmoller, C.C. (2006) Mercury Conversion Processes in Amazon Soils Evaluated by Thermodesorption Analysis. Chemosphere, 65, 1966-1975.
http://dx.doi.org/10.1016/j.chemosphere.2006.07.001 - 25. Windmoller, C.C., Wilken, R.D. and Jardim, W.D. (1996) Mercury Speciation in Contaminated Soils by Thermal Release Analysis. Water, Air, & Soil Pollution, 89, 399-416.
http://dx.doi.org/10.1007/BF00171644 - 26. Rumayor, M., Diaz-Somoano, M., Lopez-Anton, M.A. and Martinez-Tarazona, M.R. (2013) Mercury Compounds Characterization by Thermal Desorption. Talanta, 114, 318-322.
http://dx.doi.org/10.1016/j.talanta.2013.05.059 - 27. Navarro, A., Canadas, I., Martinez, D., Rodriguez, J. and Mendoza, J.L. (2009) Application of Solar Thermal Desorption to Remediation of Mercury-Contaminated Soils. Solar Energy, 89, 1405-1414.
http://dx.doi.org/10.1016/j.solener.2009.03.013 - 28. Coufalík, P., Zvěrina, O. and Komárek, J. (2014) Determination of Mercury Species Using Thermal Desorption Analysis in AAS. Chemical Papers, 68, 427-434.
http://dx.doi.org/10.2478/s11696-013-0471-0 - 29. Coufalík, P., Krásensky, P., Dosbaba, M. and Komárek, J. (2012) Sequential Extraction and Thermal Desorption of Mercury from Contaminated Soil and Tailings from Mongolia. Central European Journal of Chemistry, 10, 1565-1573.
http://dx.doi.org/10.2478/s11532-012-0074-6 - 30. Rallo, M., Lopez-Anton, M.A., Perry, R. and Maroto-Valer, M.M. (2010) Mercury Speciation in Gypsums Produced from Flue Gas Desulfurization by Temperature Programmed Decomposition. Fuel, 89, 2157-2159.
http://dx.doi.org/10.1016/j.fuel.2010.03.037 - 31. Murakami, A., Uddin, M.A., Ochiai, R., Sasaoka, E. and Wu, S. (2010) Study of the Mercury Sorption Mechanism on Activated Carbon in Coal Combustion Flue Gas by the Temperature-Programmed Decomposition Desorption Technique. Energy & Fuels, 24, 4241-4249.
http://dx.doi.org/10.1021/ef100288f - 32. Wu, S., Uddin, M.A., Nagano, S., Ozaki, M. and Sasaoka, E. (2011) Fundamental Study on Decomposition Characteristics of Mercury Compounds over Solid Powder by Temperature-Programmed Decomposition Desorption Mass Spectrometry. Energy & Fuels, 25, 144-153.
http://dx.doi.org/10.1021/ef1009499 - 33. Raposo, C., Windmoller, C.C. and Durao Jr., W.A. (2003) Mercury Speciation in Fluorescent Lamps by Thermal Release Analysis. Waste Management, 23, 879-886.
http://dx.doi.org/10.1016/S0956-053X(03)00089-8 - 34. Lopez-Anton, M.A., Yuan, Y., Perry, R. and Maro-to-Valer, M.M. (2010) Analysis of Mercury Species Present during Coal Combustion by Thermal Desorption. Fuel, 89, 629-634.
http://dx.doi.org/10.1016/j.fuel.2009.08.034 - 35. Luo, G., Yao, H., Xu, M., Gupta, R. and Xu, Z. (2011) Identifying Modes of Occurrence of Mercury in Coal by Temperature Programmed Pyrolysis. Proceedings of the Combustion Institute, 33, 2763-2769.
http://dx.doi.org/10.1016/j.proci.2010.06.108 - 36. Shuvaeva, O.V., Gustaytis, M.A. and Anoshin, G.N. (2008) Mercury Speciation in Environmental Solid Samples Using Thermal Release Technique with Atomic Absorption Detection. Analytica Chimica Acta, 621, 148-154.
http://dx.doi.org/10.1016/j.aca.2008.05.034 - 37. Biester, H., Müller, G. and Scholer, H.F. (2002) Binding and Mobility of Mercury in Soils Contaminated by Emissions from Chlor-Alkali Plants. Science of the Total Environment, 284, 191-203.
http://dx.doi.org/10.1016/S0048-9697(01)00885-3 - 38. Bollen, A., Wenke, A. and Biester, H. (2008) Mercury Speciation Analyses in HgCl2-Contaminated Soils and Groundwater—Implications for Risk Assessment and Remediation Strategies. Water Research, 42, 91-100.
http://dx.doi.org/10.1016/j.watres.2007.07.011 - 39. Biester, H., Gosar, M. and Müller, G. (1999) Mercury Speciation in Tailings of the Idrija Mercury Mine. Journal of Geochemical Exploration, 65, 195-204.
http://dx.doi.org/10.1016/S0375-6742(99)00027-8 - 40. Ochoa-Gonzalez, R., Diaz-Somoano, M. and Martinez-Tarazona, M.R. (2013) Influence of Limestone Characteristics on Mercury Re-Emission in WFGD Systems. Environmental Science & Technology, 47, 2974-2981.
http://dx.doi.org/10.1021/es304090e - 41. Kairies, C., Schroeder, K. and Cardone, C. (2006) Mercury in Gypsum Produced from Flue Gas Desulfurization. Fuel, 85, 2530-2536.
http://dx.doi.org/10.1016/j.fuel.2006.04.027 - 42. Cornell, R.M. and Schwertmann, U. (2003) The Iron Oxides: Structure, Properties, Reactions, Occurrences and Uses. 2nd Edition, Wiley-VCH, Weinheim.
http://dx.doi.org/10.1002/3527602097 - 43. Kim, C.S., Rytuba, J.J. and Brown, G.E. (2004) EXAFS Study of Mercury(II) Sorption to Fe- and Al-(Hydr)oxides. Journal of Colloid and Interface Science, 270, 9-20.
http://dx.doi.org/10.1016/j.jcis.2003.07.029 - 44. Evans, M.A. and Elmore, R.D. (2006) Fluid Control of Localized Mineral Domains in Limestone Pressure Solution Structures. Journal of Structural Geology, 28, 284-301.
http://dx.doi.org/10.1016/j.jsg.2005.10.004 - 45. Kotnik, J., Horvat, M., Mandic, V. and Logar, M. (2000) Influence of the Sodsanj Coal-Fired Thermal Power Plant on Mercury and Methyl Mercury Concentrations in Lake Velenje, Slovenia. Science of the Total Environment, 259, 85-95.
http://dx.doi.org/10.1016/S0048-9697(00)00576-3 - 46. Akagi, H. and Nishimura, H. (1991) Speciation of Mercury in the Environment. In: Suzuki, T., Imura, N. and Clarkson, T.W., Eds., Advances in Mercury Toxicology, Plenum Press, New York, 53-76.
http://dx.doi.org/10.1007/978-1-4757-9071-9_3 - 47. Jacimovic, R., Smodis, B., Bucar, T. and Stegnar, P. (2003) K0-NAA Quality Assessment by Analysis of Different Certified Reference Materials Using the KAYZERO/SOLCOI Software. Journal of Radioanalytical and Nuclear Chemistry, 257, 659-663.
http://dx.doi.org/10.1023/A:1026116916580 - 48. Smodis, B., Jacimovic, R., Medin, G. and Jovanovic, S. (1993) Instrumental Neutron Activation Analysis of Sediment Reference Materials Using the K0-Standardisation Method. Journal of Radioanalytical and Nuclear Chemistry, 169, 177-185.
http://dx.doi.org/10.1007/BF02046792 - 49. Kayzero for Windows (KayWin®), User’s Manual for Reactor Neutron Activation Analysis (NAA) Using the K0 Standardization Method, Version 2, November 2005.
- 50. Sholupov, S., Pogarev, S., Ryzhov, V., Mashyanov, N. and Stroganov, A. (2004) Zeeman Atomic Absorption Spectrometer RA-915+ for Direct Determination of Mercury in Air and Complex Matrix Samples. Fuel Processing Technology, 85, 473-485.
http://dx.doi.org/10.1016/j.fuproc.2003.11.003 - 51. Sedlar, M., Pavlin, M., Popovic, A. and Horvat, M. (2015) Temperature Stability of Mercury Compounds in Solid Substrates. Open Chemistry, 13, 404-419.
- 52. Acuna-Caro, C., Brechtel, K., Scheffknecht, G. and Braß, M. (2009) The Effect of Chlorine and Oxygen Concentrations on the Removal of Mercury at an FGD-Batch Reactor. Fuel, 88, 2489-2494.
http://dx.doi.org/10.1016/j.fuel.2008.11.028 - 53. Blythe, G., DeBerry, D., Marsh, B., Paradis, J., Range, J. and Rhudy, R. (2004) Bench-Scale Evaluation of the Fate of Mercury in Wet FGD Systems. Proceedings of the Air and Waste Management Association’s Combined Power Plant Air Pollution Control Mega Symposium, Washington DC, 30 August-2 September 2004, Paper No. 59.
- 54. Guminski, C. (2001) The F-Hg System (Fluorine-Mercury). Journal of Phase Equilibria, 22, 578-581.
http://dx.doi.org/10.1007/s11669-001-0084-0 - 55. Tariq, S.A. and Hill, J.O. (1981) Thermal Analysis of Mercury(I) Sulfate and Mercury(II) Sulphate. Journal of Thermal Analysis, 21, 277-281.
http://dx.doi.org/10.1007/BF01914211 - 56. Wendlandt, W.W. (1974) Thermal Properties of Inorganic Compounds. Hg(I) Hg(II) Compounds. Thermochimica Acta, 10, 101-107.
http://dx.doi.org/10.1016/0040-6031(74)85028-8 - 57. L’vov, B.V. (1999) Kinetics and Mechanisms of Thermal Decomposition of Mercuric Oxide. Thermochimica Acta, 333, 21-26.
http://dx.doi.org/10.1016/S0040-6031(99)00086-6 - 58. Leckey, J.H. and Nulf, L.E. (1994) Thermal Decomposition of Mercuric Sulfide. Chemistry and Chemical Engineering Department—Development Organization. Oak Ridge Y-12 Plant. Martin Marietta Energy Systems, Inc., US Department of Energy, Tennessee.
http://dx.doi.org/10.2172/41313
NOTES

*Corresponding author.