American Journal of Analytical Chemistry
Vol. 4 No. 2 (2013) , Article ID: 28193 , 5 pages DOI:10.4236/ajac.2013.42013
Prediction of Concentration of Animal Fat in Mixture with Vegetable Oil by Multivariate Calibration Associated with Spectrofluorimetry
1Instituto de Educação, Ciência e Tecnologia da Bahia, Campus de Simões Filho, Simões Filho, Brasil
2Instituto de Química, Universidade Federal da Bahia, Campus de Ondina, Salvador, Brasil
Email: *marilenameira@gmail.com
Received December 1, 2012; revised January 2, 2013; accepted January 9, 2013
Keywords: Biodiesel; Vegetable Oil; Animal Fat; Spectrofluorimetry; PLS
ABSTRACT
Total spectrofluorimetry associated with Principal Component Analysis (PCA) was used to discriminate samples of vegetable oil and animal fat. In addition, a multivariate calibration model was developed that combines spectroflurimetry with Partial Least Squares (PLS) for prediction of concentration of animal fat in mixture with vegetable oil. The multivariate calibration model had an R2 value of 0.98098, which indicates the accuracy of the model. This method has potential application in the control of quality of raw material for production of biodiesel. The control of the concentration of animal fat is important because animal fat is more susceptible to oxidation than vegetable oil. Furthermore, high concentrations of animal fats may increase electricity costs for biodiesel production due to the high melting points of saturated fats that solidify at room temperature and cause the fouling and clogging of pipes.
1. Introduction
The quality of raw material used is critical to the quality of industrially produced biodiesel [1], mainly in terms of the yield and the production cost, as raw material contributes 70% - 95% of the total cost. To assess biodiesel quality, one of the parameters generally measured is the degree of oxidation. Susceptibility of oils and fats to oxidation is related to the saturation level of the fatty acid carbon chains. The more unsaturated the chain, the more susceptible it is to oxidation, which is a free radical chain reaction that is accelerated by heat and the presence of metals. Oxidation affects the color, flavor and nutritional quality of edible oils. In fuel, oxidation mainly causes changes in acidity and greater viscosity due to the formation of insoluble gums [2] that make the fuel unsuitable for vehicular use [3]. Due to the nearly complete absence of antioxidants, animal fats [4] are more susceptible to oxidation than vegetable oils, although beef fat possesses a high concentration of saturated fats while monounsaturated and polyunsaturated fatty acids predominate in vegetable oils. In addition to the problems associated with low oxidation stability, the use of high concentrations of animal fats may increase electricity costs for biodiesel production due to the high melting points of saturated fats that solidify at room temperature and cause the fouling and clogging of pipes.
The combination of spectrofluorimetry and multivariate analysis has been cited as a method to differentiate between various samples. By combining spectrofluorimetry with Principal Component Analysis (PCA) and Partial Least Squares (PLS), it is possible to evaluate the deterioration of frying oil and its contents of anisidine, oligomers, iodine and vitamin E [5]. The use of synchronous fluorescence spectroscopy combined with chemometrics allowed for the distinction of various vegetable oils [6]. It was also possible to measure the oxidative alterations of foods via synchronous fluorescence spectroscopy combined with PCA and PLS [7].
The growing need for statistical techniques is currently being driven by technological developments that generate large quantities of information. Chemometrics is a type of multivariate analysis that involves methods and techniques that enable the simultaneous use of all variables in the interpretation of data resulting from chemical analyses. Chemometrics is currently an important tool applied in various technological areas, including food, pharmaceutical, agricultural, environmental and industrial chemistry analyses. It is applied for determination of both chemical and physical properties. Chemometrics also permits data reduction without the loss of relevant information.
There are several multivariate analysis methods for diverse purposes. In this work PCA and PLS were used. PCA enables an enhanced statistical vision of the data set through the reduction of the number of variables to a few principal components that are responsible for explaining a high proportion of the total variation associated with the original set. This method allows for the observation of the interrelationship among the samples, i.e., how they are similar based on the variables used in the study. PCA provides appropriate tools for identifying the most important variables in the principal components space. The pretreatment most commonly used is the Z transformation, which transforms the measurements of each variable such that the population of data has a mean of zero and a variance of one.
In the case of process calibration, this may be accomplished using all instrumental information or variable selection methods. In general, the performance of multivariate calibration is significantly improved through selection of the variables. The technique that establishes a mathematical relationship between one dependent variable and one independent variable is called univariate calibration. When the relationship involves more than one variable, it is called a multivariate calibration. In fact, using the PLS multivariate calibration technique, it is possible to find a mathematical relationship between one of the variables (the dependent variable) and the rest of the variables that describe the system (independent variables). After finding the mathematical relationship, PLS is used to predict values for the dependent variable when the independent variables are known; therefore, it can be used to predict analytical results. Because the principal components have the advantage of being treated completely independently, they can be used to make a multiple linear regression.
In a previous study, a sensor device and method were developed to monitor the quality of fuel acquisition processes using 3D total spectrofluorimetry and PCA [8]. The present study proposes a simple, efficient, rapid and low-cost analysis method for quantification of animal fat in vegetable oil. This method has potential applications for quality control in the food, cosmetics and pharmaceutical industries, as well as for the characterization of raw materials used for biodiesel production.
The proposed method consists of comparing the spectrum of an unknown mixture of fats in vegetable oil with the spectra of previously analyzed standards by applying one multivariate calibration techniques, such as PLS.
2. Experimental Section
2.1. Extraction of Animal Fat
Bovine animal fat samples were acquired at the local market. Adipose tissues were cut into strips with dimensions of approximately 1 cm × 0.5 cm × 0.3 cm and subjected to heating with heptane at 98˚C for 2 hours. After this period, the solvent was evaporated, leaving the solid fat.
2.2. Vegetable Oils
The commercial vegetable oil samples used are shown in Table 1.
2.3. Preparation of the Samples
Vegetable oil and animal fat samples were analyzed by total spectrofluorimetry with no prior pretreatment, thus using the natural fluorescence of the fluids. Dry fat or oil was diluted in 4% heptane (w/v) for differentiation between these lipids.
Solutions of animal fat in soybean oil were prepared in the concentration range of 0% - 40% (w/v). At concentrations exceeding this range, the fat did not completely dissolve in the oil. The animal fat was weighed, subjected to gentle heating in a water bath and dissolved in soybean oil (Perdigão®) after melting. Solutions prepared to construct the PLS model are shown in Table 2.
2.4. Spectrofluorimetry
A Perkin Elmer-LS55 spectrofluorometer equipped with a 150 W Xenon lamp and 1-cm quartz cuvettes was used. The fluorescence emission spectra of the samples were obtained by detecting the emission at 0.5-nm intervals while the sample was subjected to excitation wavelengths in the fixed range of 200 - 775 nm with an increment of 25 nm totaling 24 excitation wavelengths and 1142 emission wavelengths. The readings were obtained with a slit of 2.5 nm and a scan rate of 1200 nm/min. Spectrofluorometric maps were generated using Origin8.0®.
Table 1. Vegetable oil samples.

Table 2. Mixture of animal fat in vegetable oil (0% - 40% w/v).

2.5. Principal Component Analysis (PCA)
In the PCA for discriminate animal fat from vegetable oils (Figures 1-3), seven vegetable oil samples were used, including one of soybean oil, two of sunflower oil, one of canola oil, two of corn oil, one of castor oil and 12 bovine animal fat samples, totaling 19 data matrices.
Dry fat or oil was diluted in 4% heptane (w/v) and analyzed by total spectrofluorimetry. The spectra were arranged in a cube with dimensions of 19 (samples) × 1142 (emission wavelengths) × 24 (excitation wavelengths). Next, using the unfoldm command in Matlab, these data were reorganized into a general matrix measuring 19 × 27,408. This array was processed by the mean-centering method and then subjected to multivariate analysis using PCA with MatLab 6.1®.
In constructing the PCA for mixtures of animal fat in vegetable oil (Figures 4-6), 10 spectra of this mixtures were used in the concentration range of 0% - 40% (w/v) (Table 2). The spectra were arranged in a cube with dimensions of 10 (samples) × 1142 (emission wavelengths) × 24 (excitation wavelengths). These data were reorganized into a general matrix measuring 10 × 27,408 that was processed by the mean-centering method and then subjected to multivariate analysis using PCA with MatLab 6.1®.
2.6. Construction of the PLS Model
In constructing the PLS model for mixtures of animal fat in vegetable oil ten solutions were used in the concentration range of 0% - 40% (w/v) (Table 2). The PLS model used only the region of the excitation spectrum in the range of 200 - 425 nm with an increment of 25 nm and emission in the 230 - 800 nm interval with an increment of 0.5 nm. The spectra were arranged in a cube measuring 10 (samples) × 1142 (emission wavelengths) × 10 (excitation wavelengths) and then rearranged into a general
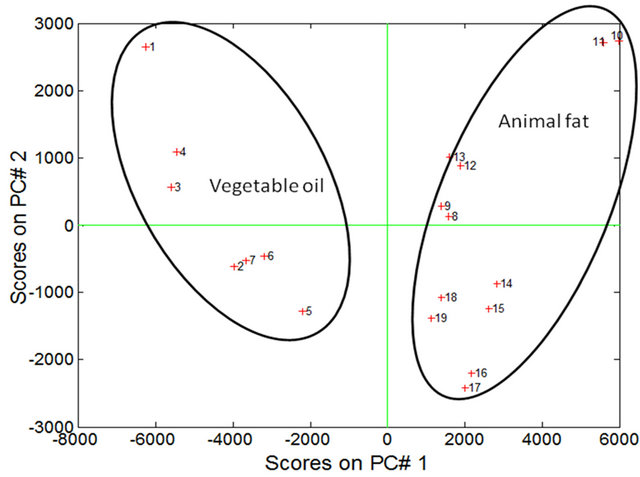
Figure 1. Scores of PC1 versus PC2 for soybean oil samples (4% in heptane) and animal fat.
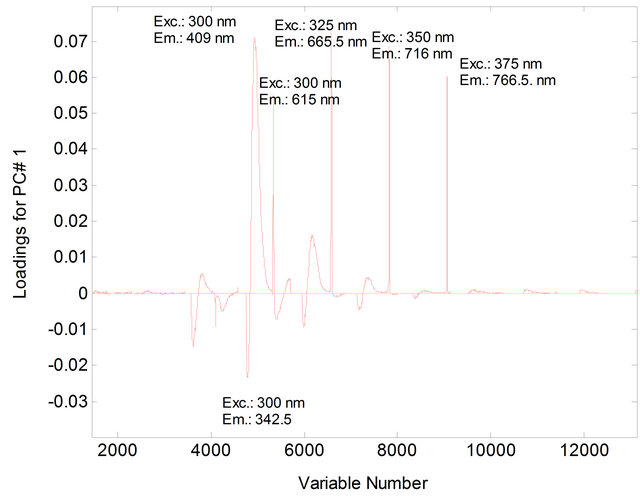
Figure 2. Loading for PC1 for soybean oil samples (4% in heptane) and animal fat (4% in heptane).
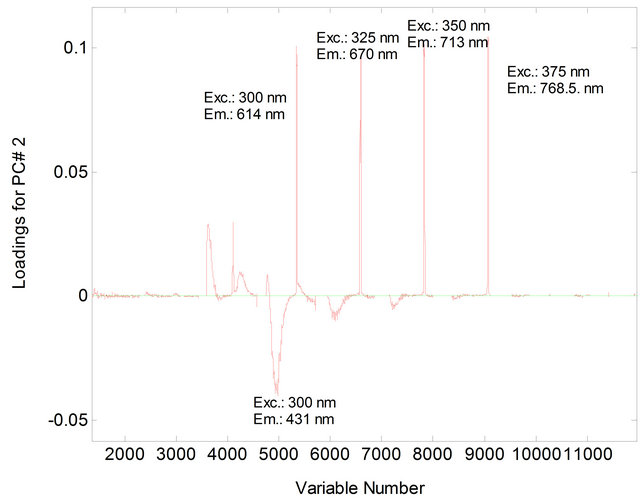
Figure 3. Loading for PC2 for soybean oil samples (4% in heptane) and animal fat (4% in heptane).
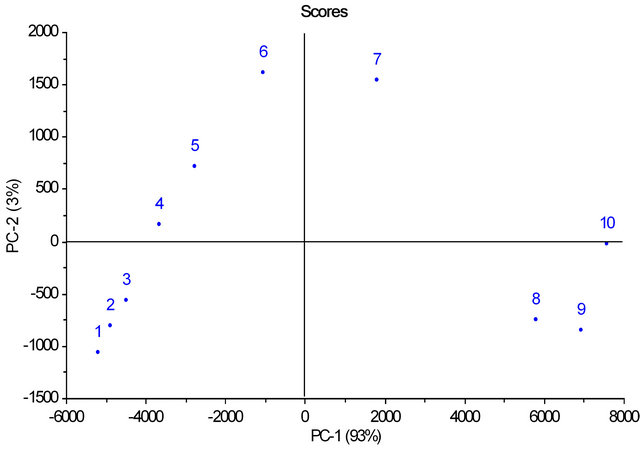
Figure 4. Scores of PC1 versus PC2 for mixtures of animal fat (0% - 40%) in soybean oil.
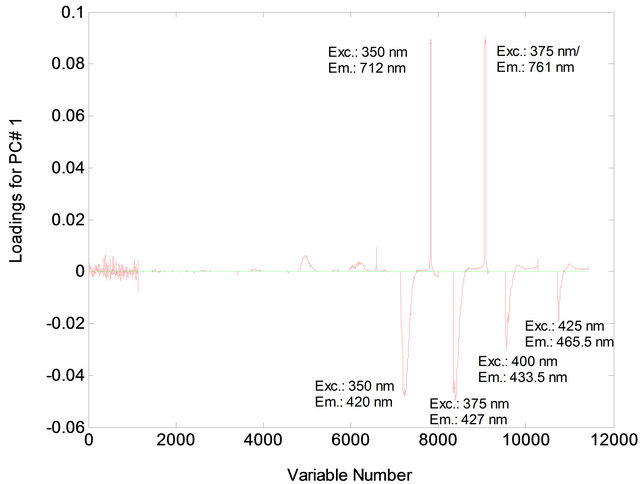
Figure 5. Loading for PC1 for mixtures of animal fat (0% - 40%) in soybean oil.
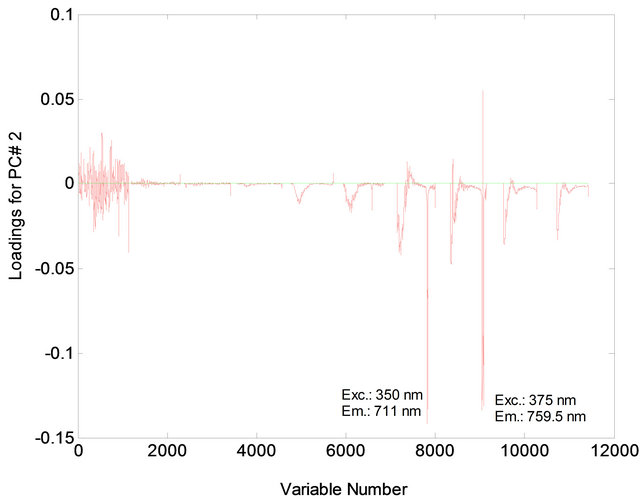
Figure 6. Loading for PC2 for mixtures of animal fat (0% - 40%) in soybean oil.
matrix measuring 10 × 11,420 that was exported to unscrambler and then subjected to multivariate calibration by PLS where the fluorescence spectra were used as the independent variables and the concentrations of the mixtures of animal fat in vegetable oil in the range of 0% - 40% (m/v) as the dependent variables.
3. Results and Discussion
3.1. PCA for Discriminating Animal Fat from Vegetable Oil
The PCA showed that the first two principal components, PC1 and PC2, explained 81.02% of the variance in the data: 68.86% for PC1 and 12.16% for PC2. The samples were separated into two distinct regions according to their chemical composition of vegetable oils and animal fats (Figure 1). In PC1, the animal fat samples have positive scores and the vegetable oil samples have negative scores. Discrimination between these samples can be attributed to the differences in the chemical composition of the fluorophores between vegetable oils and animal fats. In PC2, both the positive and negative axes, the analysis discriminated the vegetable oil samples from the animal fat samples. The conditions that most influenced determination of PC1 and PC2 corresponded to excitation wavelengths of 300 nm, 325 nm, 350 nm and 375 nm (Figures 2 and 3).
3.2. PCA Constructed with Spectra of Mixtures of Animal Fats in Vegetable Oil at Concentrations of 0% - 40% (m/v)
PCA obtained with spectra of mixtures of animal fats in vegetable oil at concentrations of 0% - 40% (m/v) showed that the first two principal components, PC1 and PC2, explained 96% of the variance in the data being 93% for PC1 and 3% for PC2. The PCA shows that the samples were separated according to the concentration of animal fat in vegetable oil (Figure 4).
Figures 5 and 6 indicate the excitation and emission wavelength values that most contributed to the separation of the two sample types.
3.3. Prediction of Concentration of Animal Fat in Mixture with Vegetable Oil by PLS
Figure 7 compares the predicted value versus reference values for the PLS model constructed using the fluorescence spectra as the independent variables and the concentrations of the mixtures of animal fat in vegetable oil in the range of 0% - 40% (m/v) as the dependent variables. In the PLS model, the points are distributed around the bisecting line, showing that there is no systematic error in the concentration predictions. The regression coefficient and R2 value near 1 for the curve shown indicate that the calibration model is efficient in making predictions. Thus, it was possible to propose a new method-
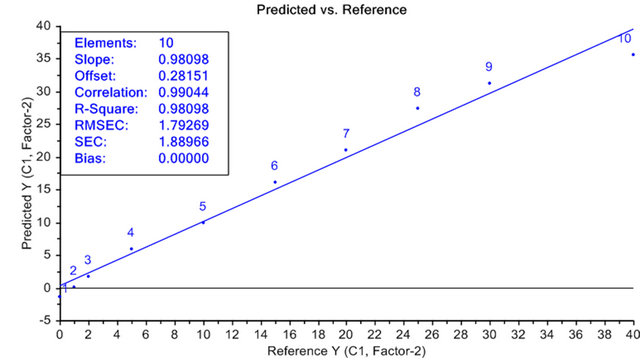
Figure 7. PLS model for mixtures of animal fat (0% - 40%) in soybean oil.
ology for determining the amount of animal fat in vegetable oil by combining spectrofluorimetry with PLS.
4. Conclusions
Using total fluorescence spectroscopy combined with PCA, it was possible to differentiate animal fats from vegetable oils. It was also possible to build a PLS model to predict the concentration of animal fat in mixture with vegetable oil. The described method is simple, rapid, efficient and low-cost once the appropriate excitation and emission wavelengths have been determined.
The correlation coefficient and R2 value of the curve near 1 indicate that the calibration model is efficient in making predictions and show the potential of the spectrofluorimetry technique coupled with chemometrics for predicting concentrations of animal fat in vegetable oil.
5. Acknowledgements
The authors thank CNPq, FAPESB and CAPES for the scholarships and financial support of this study. They also thank Quimis for their partnership. CMQ thanks CNPq for their support through a senior researcher scholarship. MM thanks CAPES for their support through a postdoctoral scholarship.
REFERENCES
- C. M. Quintella, L. S. G. Teixera, M. G. A. Korn, P. R. C. Neto, E. A. Torres, M. P. Castro and C. A. C. Jesus, “Cadeia do Biodiesel da Bancada à Indústria: Uma Visão Geral Com Prospecção de Tarefas e Oportunidades Para P&D&I,” Química Nova, Vol. 32, No. 3, 2009, pp. 793- 808. doi:10.1590/S0100-40422009000300022
- A. Monyem and J. H. Van Gerpen, “The Effect of Biodiesel Oxidation on Engine Performance and Emissions,” Biomass & Bioenergy, Vol. 20, No. 4, 2001, pp. 317-325. doi:10.1016/S0961-9534(00)00095-7
- A. Monyem, J. H. Van Gerpen and M. Canakci, “The Effect of Timing and Oxidation on Emissions from Biodiesel-Fueled Engines,” Transactions of the ASABE, Vol. 44, No. 1, 2001, pp. 35-42.
- E. Sendzikiene, V. Makareviciene and P. Janulis, “Oxidation Stability of Biodiesel Fuel Produced from Fatty Wastes,” Polish Journal of Environmental Studies, Vol. 14, No. 3, 2005, pp. 335-339.
- S. B. Engelsen, “Explorative Spectrometric Evaluations of Frying Oil Deterioration,” Journal of the American Oil Chemists’ Society, Vol. 74, No. 12, 1997, pp. 1495-1508. doi:10.1007/s11746-997-0068-2
- E. Sikorska, T. Gorecki, I. V. Khmelinskii, M. Sikorski and J. Koziol, “Classification of Edible Oils Using Synchronous Scanning Fluorescence Spectroscopy,” Food Chemistry, Vol. 89, No. 2, 2005, pp. 217-225. doi:10.1016/j.foodchem.2004.02.028
- P. N. Jensen, J. Christensen and S. B. Engelsen, “Oxidative Changes in Pork Scratchings, Peanuts, Oatmeal and Muesli Viewed by Fluorescence, Near-Infrared and Infrared Spectroscopy,” European Food Research and Technology, Vol. 219, No. 3, 2004, 294-304. doi:10.1007/s00217-004-0954-x
- C. M. Quintella, A. K. Guimarães and A. P. Musse, “Patente tipo PI Nacional em fase de sigilo, PI00002208073 0742-1,” 2009.
NOTES
*Corresponding author.