American Journal of Analytical Chemistry
Vol. 3 No. 8 (2012) , Article ID: 21902 , 10 pages DOI:10.4236/ajac.2012.38070
Evaluation of a Dry Extract System Involving NIR Spectroscopy (DESIR) for Rapid Assessment of Pesticide Contamination of Fruit Surfaces
Central Queensland University, Institute for Resource Industries and Sustainability, Plant Science Group, Rockhampton, Australia
Email: k.walsh@cqu.edu.au
Received December 6, 2011; revised February 9, 2012; accepted February 22, 2012
Keywords: Apple; Mango; Tomato; Fungicide; Insecticide; Aero; Metiram; Pyraclostrobin; Octave; Prochloraz; Penncozeb; Mancozeb; Amistar; Azoxystrobin; Applaud; Buprofezin; Lorsban; Chlorpyrifos; Near Infrared; Pesticide
ABSTRACT
The dry-extract system for (near) infrared (DESIR) technique was implemented using reflectance near-infrared spectroscopy in context of detection of contact pesticide residues on fruit. Based on chemical structure, spectra features and regression statistics for PLSR models, a product containing metiram and pyraclostrobin was chosen from six pesticides for further consideration. Regression models based on spectra of dry extracts of aqueous solutions and either acetone or water washes of contaminated fruit were encouraging (RMSECV of approximately 0.03 - 0.06 mg a.i.). This level of analytical performance would support the use of the technique as a rapid screening tool, with suspect samples then subject to the reference GC-MS analysis method. However, the PLSR model performance was poor across populations of fruit, suggesting that matrix changes in the solvent wash between sets of fruit is problematic. Further work is required to establish whether sufficient variation can be built into a calibration set to overcome this issue, without degrading model performance to the point where it loses practical application.
1. Introduction
The use of chemicals in production horticulture is increasingly regulated. Only certain designated chemicals are approved for use with a given crop, and strict conditions are placed on the concentration, frequency and timing of application, particularly with respect to the last application before harvest. Maximum residue levels in product that is destined for human consumption have been set. The front line of defence in terms of quality control on such standards is through audit of spray diaries. Analytical assessment of pesticide levels occurs very occasionally, given the cost and timing of analysis. Japan probably has the highest enforcement level, and the best example of analytical capacity to monitor compliance in imports from other countries.
As Sanchez and co-workers [1] point out, there is increasing public interest in food safety issues, and thus there is a driver for increased compliance testing. Thus there is a need for analytical techniques that enable swift and low cost screening for pesticide residues in food in general and fruit in particular. Techniques in current use include gas chromatography, gas and liquid chromatography combined with mass spectrometry, capillary electrophoresis and immunoassay [2]. However such analysis is relatively expensive, time consuming and destructive of the sample, and thus enable sampling of only a few samples per batch.
Analytical methods based on near infrared spectroscopy (NIRS; 750 - 2500 nm) are generally very rapid and require little sample preparation. For example, comercial fruit grading systems are available with the capacity of grading up to 10 pieces of fruit per second on a pack-line [3]. These systems utilise short-wave near infrared spectroscopy to non-invasively assess the soluble sugar or dry matter content of the fruit. Also, the analysis of active ingredient content of pesticide formulations using FT-NIR of a solvent extract of sample was noted to be “10 times faster”, with less solvent use than the chromatographic procedure [4].
Near infrared spectroscopy is capable of the determination of organic pesticides, given the presence of dipolar bonds in these chemicals. A number of studies, notably by de la Guardia and co-workers, have considered the use of NIRS in quality control of pesticide formulations.
This work has included consideration of number of scans and resolution for the assessment of Iprodione (a postharvest fungicide) content of agrochemical product, based on peak areas [5], and the assessment of Buprofezin (an insecticide), Diuron (a herbicide) and Daminozide (a plant growth regulator), based on PLS regression of NIR spectra (with RMSEP of 1.1%, 1.7% and 0.7% w/w for the latter three chemicals, respectively) [6].
Most recently, two studies on the use of NIRS to determine pesticide levels were published in 2011. One study describes the development of a PLSR model based on DESIR, using pure (aqueous) pesticide solutions (1.25 to 400 mg·kg–1), with spectra (10,000 to 4000 cm–1) acquired using an FT-NIR unit [7]. The use of multiplicative scatter correction with first derivative of absorbance data was recommended, with a R of 0.899 and a RMSECV of 42.3 mg·kg–1 reported. A support vector machine (SVM) was used to establish a classification model, however because of the low sample number used the model could easily overfit the data. Further, issues of matrix and model robustness were not considered in this study. The second study also considered determination of pesticide in pure methanol/water solutions, using a 1 mm transmittance cell and a Foss NIRSystem 6500 spectrophotometer [8]. A limit of detection of 12.6 and 46.4 mg·kg–1 for Alachlor and Atrazine respectively, was reported. Further verification of this result is recommended.
NIRS technology is generally associated with the assessment of concentrations at the %, not ppm, level. In those applications where ppm level determination has been reported, the assessment may represent measurement of an attribute that was correlated to the constituent of interest. This indirect correlation may be to either another chemical present in the sample at % levels, or to physical properties of the sample. For example, ergosterol in cereal grains may be detected at ppm levels because of changes in the physical (light scattering properties), or through indirect correlation with another chemical constituent [9]. The concentration of pesticides on fruit is typically at the ppm (mg a.i. kg–1) level (Table 1).
As for any analytical method, detection improvement can be achieved by simplifying the background matrix and/or by concentrating the constituent of interest. For example, the concentration of chlorinated pesticides in water was determined using a polymer with affinity for the analyte, coated on an ATR crystal and detected using FTIR spectroscopy [10]. In another report, Diuron was determined to a limit of detection 13 mg·kg–1 in pesticide formulations based on pesticide extraction with acetonetrile, followed by transmittance measurement (peak area measurement between 2021 and 2047 nm, corrected by baseline established at 2071 nm) [11]. More recently, a method was proposed for analysis of dithiocarbamate residues at ppm levels in foodstuff, based on the generation of carbon disulphide, and subsequent trapping of this gas into tetrachloroethylene and assessment by transmission infrared spectroscopy [12].
In 1987, Meurens et al. [13] introduced the “dry-extract system for infrared” (DESIR). In this procedure, a liquid containing the constituent of interest is dried onto a solid substrate with low absorptivity (e.g. sugar in the range 0.0% to 5.0% w/v, onto a glass fibre filter [13]). The drying step allows for concentration of the analyte, and removal of the solvent (which typically has strong absorption features in the NIR and IR). Other sample preparation procedures can be added to further simplify the sample matrix, or concentrate the constituent of interest in the liquid sample, prior to its addition to the glass filter paper. The technique can be used in combination with either reflectance infrared or near infrared spectroscopy. For example, good prediction of carbon in lake water at 0.2 to 1 ppm was reported based on a
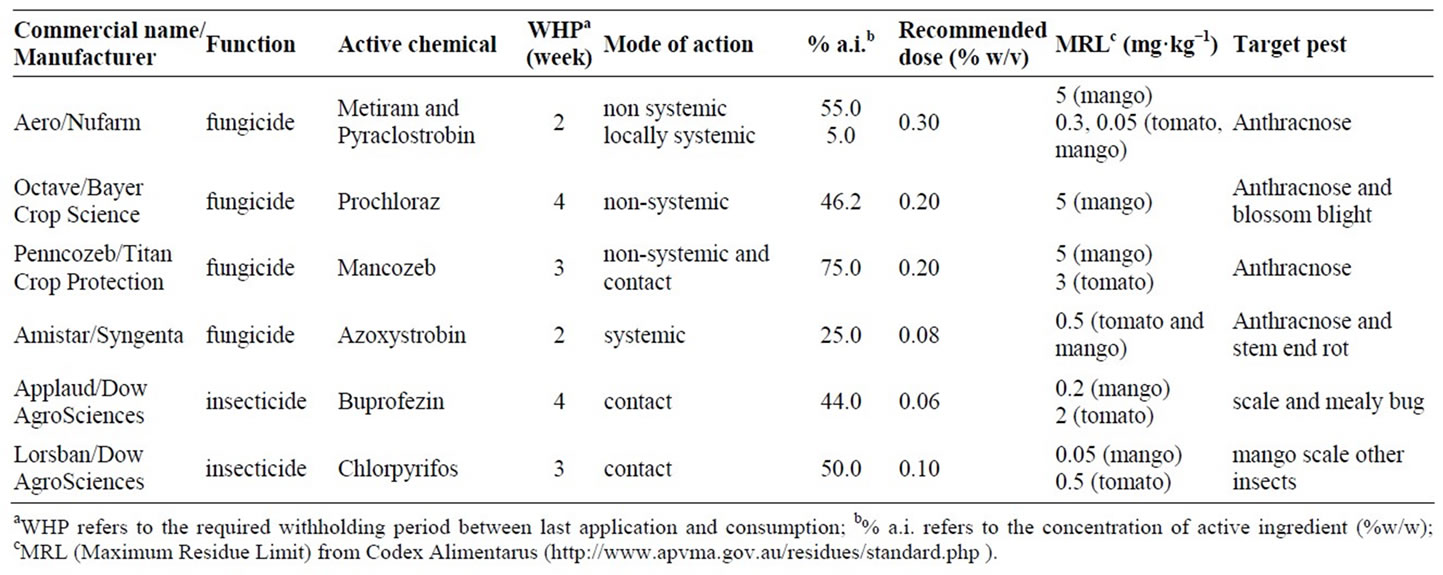
Table 1. Descriptions of six chemicals used in this exercise.
DESIR procedure involving filtering 150 mL of lakewater through a glass fibre and analysis using SWNIRS [14].
The first use of DESIR for the detection of pesticides on fruit was made by Saranwong and Kawano in 2005 [15]. In their procedure, the fruit was rinsed with acetone, and a sample of the acetone rinse introduced to the glass fibre filter. This work involved set of 95 tomatoes that was sprayed with different concentrations of Euparin (containing 50% dichlofluanid, N-dichlorofluoromethy-thioN’,N’-dimethyl-N-phenyl-sulfamide, CAS No. 1085-98- 9), allowed to dry, then washed with 25 mL acetone followed by 15 mL acetone (with acetone used as the solvent to suit the reference HPLC method). An aliquot of the wash solution was dried onto 37 mm glass fibre (GF/A Whatman, Maidstone, UK) at 45˚C for 1 h, then scanned with reflectance optics using a FOSS NIRSystems 6500 (1100 - 2500 nm) spinning cup accessory, with a ceramic plate as a reflector and a reference. A RMSECV of 6.6 ppm was achieved with pure solutions, and 7.9 ppm with tomato wash (n = 45, 2 to 90 ppm at 2 ppm intervals, mean = 40.2 ppm, SD = 27.6 ppm). Given the use of 40 mL wash solution and 200 g tomato fruit, the authors calculated that this was equivalent to a detection limit of 1.6 ppm (mg dichlofluanid per kg fresh weight of tomato) by the standard procedures, and quite acceptable relative to the acceptable limit of 15 ppm set by the Japanese government. The authors were encouraged by this result, and recommended further work, including the use of water, rather than acetone, as the wash solution. Note however that only one set of tomato fruit was used in this exercise, giving a similar background to all samples, and thus a rather ideal application. Prediction across populations differing in origin (and thus in surface extractables) can be expected to suffer increased bias and RMSEP.
Further work was undertaken by the same researchers (published in 2007 [16]), with consideration of pure acetone based solutions of three pesticides (O,S-dimethylyN-acethylphosphoramidothioate [CAS 30560-19-1], Ndichlorofluoromethythio-N’,N’-dimethyl-N-phenyl-sulfamide [CAS] and tetrach-loro-isophthalonitrile [CAS 1085- 98-9], known as acephate, dichlofluanid and TPN, respectively, and marketed as Ortran, Euparen and Daconil/Chlorothalonil, respectively). All three chemicals were used over the range 0 to 48 ppm (w/v). A RMSECV of 2.1, 5.3 and 9.3 ppm was reported for solutions of the three pesticides, respectively, and the detection limited ascribed to the number of groups with strong dipole moment groups in the chemical (3 CH3 and 1 NH in tetrachloro-isophthalonitrile; 2 CH3 in dichlofluanid; none in tetrachloro-isophthalonitrile). The SEP was noted to increase in mixtures of two pesticides. The result for TPN was deemed unacceptable for use in fruit quality assessment. The result for dichlofluanid was noted to be similar to the previous study, while the RMSECV for acephate was calculated to represent an accuracy of 1 ppm on a fruit weight basis, and deemed acceptable relative to the acceptable limit of 5.0 ppm set for fruit and vegetables in Japan. A collaborative study using acephate was implemented over three instruments; with similar RMSECV values obtained using the different instruments and technicians. A larger collaborative study involving multiple laboratories and presumably using fruit based samples was foreshadowed, however this did not occur (S. Saranwong, pers.comm.), and the group has since disbanded, with retirement of Sumio Kawano.
The above procedures are relevant to contact pesticides, which remain on the sample surface. The detection of systemic pesticides, in which the chemical is dispersed through the tissue, was indicated to be possible using near infrared spectroscopy by a study involving pesticide (chlorpyrifos) addition to vegetable juice extracts (R2 0.981, RMSECV 0.15 mg·kg–1) [17]. However, this study contained quite low sample numbers and a single juice matrix, so the model robustness in prediction is questionable. Indeed the authors concluded that the work was exploratory and that validation was required. Another report indicated a RMSEP of 0.1% w/v was achievable for detection of Chlorpyrifos (an insecticide) in minced white radish, using FTNIR (sample presentation method not given) [18]. However this exercise involved agrochemical addition to a single set of radish fruit, and used a random allocation of samples to calibration and validation sets. Thus, again, model robustness is questionable. In a 2010 publication, Sanchez et al. [1] report the detection of systemic pesticides in intact raw capsicum fruit using three separate methods—intact fruit scanned with a diode array spectrometer (1100 - 1700 nm), fruit homogenised and scanned with a tilting grating spectrophotometer (FOSS NIRSystems 6500, 1100 - 2200 nm) and homogenate used in a DESIR exercise (glass fibre discs soaked in juice, then dried at 40˚C 24 h) using the tilting grating unit. Fruit were sourced from commercial farms, with 659 intact pepper and 717 crushed pepper samples scanned, and then analysed for a broad range of chemicals (organophosphates, organochlorides, carbamates, pyrethoids, pyrimidine compounds, dicerboximides, thiazoles and naturalytes by GS/MS working in tandem MS/MS mode. A validation set of samples, not included in the calibration set, was used, however the validation set was selected on the basis of a Mahalanobois distance related measure to represent the calibration set. Thus the validation set does not represent a truly independent test set. A PLS discriminant analysis was undertaken using samples classified as either above or below the maximum residue limit (as set by EC 396/2005) for any of the assessed pesticides. It was claimed that differences in the first derivative spectra were visible for the two classes (pesticide levels above/below MRL) in all three sample presentations, and that the best classifications (at around 75% correct) were achieved with the intact fruit/scanning diode array procedure. Obviously such a capability would have wide ramifications in the fruit and vegetable industry. However this study does have limitations, and the authors cautioned that the results “must be considered as a feasibility study”. For example, it is not clear if all high residue samples were associated with fruit of a different variety to that associated with low residue samples, or from a different growing location (differing in growing conditions), and as the validation set was not independent of the calibration set, the validation result will be optimistic in terms of practical application. Certainly the ability to develop a model that can detect the presence of these agrochemicals on intact fruit seems optimistic.
Given the tremendous application potential for a rapid, cost effective assessment of pesticides in fruit, further assessment of the DESIR sample presentation method is certainly warranted. In the current study we attempt to extend the previous considerations [15,16] of detection of contact pesticides using a DESIR procedure. From our consideration of the published work to date, we considered that an exercise involving multiple populations of fruit was warranted, to address the issue of matrix variation and model robustness.
2. Material and Methods
2.1. DESIR Sample Preparation and Spectra Acquistion
A 47 mm diameter glass microfiber filter (GF/A) (Whatman International Ltd., UK, cat. No. 1820 047) was placed into a 50 mm diameter glass Petri dish for each sample. An aliquot (0.5 mL) of solution was gently delivered onto the filter paper using a pipette. This volume was found to just saturate the filter. The filter was held for 12 h in a fan forced oven at 31˚C and then stored in a desiccator to avoid interference of water.
The filters were inserted into spinning cup modules, with their upper surface facing the quartz window of the cup. Reflectance spectra (400 - 2500 nm) were acquired using a spinning module on a NIRSystems 6500 spectrophotometer, scanning the internal ceramic plate as a white reference prior to each sample. Duplicate spectra were acquired of each sample.
2.2. Pesticide Solutions
Six pesticide products in common use in agricultural systems of local significance, in either pre or post-harvest stages of mango and tomato, were considered (Table 1). Pure solutions of pesticides of various concentrations were made using deionised water. The concentrations were 0, 0.1, 0.5, 1, 2 and 10 times the recommended rate of application, which were 0.3, 0.20, 0.20, 0.08, 0.06 and 0.10 (% a.i.) for the products Aero, Octave, Penncozeb, Amistar, Applaud and Lorsban, respectively (Table 1). Maximum residue limits, drawn from the Codex Alimentarus (http://www.codexali-mentarius.org), are also presented in Table 1. The chemical structure of the active ingredient of these products, indicating functional groups that should display overtone and combination bands in the near infrared, is provided as Figure 1. The product Aero was chosen for further work, as described below.
Subsequently, a greater range of concentrations of the product Aero was considered (16 concentrations, from 0.225% to 0.60% w/v in 0.025% steps). This exercise was repeated at a later date, making fresh stocks of all concentration (from the same product source). DESIR preparations of each product and concentration were prepared and scanned as described above.
2.3. Fruit Treatment and Analysis
Populations of fruit (1 set of mango fruit, Mangifera indica, var. Kensington Pride, and 3 sets of apple fruit, Malus pyrus, var. Granny Smith) were sourced from a fruit retail outlet. One set of tomato (Lycopersicum esculentum, var. Gomerg) fruit were harvested from a commercial farm. The tomato fruit were visibly externally contaminated with white spray residue. Each population represented a different consignment of fruit. An aliquot (10 mL) of the pesticide Aero at various concentrations (0, 0.1%, 0.2%, 0.3%, 0.4% and 0.5% active ingredient) was sprayed onto fruit contained in separate open ziplock polyethylene (18 cm × 18 cm) bags, and allowed to dry for 4 h at room temperature. Five replicate fruit were treated per concentration.
In one exercise, mango fruit were rinsed first with 30 mL, then with 10 mL, of 95% acetone. The two extracts were combined in a beaker, and allowed to evaporate at room temperature. The solution volume was adjusted to 0.5 mL and transferred to the glass fibre filter paper. NIR spectra acquisition followed using the procedure indicated above.
The utility of water as an extractant, rather than acetone, was tested through the following exercises. In the first exercise, 10 mL of Aero solution of various concentrations were sprayed into empty bags (i.e. without fruit), then dried and extracted with two water washes (30 followed by 10 mL), instead of 95% acetone. Otherwise the experimental design and procedure was as above. This process was repeated, with inclusion of apple fruit (given that mango were no longer commercially available), using three sets of apple fruit (sourced at different times). Again, water was used as the rinse solvent rather than acetone. The DESIR sample preparation and NIR scan
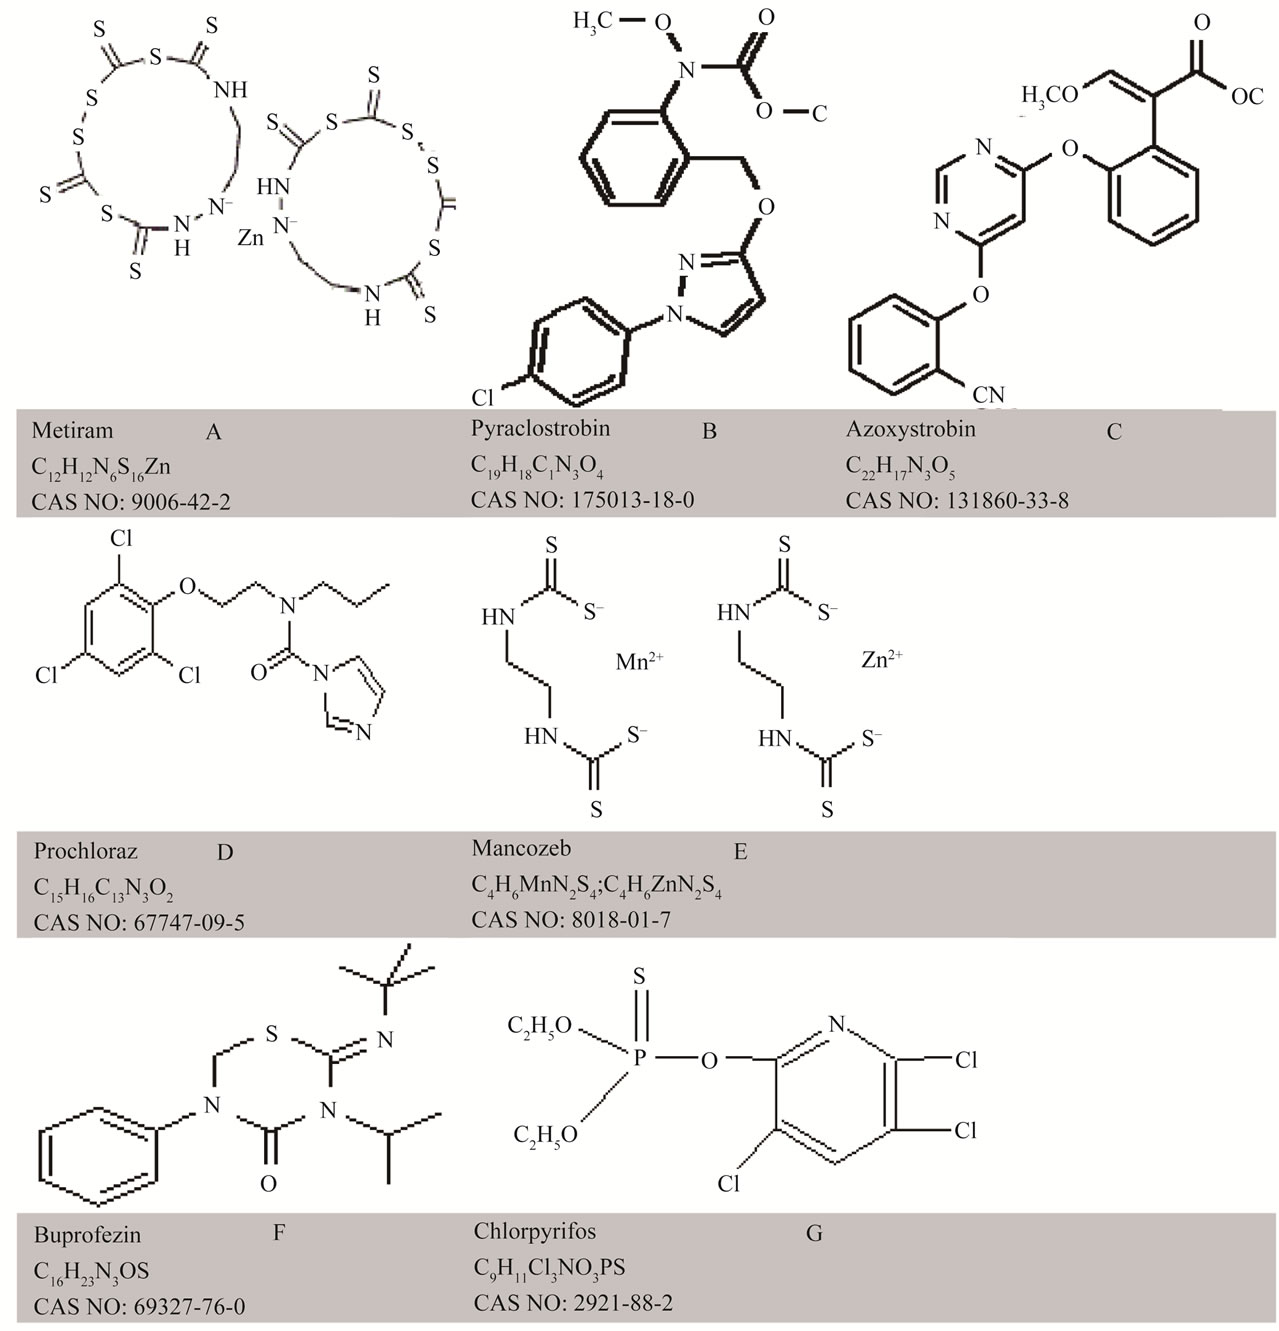
Figure 1. Chemical structure of six pesticides: (A) Metiram; (B) Pyraclostrobin; (C) Prochloraz; Panel; (D) Mancozeb; (E) Azoxystrobin; (F) Buprofezin and (G) Chlorpyrifos.
methods was then followed as per first experiment. In another exercise, tomato fruit were used, again with water used as the wash solvent.
2.4. Chemometrics (Data Processing and Analysis)
Spectra acquired from DESIR samples were processed using The UnScrambler chemometrics software, V9.1. Difference spectra were calculated in an Excel (Microsoft) spread sheet and the spectral window was optimised using a MatLab PLS toolbox (Eigenvector) and an inhouse developed script [19]. Processing of spectra with a Savitsky Golay second derivative involved a second order polynomial fit, with a left and right interval of nine points each.
3. Results and Discussions
3.1. Methodology
Sample processing to assess pesticide contamination of fruit surfaces involved washing the fruit, reducing the volume of the wash solvent, loading to a glass filter disc, drying the disc, loading the disc into a spinning disc accessory and scanning in a NIRSystems 6500 spectrophometer. The total effort involved in sample analysis was considerably less than GC-MS methodology, with less skill required of the operator. Effective processing time per sample was approximately 30 min.
3.2. Experiment 1. Comparison of Pesticide Spectra
Relative to the featureless spectra of the blank glass fibre, all pesticide treated fibre displayed unique spectra (Figure 2). The spectral features can be ascribed to overtone and combination bands of various C-H and N-H bonds within these molecules. Pyraclostrobin has 10 CH, 1 CH2, and 1 CH3 bonds, azoxystrobin has 11 CH, 1 CH3 and 1 C=O bond, prochloraz has 4 C-H, 4 CH2, 1 CH3, and 1 C=O, buprofezin has 1 C=O and 5 CH3, mancozeb has 2 NH and 2 CH2, chlorpyrifos has 2 CH2 and 1 CH3, and metiram has two NH bonds (Figure 1), and presumably the extinction coefficient of these chemicals would decrease in the order presented (i.e. absorption per unit concentration in order: pyraclostrobin = azoxystrobin > prochloraz > mancozeb = buprofezin > chlorpyrifos > metiram). If the NH bond is in a position that is unhindered within the chemical structure, there is a high likelihood it will produce a sharp, strong absorption band, which should improve detection of metiram and mancozeb. The NH absorption features are expected at about 2100 - 2200 nm (NH combinations), 1500 nm (first overtone) and 1000 - 1100 nm (second overtone). Absorption features around 1400, 1900 and 2300 are consistent with a strong O-H feature. These observations suggest that the product Aero might be a good candidate for detection using near infrared spectroscopy.
In practice, the highest PLS regression model R2 was obtained for the model of Aero concentration, although
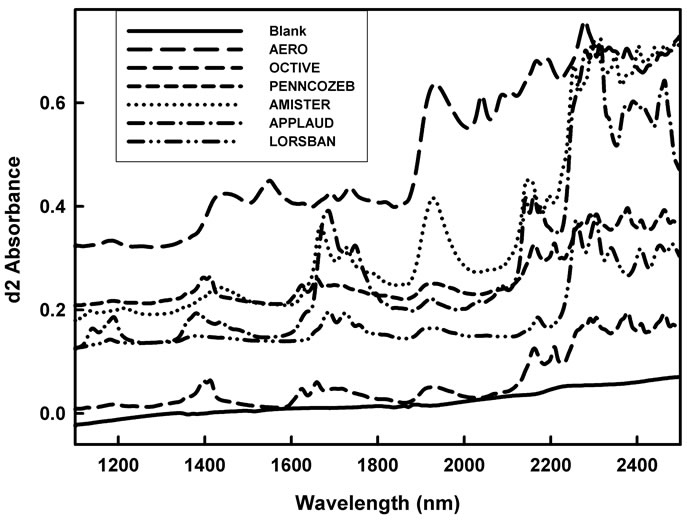
Figure 2. Reflectance (log1/R) spectra of DESIR preparations of 0.5 mL of neat solutions of the pesticide products Octave, Penncozeb, Amistar, Applaud and Lorsban (at 500, 500, 800, 60, 100 mg/kg of a.i., respectively), and Aero powder on glass fibre (at 300 mg/kg of a.i.). To assist visualisation spectra have been offset (0.3, 0.25, 0.2, 0.15, 0.1 and 0.05 units added to spectra of Aero, Penncozeb, Amistar, Applaud, Lorsban and Octave, respectively).
higher SDR values were obtained for models of Penncozeb and Amistar (Table 2). Note that R2 is related to RMSEC and SD, as R2 = 1 – (RMSEC/SD)2. However, in this exercise, SDR was calculated as SD/RMSECV. The difference between RMSECV and RMSEC was lower in the Penncozeb and Amistar models than was the case for the Aero model. Nonetheless, Aero was chosen for further work, based on this calibration result, on the interpretation that its structure should allow for NIR based assessment, and as this chemical is of particular importance to local industry.
3.3. Experiment 2. Further Consideration of Aero as Pure Solutions
With the product Aero selected as a good candidate for detection using near infrared spectroscopy, DESIR spectra were acquired of a range of concentrations (SD = 0.14, Table 3). Spectral features were related to concentration at several wavelengths (e.g. from around 2000 to 2100 nm, as seen in the d2log1/R spectra, Figure 3(a), and in the difference spectra, Figure 3(b)). The part of the d2log1/R spectrum carrying information about pesticide concentration was revealed in a plot of R2 against wavelength for regressions on pesticide concentration based on reflectance values at each wavelength (Figure 3(c)). A moving window PLS regression method was also adopted (following the procedure of Guthrie et al. [19]), trialling all combinations of start and stop wavelengths between 400 and 2500 nm (data not shown). This analysis, together with the observed spectral differences (Figures 2, 3), guided the selection of the wavelength range 1850 - 2048 nm for model development.
For a PLSR model developed using this wavelength region, a R2 of over 0.95, a RMSECV of around 0.03% a.i. and an SDR of around 4, was obtained in each of two replicate exercises (Table 2; also see scatter plot, Figures 4, 5). This result is encouraging for the use of near infrared spectroscopy for determination of Aero product, at least in pure solution or constant matrix conditions. A
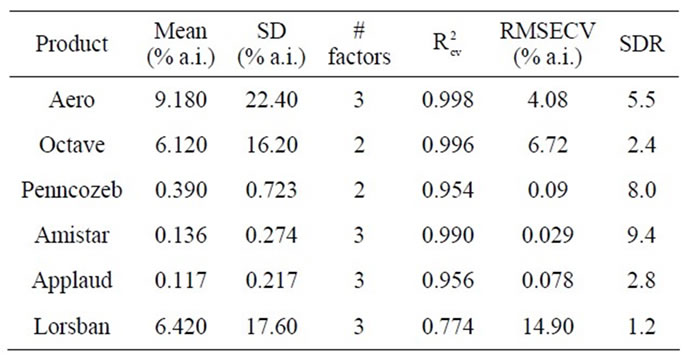
Table 2. PLSR calibration results for six pesticides, based on second derivate of log1/R spectra of DESIR samples of aqueous solutions of each pesticide, using the wavelength range 1850 - 2048 nm in all cases.
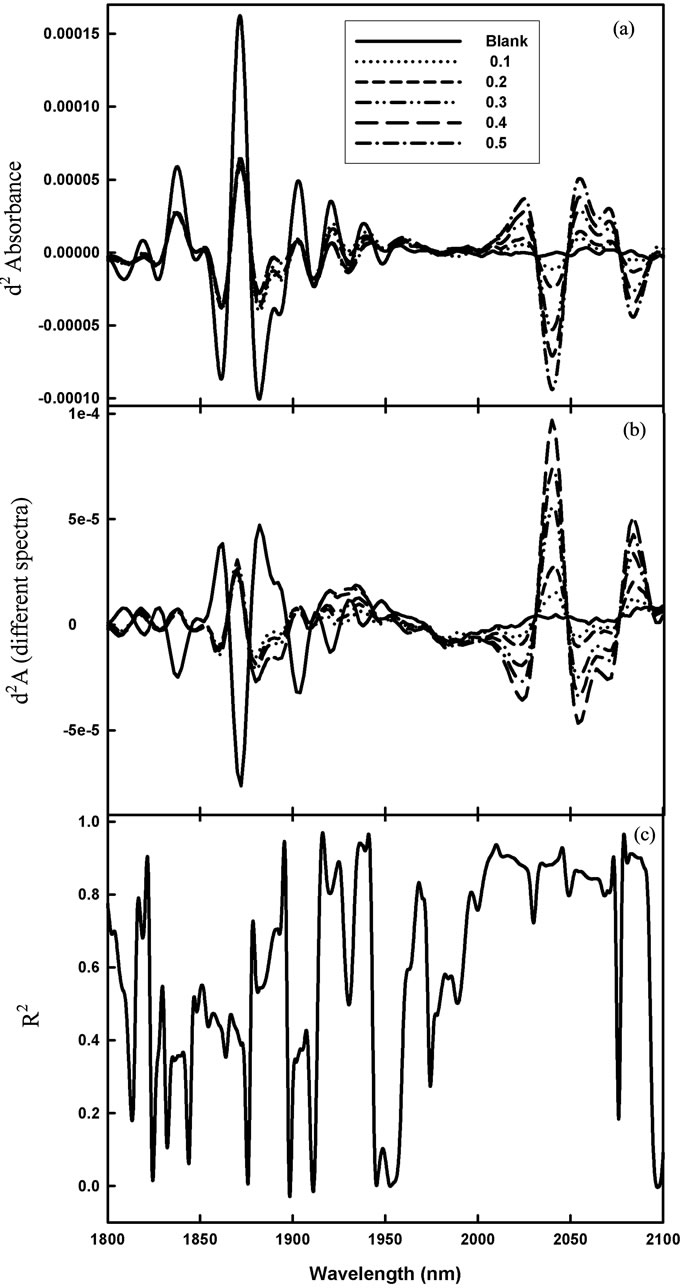
Figure 3. Second derivative of log1/R spectra (d2A) of DESIR preparations of 0.5 mL aliquots of Aero solutions varying between 0 and 0.5% w/v (a), difference spectra (subtracting the spectra of the blank glass fibre) (b), and the correlation coefficient of determination (R2) between the second derivative of log1/R and the concentration of pesticide, at each wavelength (c).
detection limit of 0.1% a.i. in a 0.5 mL sample is equivalent to 0.5 mg a.i. If this amount of product was washed from a fruit we would have 0.5 mg a.i. derived from, say, a 200 g fruit (following previous logic [15]), and thus the analytical equivalence of detection of 2.5 ppm (w/fw). However, the MLR for pyraclostrobin is 0.3 and 0.05 mg·kg–1 (ppm) for tomato and mango respectively, while that for metiram is 5 mg/kg (Table 1). Thus the near infrared spectroscopy technique would not replace GC-MS as the analytical method of choice, however as a relatively rapid and low cost technique, it could be of value
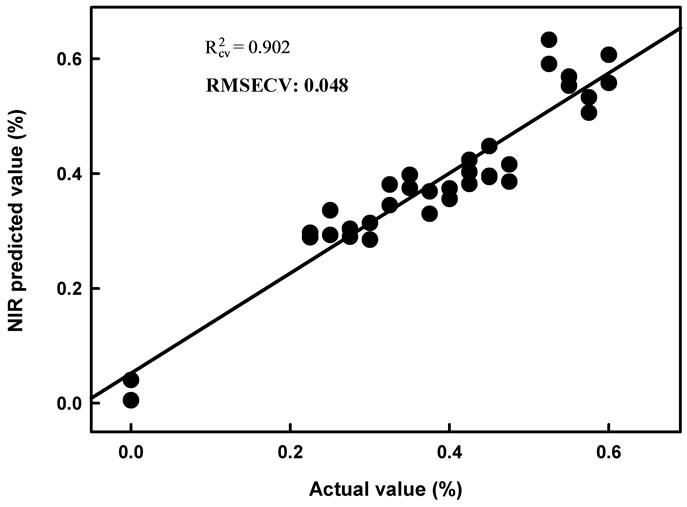
Figure 4. Scatter plot of PLS calibration regression model cross validation results for second derivative log1/R spectra of dry extract on glass fibre of Aero chemical at various concentrations (data of Population 1).
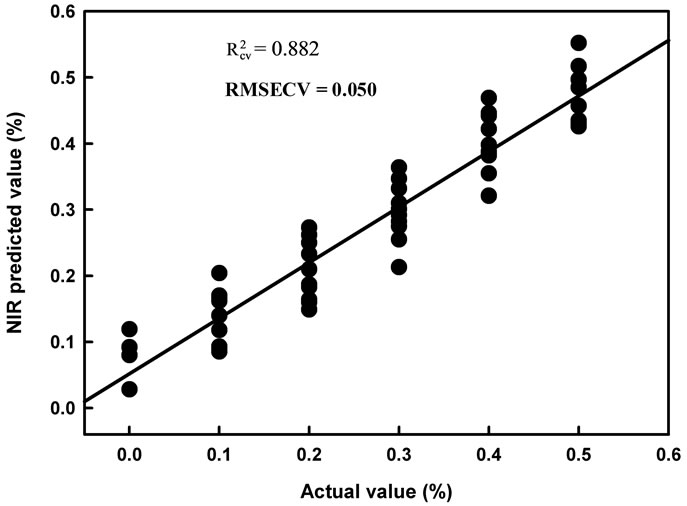
Figure 5. Scatter plot of PLS calibration regression model cross validation results for second derivative log1/R spectra of dry extract on glass fibre discs of Aero chemical at various concentrations sprayed onto mango and collected using an acetone wash (data of Population 3).
for high throughput screening exercises, with suspect samples subject to GC-MS analysis.
3.4. Experiment 3. Consideration of Aero Contamination of Fruit
Fruit were sprayed with a known volume of a known concentration of Aero fungicide while contained in a polyethylene bag. Thus all active ingredient contained into the bag. As a first exercise, Aero solution were sprayed onto mango fruit, dried, and recovered using an acetone wash, to follow earlier procedure [15]. Calibration statistics of  0.88, RMSECV 0.0487% a.i. and SDR 2.94 were achieved (Table 3(a)). A decrease in model performance was expected, compared to the model based on DESIR using straight Aero solutions, given the ace-
 (a) Calibration Statistics
 (b) Prediction Statistics
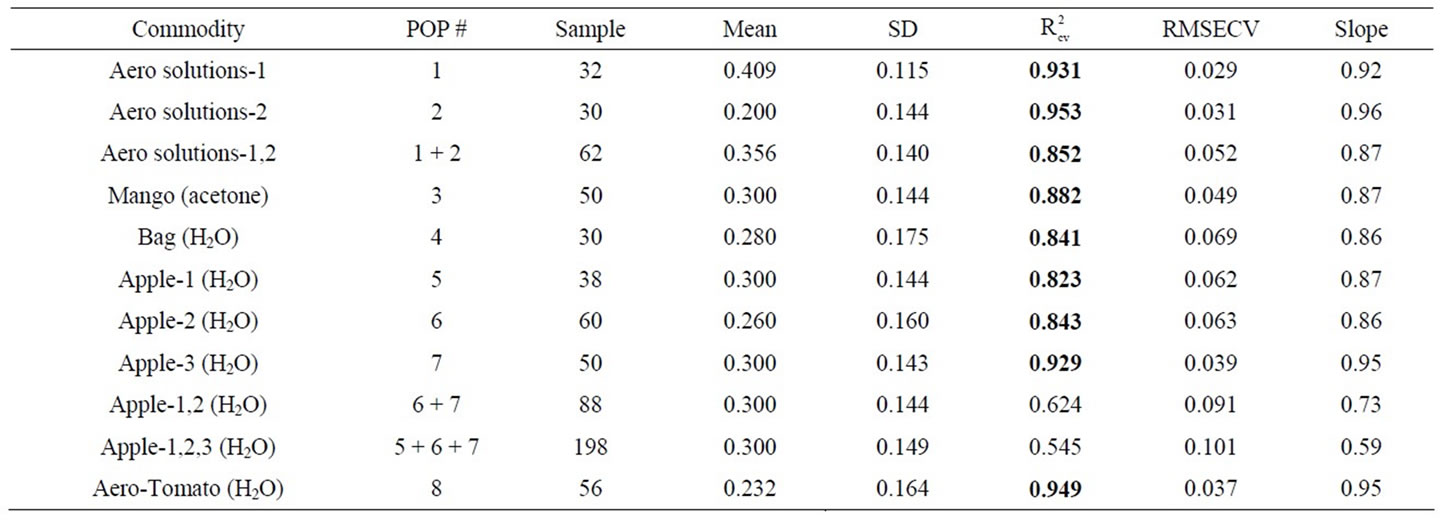
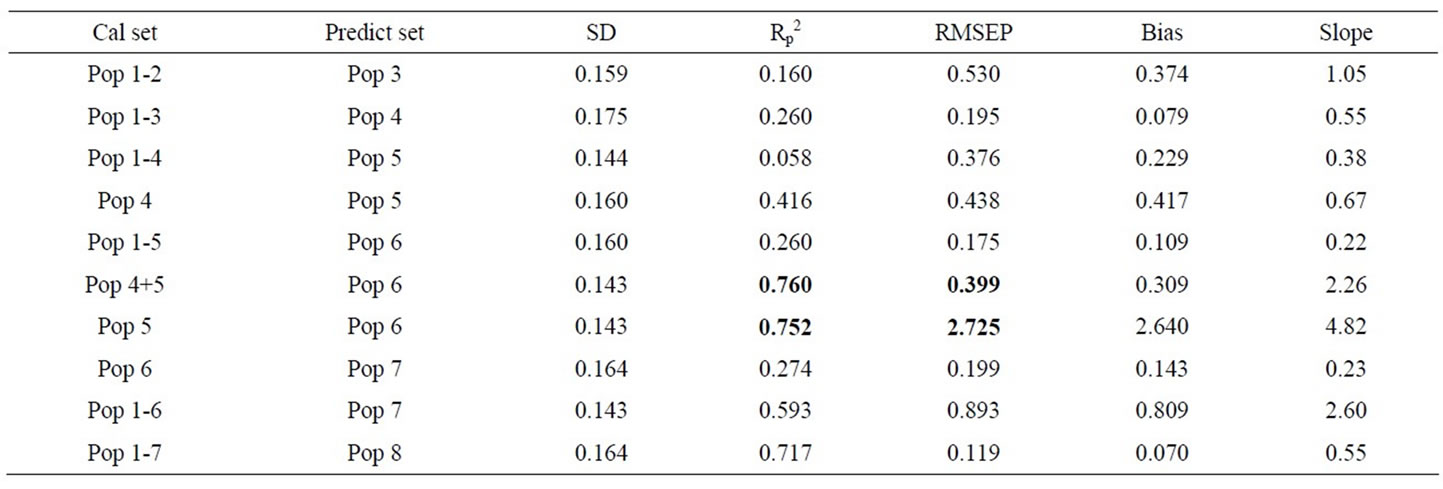
Table 3. Calibration (a) and prediction (b) results for PLS models based on reflectance spectra of DESIR samples of aqueous solutions of Aero chemical, and of wash from contaminated fruit. Wash solvent is indicated in brackets (95% acetone or water). R2 value greater than 0.75 displayed in bold.
tone wash will carry a range of other chemicals (e.g. dissolved cuticular wax) that could vary in quantity and composition from fruit to fruit. Indeed the wash was quite discoloured, suggestion extractions of some pigments from the mango skin. However, the results were comparable to that of the pure aqueous solutions, and on this basis further trials were undertaken, using water rather than acetone as the wash solvent.
As a control, Aero solutions (10 mL) were sprayed into empty bags, dried, and washed with water. The wash was delivered onto the glass fibre discs. Again, PLS regression models were encouraging ( 0.84; Table 3(a)), indicating that consistent recovery of material could be achieved using water rather than acetone as the wash solvent.
Aero solutions were sprayed onto three sets of apples, dried, and the water rinse dried onto glass fibre discs. Again, PLS regression models were encouraging ( > 0.8; Table 3(a)), indicating that consistent recovery of material was achieved using water rather than acetone as the wash solvent. Aero solutions were also sprayed onto field collected tomato fruit which were heavily contaminated with other sprays, dried, then water rinsed for DESIR. Again, PLS regression models were encouraging (
 0.95; Table 3(a)), despite the known contamination of the tomato fruit surface by other chemicals.
However, PLS regression calibration statistics for combinations of these populations were less encouraging (Table 3(a)). Further, plots of principal component 1 against 2 revealed that differences existed between the populations (data not shown). These observations are consistent with a change in matrix from the solvent wash of the fruit. The loss of model performance in combining two data sets of Aero chemical in solution cannot be ascribed to a matrix change, but rather may represent change in instrument performance or sample presentation. Thus, not surprisingly, a model based on a single population tended to perform poorly in predictions of independent sets (Table 3(b)). Models based on combinations of populations did improve in predictive ability (Table 3(b)), although the results were still below that required for practical application (an R2 of 0.75 is equivalent to an RMSEP = SD/2, i.e. at best suited to grading to 2 groups).
4. Conclusion
The calibration results achieved are consistent with previous reports (e.g. [15,16]) on the sensitivity of NIRS based on dry extract sample preparation, and support the use of water as the solvent for fruit washing, rather than acetone, for the detection of metiram and pyraclostrobin on fruit. However, this level of analytical performance would support the use of the technique only as a rapid screening tool, with suspect lots then subject to the reference GC-MS analysis method. Further, matrix variation in the solvent wash between sets of fruit was demonstrated to be problematic for model predictive performance. Thus previous reports of the utility of the DESIR technique for assessment of pesticides on fruit have been over optimistic. Further work is required to establish whether sufficient variation can be built into a calibration set to overcome this issue, as well as any sample presentation or instrument variation, without degrading model performance to the point where it loses practical application.
5. Acknowledgements
We acknowledge the funding support of Hortical P/L and Horticulture Australia Ltd. We thank Roy Collis, Giru and SP Exports, Bundaberg for provision of mangoes and tomatoes, respectively.
REFERENCES
- M. T. Sanchez, K.Flores-Rojas, E. G. Jose, A. G. Varo and D. Perez-Marin, “Measurement of Pesticides Residues in Peppers by Near-Infrared Reflectance Spectroscopy,” Pest Management Science, Vol. 66, No. 6, 2010, pp. 580-586. doi:10.1002/ps.1910
- L. Alder, K. Greulich, G. Kempe and B. Veith, “Residue Analysis of 500 High Priority Pesticides: Better by GCMS or LC-MS/MS?” Mass Spectrometry Reviews, Vol. 25, No. 6, 2006, pp. 838-865. doi:10.1002/mas.20091
- M. Golic, K. B. Walsh and P. Lawson, “Short-Wavelength Near Infrared Spectra of Sucrose, Glucose, and Fructose with Respect to Sugar Concentration and Temperature,” Applied Spectroscopy, Vol. 57, No. 2, 2003, pp. 64A-85A. doi:10.1366/000370203321535033
- J. Moros, S. Armenta, S. Garrigues and M. de la Guardia, “Univariate near Infrared Methods for Determination of Pesticides in Agrochemicals,” Analytica Chimica Acta, Vol. 579, No. 1, 2006, pp. 17-24. doi:10.1016/j.aca.2006.07.009
- S. Armenta, S. Garrigues and M. de la Guardia, “Optimization of Transmission near Infrared Spectrometry Procedures for Quality Control of Pesticide Formulations,” Analytica Chemica Acta, Vol. 571, No. 2, 2006, pp. 288- 297. doi:10.1016/j.aca.2006.05.003
- S. Armenta, S. Garrigues and M. de la Guardia, “Partial Least Squares-Near Infrared Determination of Pesticides in Commercial Formulations,” Vibrational Spectroscopy, Vol. 44, No. 2, 2007, pp. 273-278. doi:10.1016/j.vibspec.2006.12.005
- J. Chen, Y. Peng, Y. Li, W. Wang and J. Wu, “ A Method for Determining Organophosphate Pesticide Concentration Based on Near Infra-Red Spectroscopy,” Transactions of the ASABE, Vol. 54, 2011, pp. 1025-1030.
- A. Gowen, Y. Tsuchisaka, C. O’Donnell and R. Tsenkova, “Investigation of the Potential of Near Infrared Spectroscopy for the Detection and Quantification of Pesticides in Aqueous Solution,” American Journal of Analytical Chemistry, Vol. 2, 2011, pp. 53-62. doi:10.4236/ajac.2011.228124
- F. E. Dowell, M. S. Ram and L. M. Seitz, “Predicting Scab, Vomitoxin, and Ergosterol in Single Wheat Kernels Using Near-Infrared Spectroscopy,” Cereal Chemistry, Vol. 76, No. 4, 1999, pp. 573-576. doi:10.1094/CCHEM.1999.76.4.573
- F. Regan, M. Meaney, J. G. Vos, B. D. MacCraith and J. E. Walsh, “Determination of Pesticides in Water Using ATR-FTIR Spectroscopy on PVC/Chloroparaffin Coatings,” Analytica Chimica Acta, Vol. 334, No. 1-2, 1996, pp. 85-92. doi:10.1016/S0003-2670(96)00259-0
- J. Moros, S. Armenta, S. Garrigues and M. de la Guardia, “Near Infrared Determination of Diuron in Pesticide Formulations,” Analytica Chimica Acta, Vol. 543, No. 1-2, 2005, pp. 124-129. doi:10.1016/j.aca.2005.04.045
- A. Gonzalvez, S. Garrigues, S. Armenta and M. de la Guardia, “Determination at Low ppm Levels of Dithiocarbamate Residues in Foodstuff by Vapour Phase-Liquid Phase Microextraction-Infrared Spectroscopy,” Analytica Chemica Acta, Vol. 688, No. 2, 2011, pp. 191-196. doi:10.1016/j.aca.2010.12.037
- M. Meurens, O. V. D. Eydne and M. Vanbelle, “Fine Analysis of Liquids by NIR Reflectance Spectroscopy of Dry Extract on Solid Support (DESIR) in Near Infrared Diffuse Reflectance/Transmittance Spectroscopy,” In: J. Hollow, K. J. Kaffka and J. L. Gonczy, Eds., Akademiai Kiado, Bundapest, Hungary, 1987, pp. 297-302.
- D. F. Malley, P. C. Williams, M. P. Stainton and B. W. Hauser, “Application of Near-Infra-Red Reflectance Spectroscopy in the Measurement of Carbon, Nitrogen and Phosphorus in Seston from Oligotrophic Lakes,” Canadian Journal of Fisheries and Aquatic Sciences, Vol. 50, No. 8, 1993, pp. 1779-1785. doi:10.1139/f93-199
- S. Saranwong and S. Kawano, “Rapid Determination of Fungicide Contaminated on Tomato Surfaces Using the DESIR-NIR: A System for ppm—Order Concentration,” Journal of Near Infrared Spectroscopy, Vol. 13, No. 3, 2005, pp. 169-175. doi:10.1255/jnirs.470
- S. Saranwong and S. Kawano, “The Reliability of Pesticide Determinations Using Near Infrared Spectroscopy and the Dry-Extract System for Infrared (DESIR) Technique,” Journal of Near Infrared Spectroscopy, Vol. 15, No. 4, 2007, pp. 227-236. doi:10.1255/jnirs.740
- J. Wu, C. Liu, Y. Chen, Y. Chen and Y. Xu , “ Study on Detection Technology of Pesticide Residues in Vegetables Based on NIR,” Computer and Computing Technologies in Agriculture II, Vol. 295, 2009, pp. 2217-2222. doi:10.1007/978-1-4419-0213-9_73
- Y. Zhou B. Xiang, Z. Wang and C. Chen, “Determination of Chloropyrifos Residue by Near-Infrared Spectroscopy in White Radish Based on Interval Partial Least Square (iPLS) Model,” Analytical Letters, Vol. 42, No. 10, 2009, pp. 1518-1526. doi:10.1080/00032710902961032
- J. A. Guthrie, K. B. Walsh, D. J. Reid and C. J. Liebenberg, “Assessment of Internal Quality Attributes of Mandarin Fruit. 1. NIR Calibration Model Development,” Australian Journal of Agricultural Research, Vol. 56, No. 4, 2005, pp. 405-416. doi:10.1071/AR04257
Abbreviations
SD: standard deviation;
RMSEC: root mean square of error of calibration;
RMSECV: root mean square of error of cross validation;
RMSEP: root mean square of error of prediction;
SDR: standard deviation ratio;
DESIR: dry-extract system for infrared;
MRL: maximum residue limit.