American Journal of Analytical Chemistry
Vol. 3 No. 1 (2012) , Article ID: 16811 , 9 pages DOI:10.4236/ajac.2012.31005
Gel Permeation Chromatography Purification and Gas Chromatography-Mass Spectrometry Detection of Multi-Pesticide Residues in Traditional Chinese Medicine
State Key Laboratory of Marine Environmental Science, College of Oceanography & Environmental Science, Xiamen University, Xiamen, China
Email: *zbgong@xmu.edu.cn
Received November 3, 2011; revised January 5, 2012; accepted January 14, 2012
Keywords: Traditional Chinese Medicine; Multi-Pesticide Residue; Flos Lonicerae; Gel Permeation Chromatography; Gas Chromatography-Mass Spectrometry
ABSTRACT
The measurement of 23 organochlorine, organophosphorus, and pyrethroid pesticides in typical traditional Chinese medicine (TCM), flos lonicerae, was made using gel permeation chromatography (GPC) purification and gas chromatography-mass spectrometry (GC-MS) detection. The pesticides were extracted with ultrasonic device and 5.0 mL mixture of ethyl acetate and cyclohexane (1:1, v/v). Coextractants from sample matrices which may have interfere to the qualitative and quantitative analysis, such as pigments, were removed using GPC purification. Simultaneous full scan and selective ion monitor (scan/SIM) mode for GC-MS was used for qualitative and quantitative analysis, which provided retention time and characteristic fragments ratio for each pesticide so as to positively identify each analyte. Relative standard deviations (RSDs) were within 7.7% (5.0 - 22.5 µg/kg, n = 3). The recoveries of pesticide standards at the spiked concentration of 5.0 - 22.5 µg/kg were between 87.1% and 110.9%. Limits of detection (LODs) for the analytes were 0.16 - 3.2 µg/kg, which could meet the demand of routine analysis and TCM quality control.
1. Introduction
Traditional Chinese Medicine (TCM) usually means medicinal plants. Herb water, mixed tablet, and powder from the extracts of herbs are the general styles in clinical practice. The usage of TCM in China has a very long history. The influence of TCM on health care system has been profound in Asia as well as in the West in recent years [1-3]. The concerning of contaminations of heavy metals [4-6] and pesticides [2,6-9], which may be introduced during the cultivation, transportation, preparation and preservation, has been increased as the popularity of TCM enlarged.
Pesticides using to control various insect pests all over the world have advanced agriculture to gain great productivity [10,11]. In the mean time, they contaminate the environment [12] and endanger human health [13]. Some pesticides are neural destroyers [14], and some act as hormones, which may disturb human endocritic system [15]. Most of the pesticides are bio-accumulated and may be transferred along the food chain [16], similar to the environmental behavior of heavy metals. For these reasons, the contents of pesticide residues in Chinese herbs have been concerning by public in China and the other areas of the world. There have methods reported for the analysis of pesticide residues in TCM [9,17,18]. However, a rapid procedure or screening method to determine organochlorine, organophosphorus, and pyrethroid pesticides in TCM, especially for complex matrix medicinal herbs, such as flos lonicerae, is of great significance in quality control activities.
Typically, measurement of multi-residue in complex matrices comprises sample pre-treatment, separation and detection by gas chromatography-mass spectrometry (GCMS) [19,20]. The pre-treatment usually is time-consuming, which includes extraction, purification, and enhancement of the analytes to reduce or eliminate possible interference to the accurate detection. Soxhlet extraction [21], accelerated solvent extraction (ASE) [16], supercritical fluid extraction (SFE) [17], solid phase extraction (SPE) [12,13], microwave-assisted extraction (MAE) [22], matrix solid phase disperse extraction (MSPDE) [19,23], and disperse solid phase extraction (DSPE, QuEChERS) [24-26] have been investigated for pesticides analysis. Gel permeation chromatography (GPC), as reported in bibliography [10,16,27,28], may be one of the best techniques for the analysis of multi-residue of pesticides in TCM, which separates lower molecular weight target pesticides from higher molecular weight chemical matrices, such as pigments. Gas chromatography-mass spectrometry can do two-tier identification and confirmation with the retention time and the relative ratios of characteristic ions of the pesticide. The select ion monitor (SIM) can eliminate matrix influence and enhance selectivity and sensitivity effectively. The double mode of scan plus SIM mode (scan/SIM) can qualify and quantify target compounds simultaneously in a single injection.
The purpose of this study was to develop a novel method for accurately and simultaneously determination of organochlorine, organophosphorus, and pyrethroid pesticides in flos lonicerae. The advantage of GPC purification and good separation and high sensitivity of GC-MS was investigated in qualitative identification and quantitative detection of multi-pesticide in complex chemical matrices.
2. Experimental
2.1. Chemicals and Reagents
Acetone, acetonitrile, cyclohexane and ethyl acetate were all of HPLC grade and purchased from Thermal Fisher Co. (USA). The 23-pesticide standards were from Chem Service Co. (USA), which were of purity ≥ 98.1%.
1000 µg/mL stock solutions for each pesticide were prepared with acetone and stored in freezer at –18˚C. 10 µg/mL mixed standard solution for daily work were obtained by mixing and diluting stock solutions with acetone, and stored in a refrigerator at 4˚C.
2.2. Apparatus
Agilent 7890A gas chromatography, 5975C mass spectrometer, and 7683B auto sample injector was used (Agilent Technologies, USA). Data acquisition, data processing, and instrumental control were performed with Agilent Enhanced ChemStation (Agilent Technologies, USA). A DB-5 MS fused silica capillary column of 30 m × 0.25 mm with 0.25 µm film thickness from Agilent Technologies was used.
The GPC system (Vario, LC Tech, Germany) consisted of high pressure pump, auto-sampler with 24-sample vials (10 mL) and 5.0 mL sample loop, GPC column, and 24 fraction collected vials (100 mL). The clean-up GPC column was packed polystyrene-divinylbenzene (Bio-Beads S-X3, 400 mm × 25 mm I.D., 200 - 400 mesh).
MS2 mini-shaker (IKA, Germany), B5200S-OT ultrasonic extract device (Branson, USA), centrifuge (Shanghai, China), auto concentrating apparatus (EVA Ш, LC Tech, Germany), and laboratory-built nitrogen evaporator were used.
2.3. Sample Extraction and Purification
1.000 g of ~2 kg homogenized dry flos lonicerae sample was extracted with 5.0 mL mixed ethyl acetate and cyclohexane (1:1, v/v) for 10 min. The extraction was repeated for 3 times. Combine the extracts together, and then concentrated with a nitrogen stream to 10.0 mL. 5.0 mL of the extract solution was injected and separated on GPC with a mixed mobile phase of ethyl acetate and cyclohexane (1:1, v/v) at a flow rate of 5.0 mL/min. The fraction containing the analyzed pesticides was collected within the retention time of 17 to 36 min (totally 95.0 mL of eluant). The GPC fraction was evaporated and concentrated to 5.0 mL using EVA Ⅲ rotary evaporator at 40˚C, and further concentrated to near dry with nitrogen stream, re-dissolved with 0.5 mL mixture of ethyl acetate and cyclohexane (1:1, v/v) for GC-MS analysis.
2.4. GC-MS Conditions
Carrier gas was high purity of Helium (≥99.999%). The separation of all pesticides was performed with a constant pressure mode. The injection port of GC was 250˚C. 1.0 µL of pretreated sample solution was injected in splitless mode (split valve closed for 0.75 min). The retention time was locked by chlorpyrifos-methyl. Programmed temperature for GC oven was initially 50˚C for 1 min, increased to 125˚C at a rate of 25˚C/min, and then to 300˚C at 10˚C/min, and finally maintained at 300˚C for 10 min until all the analytes eluted.
Electron impact (EI) ionization source was used at 70 eV. The interface between the GC and mass detector was maintained at 280˚C. The temperature for EI source and quadrupole were set at 230˚C and 150˚C, respectively. The solvent delay time was set to 3.5 min. Full scan and selected ion mode (Scan/SIM) were used to qualitative identification and quantitative detection of multi-pesticide.
Figure 1 is the chromatograms of 23-pesticide standard and standard spiked flos lonicerae sample at optimized operating conditions. All pesticides in Figure 1 have been separated and eluted before the retention time 23.237 min. Additional 8 min at 300˚C was set for column cleaning-up and ready for next injection
3. Results and Discussion
3.1. Optimization of Extraction and Purification Procedure
The pesticides studied in this work are refereed to different natures, classes and physicochemical properties, especially their wide range of polarity. In fact, the sample pretreatment for multi-residue measurement is of difficulty. In this experiment, acetonitrile, cyclohexane, ethyl acetate, and mixture of ethyl acetate and cyclohexane
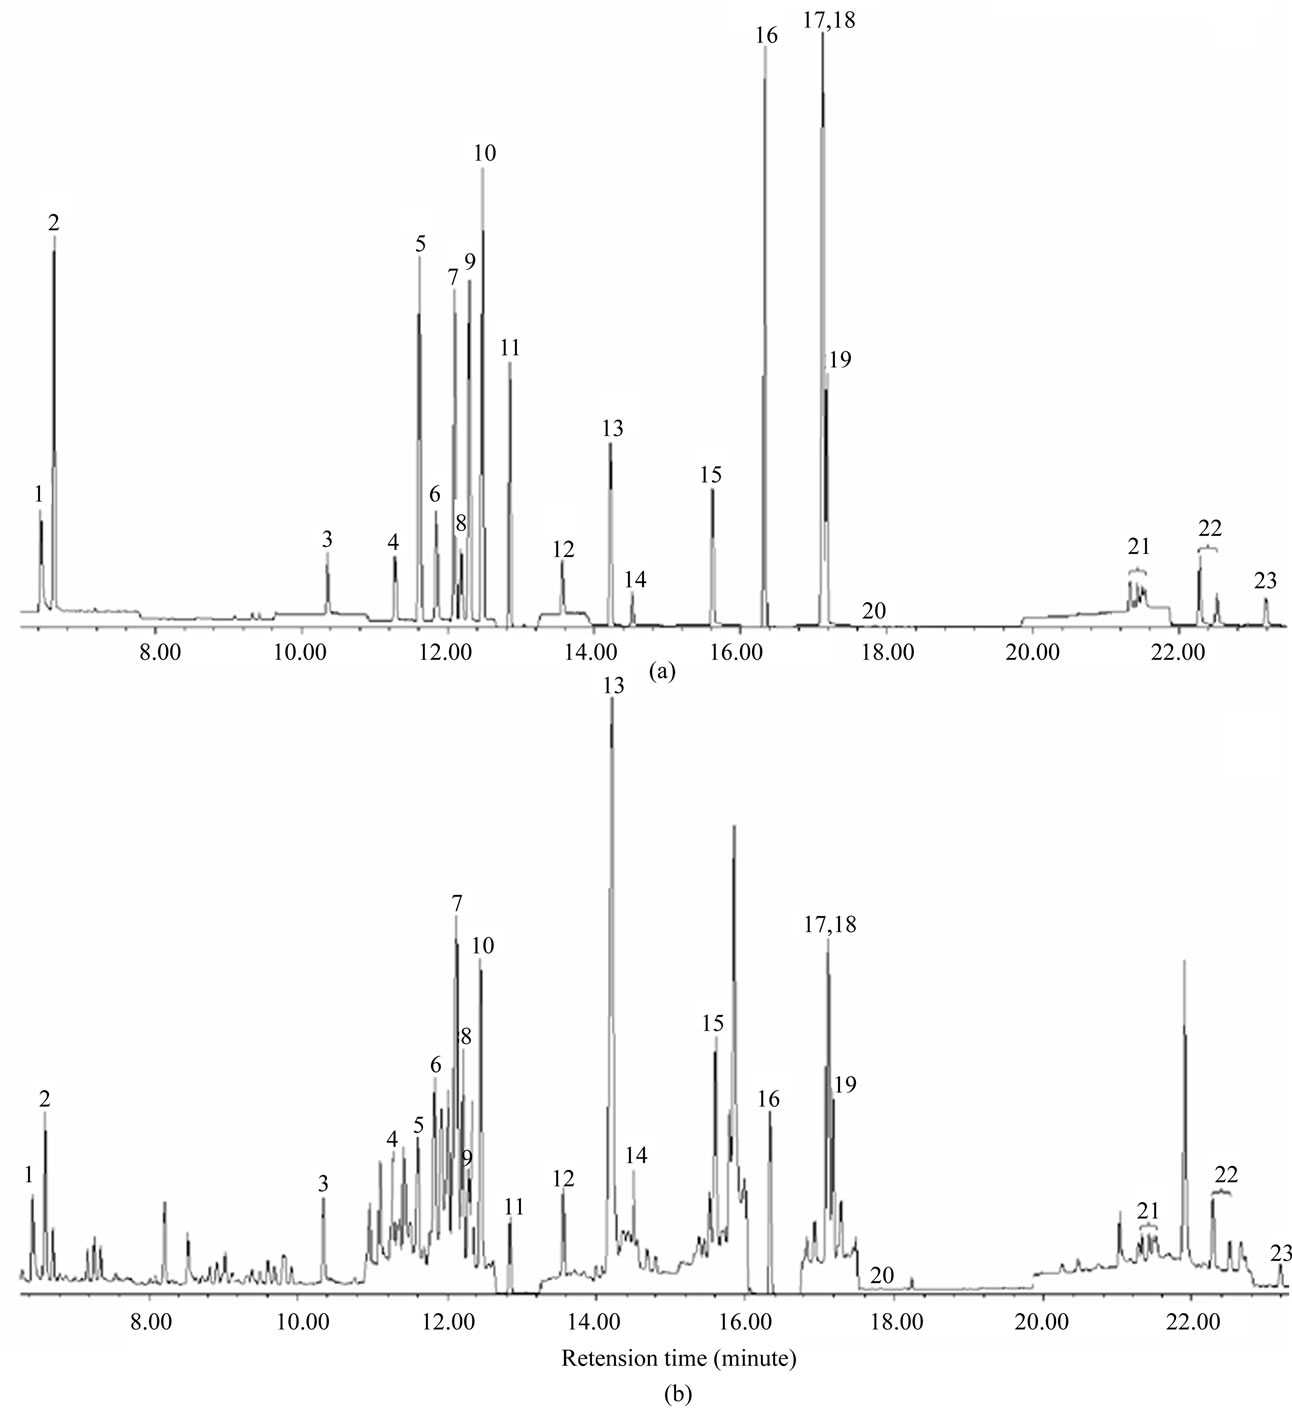
Figure 1. Chromatograms of 23-pesticide standard (a) and standard spiked flos lonicerae sample; (b) Peak identification: 1, Methamidophos; 2, Dichlorvos; 3, Omethoate; 4, Monocrotophos; 5, a-BHC; 6, Dimethoate; 7, b-BHC; 8, Quintozene; 9, Lindane; 10, Diazinon; 11, d-BHC; 12, Methyl parathion; 13, Malathion; 14, Parathion; 15, Methidathion; 16, p,p'-DDE; 17, Ethion; 18, p,p'-DDD; 19, o,p'-DDT; 20, p,p'-DDT; 21, Cypermethrin; 22, Fenvalerate; 23, Deltamethrin.
(1:1, v/v) were investigated to be extract solvent to extract pesticides from flos lonicerae sample.
As one of the most efficient extract solvent, acetonitrile can yield more co-extracts and make the followed clean-up or purification step sophisticated. Furthermore, acetonitrile can not dissolve very well in cyclohexane which was used as the GPC mobile phase in this work. The extract dissolved within acetonitrile had to be evaporated and concentrated near to dry and then re-dissolved by GPC mobile phase before loading to purification when acetonitrile was used as extract solvent in this case. At the same time, non-polar cyclohexane was not good enough to extract most of the polar pesticides, such as organophosphorus pesticides. In the experiment, finally we found that ethyl acetate and ethyl acetate-cyclohexane mixture (1:1, v/v) were the most efficient extract solvent for all pesticides investigated. To match the GPC mobile phase, ethyl acetate-cyclohexane mixture (1:1, v/v) was used as the extract solvent in following experiments, which has proper polarity and can improve extraction efficiency and minimize matrix interferences.
The volume of GPC fraction, collected as the purified pesticides, was one of the most important operating parameters. In this work, the experiment results showed that most of the pesticides eluted in the retention time of 16 - 36 min. In the meantime, many pigments eluted in 16 - 17 min, which would had interference on the identification, certification, and determination of pesticides with GC-MS. Therefore, the GPC fraction in the retention time of 17 - 36 min, totally 95.0 mL, were collected and concentrated to 0.50 mL for GC-MS analysis.
3.2. GC-MS Detection
In this study, pesticide residue, usually at trace or ultratrace level, accompanied with complex matrices, although there had GPC clean-up step before analysis by GC-MS. The identification and certification of analyzed pesticides should be careful and take more evidences to avoid possible mistakes. The efficient separation of pesticides and continuum components by GC was essential in this work, which provided the retention times to identify analytes. In the same time, the capability of discerning characteristic fragments of each pesticide by MS detector could avoid or eliminate false positives in measurement. 4 characteristic fragment ions for each pesticide were chosen to calculate the ratio of characteristic ion abundance ratio. At last, the qualitative analysis, or the identification and certification, of all pesticides were performed with both the retention time and the ratios of the abundance of characteristic ions of each pesticide.
For the quantitative analysis of pesticides, the simultaneous full scan and selected ion monitor (scan/SIM) mode were used, which not only provide pesticide structure information but also improve the selectivity. Owe to the benefit of this scan/SIM mode, qualification and quantification can be completed synchronously in a single injection. Quantitative analysis of all pesticides was carried out with the abundance of a carefully selected characteristic fragment ion, which was free of the matrix interference. Table 1 listed all the 14 groups of monitoring ions for the 23 pesticides. Table 2 shown the retention time (tr), quantifying ions, qualifying ions, and the abundance ratios of all characteristic ions for each pesticide. The uncertainty of ion ratios for qualification was controlled to lower than 20%.
3.3. Analytical Performance for the Developed Method
The developed method was validated with the recoveries of the spiked standards in flos lonicerae sample. In the experiments, we chose a pesticide free flos lonicerae sample as the chemical matrix. By spiking different concentration level of pesticides standard in sample matrices and aging in a refrigerator for at least 4 hr at 4˚C, artificial samples were prepared to the evaluation of method accuracy, precision, calibration, limits of detection (LODs), and limits of quantification (LOQs) in following experiments.
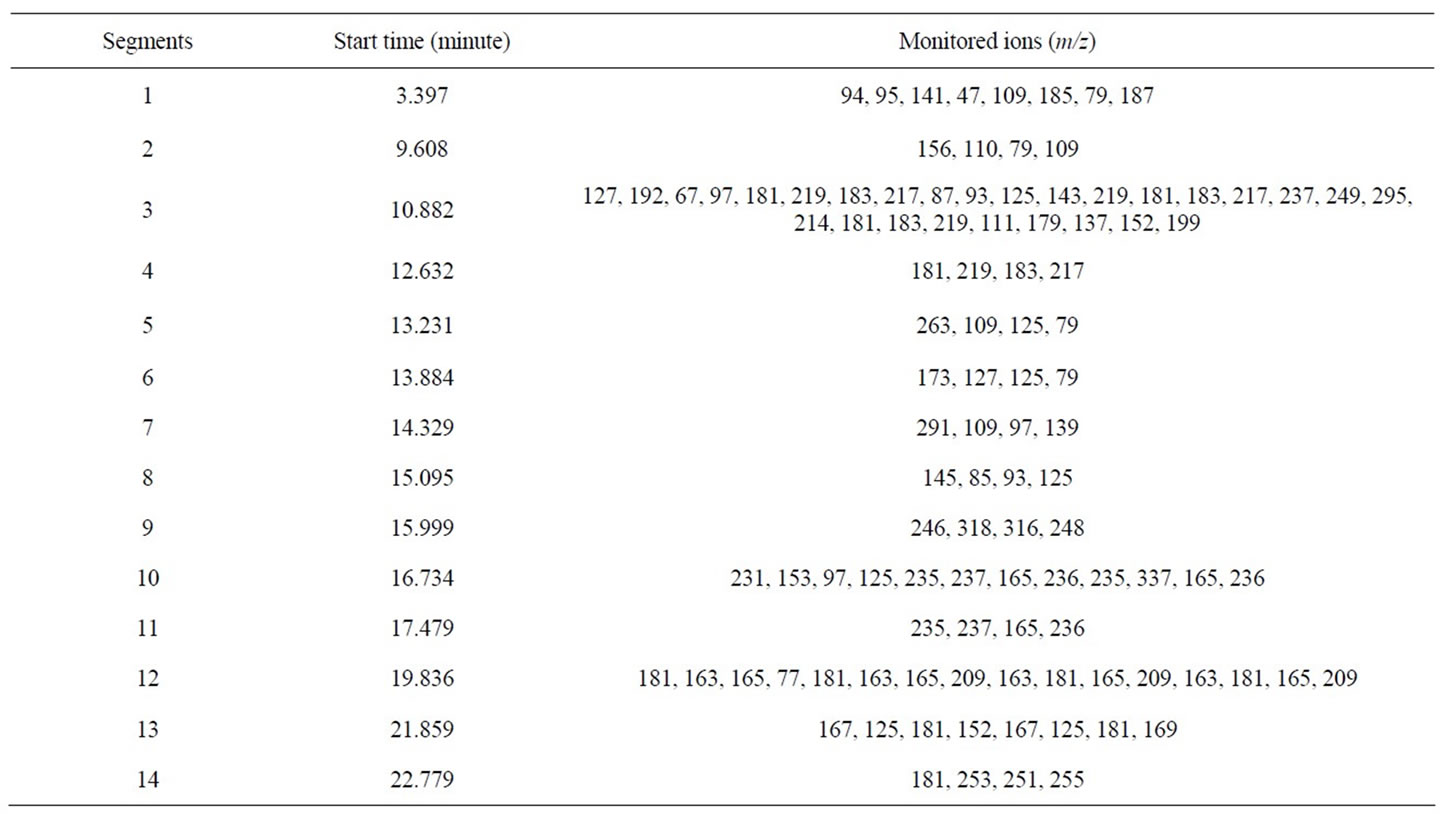
Table 1. Monitoring ions segments of pesticides by GC-MS.
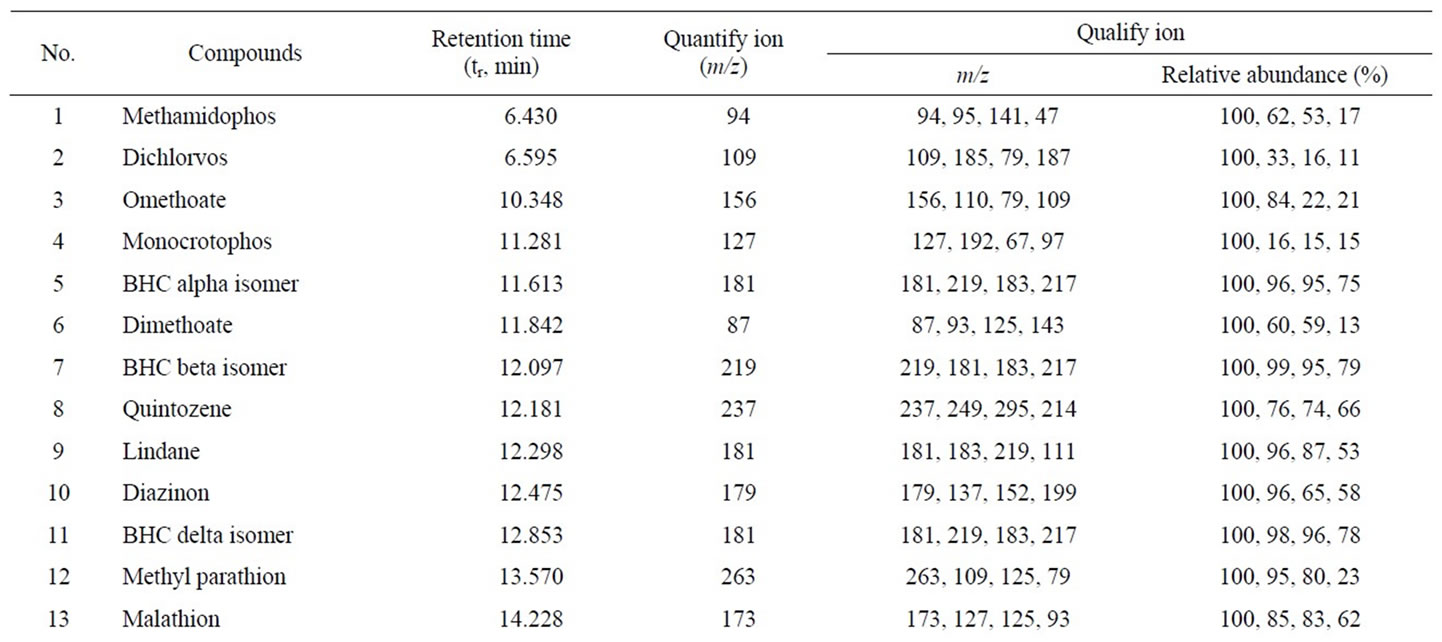
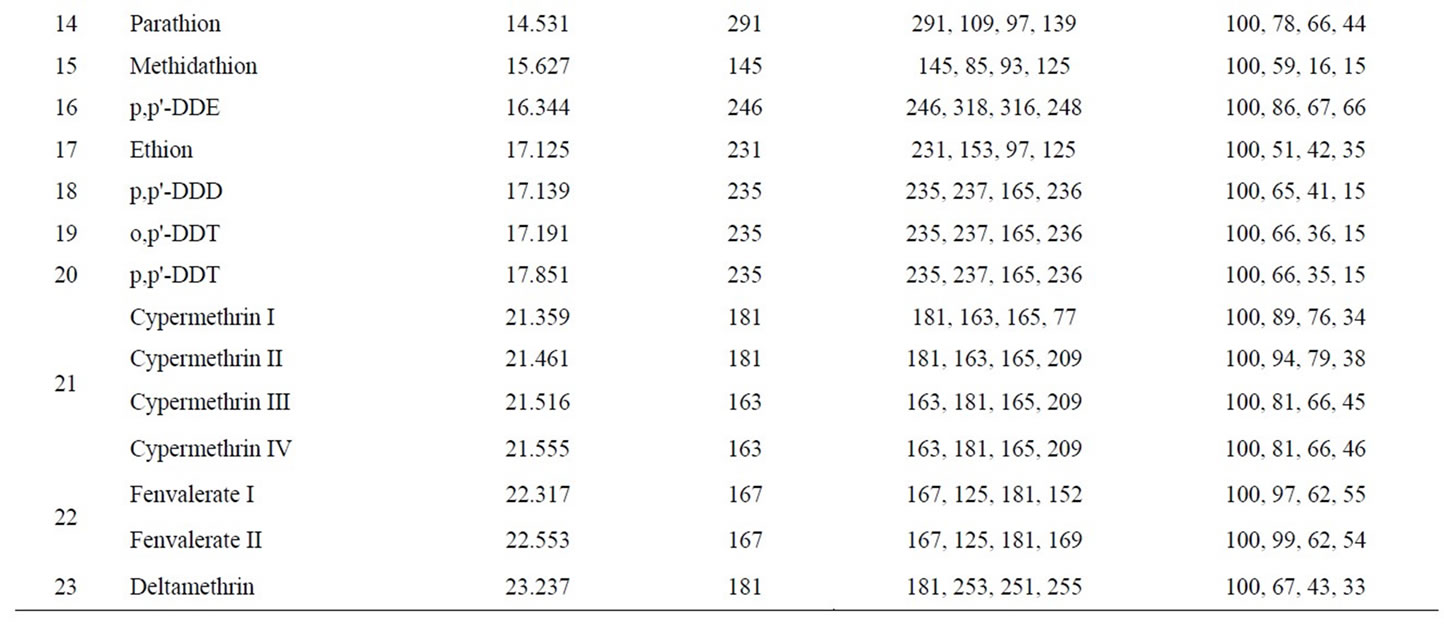
Table 2. GC-MS parameters for determination 23-pesticide residues in flos lonicerae.
3.3.1. Accuracy and Precision
Accuracy and precision were performed by the standard recovery test with artificial flos lonicerae sample. The standard recovery test was carried out at three levels of spiking concentration for each pesticide. Each spiking level was repeated three times to evaluate the precision. Accuracy was assessed by the standard added recoveries, and precision by the relative standard deviations (RSDs). Table 3 summarizes the standard added recoveries and RSDs for developed method.
The result in Table 3 showed that standard added recoveries were in the range of 87.1% - 110.9% at low spiked level (5.0 - 22.5 µg/kg), 86.4% - 107.1% at medium spiked level (8.2 - 45.0 µg/kg), and 71.9% - 108.5% at high spiked level (41.2 - 224.9 µg/kg). The linear regressions of the standard added concentration (x) versus peak area (y) of quantifying ion for all analytes yielded the correlation coefficients closing to 1.000, as shown in Table 3. These results suggest that the standard added recoveries for all pesticides are stable at low, medium, and high concentration, which made the developed method more practical and useful in real world sample analysis.
RSDs obtained were lower than 10% at all three added concentration levels, with the exception of 22.0% for p,p'-DDT at a high level of 214.9 µg/kg which may be interfered by the sample matrices. These results show that the developed method has a good reproducibility in the added concentration range.
3.3.2. Calibration
Matrix enhancement or reduction effect on the signal response is one of the most common problems in trace pesticides analysis for complex matrix samples [16,29]. In this work, the quantifications of all pesticides were car-
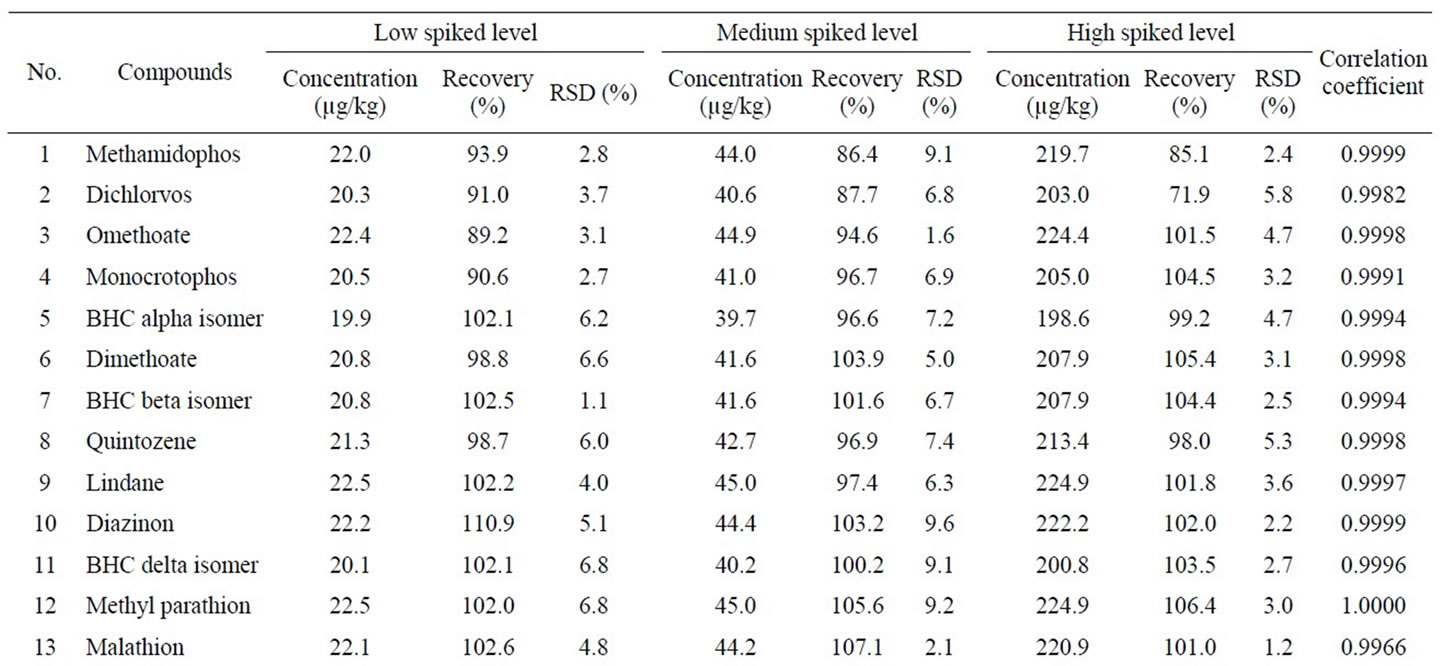
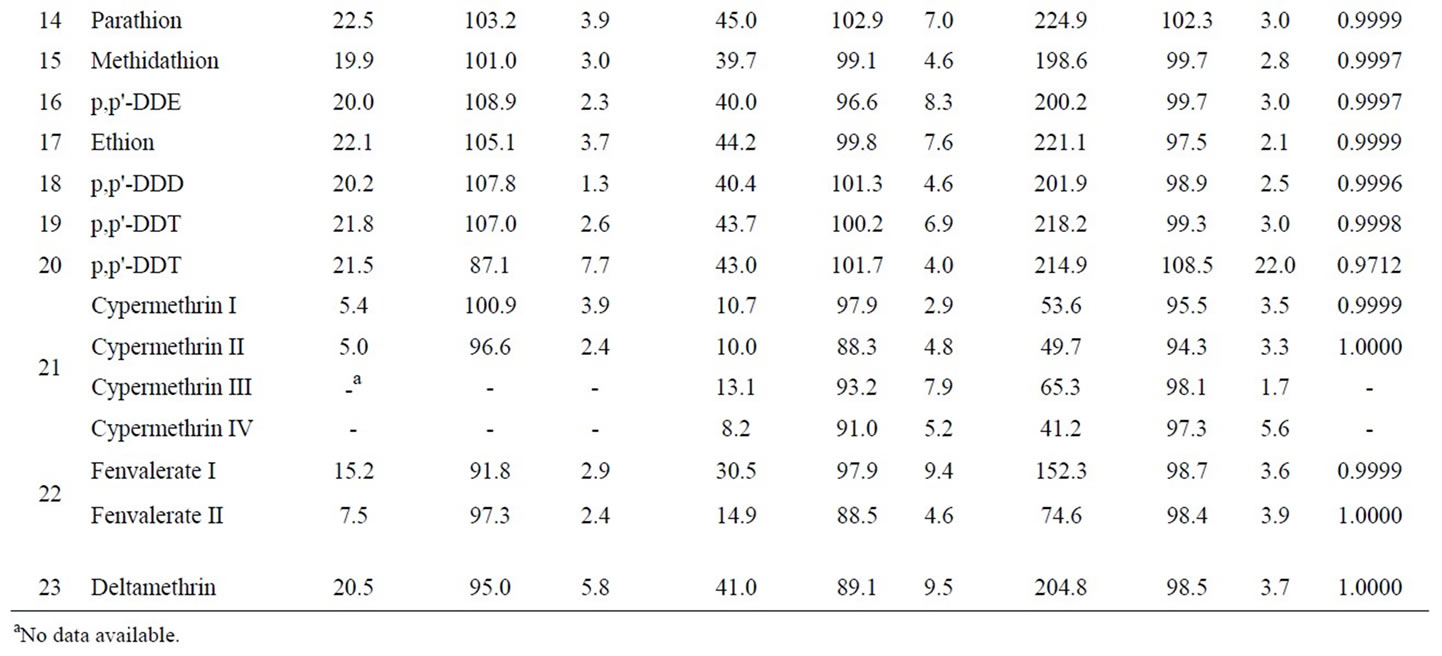
Table 3. Recovery, relative standard deviation and correlation coefficient of 23 pesticides in flos lonicerae by GPC-GC-MS.
ried out with matrix-matched external standard calibration method.
The calibration curves for quantification were obtained by measurement of a series of mixed pesticide standards. The standard series had 7 different concentration level between 10.0 and 1000.0 µg·L–1 as listed in Table 4. The linear curves were plotted by least squares regression of concentration versus peak area of each pesticide. The linear ranges and correlation coefficients were shown in Table 4.
3.3.3. Limits of Detection (LODs) and Limits of Quantification (LOQs)
The measurement of an artificial flos lonicerae sample, mixed standard added at 20 µg·kg–1, was repeated three times, including the pretreatment, extract, GPC purification, and GC-MS detection. The standard derivations (SDs) of the measurement for each pesticide were then calculated. Here Limits of detections (LODs) of the developed method were defined as the concentrations corresponding to 3 times of the standard deviations (SDs) of each analyte. LOD for each pesticide was in the range of 0.16 - 3.24 µg·kg–1, with the exception of malathion and p,p'- DDT which had no data available.
4. Conclusion
A method for simultaneous measurement of 23 organochlorine, organophosphorus, and pyrethroid pesticides in traditional Chinese medicine, flos lonicerae, using GPC
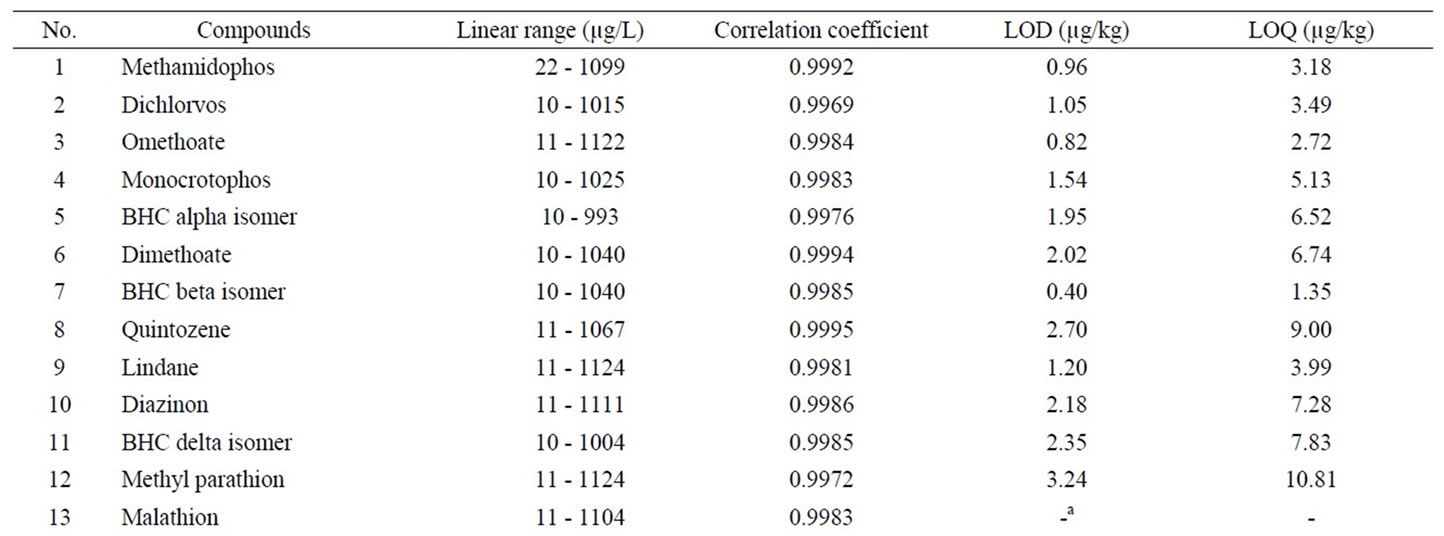
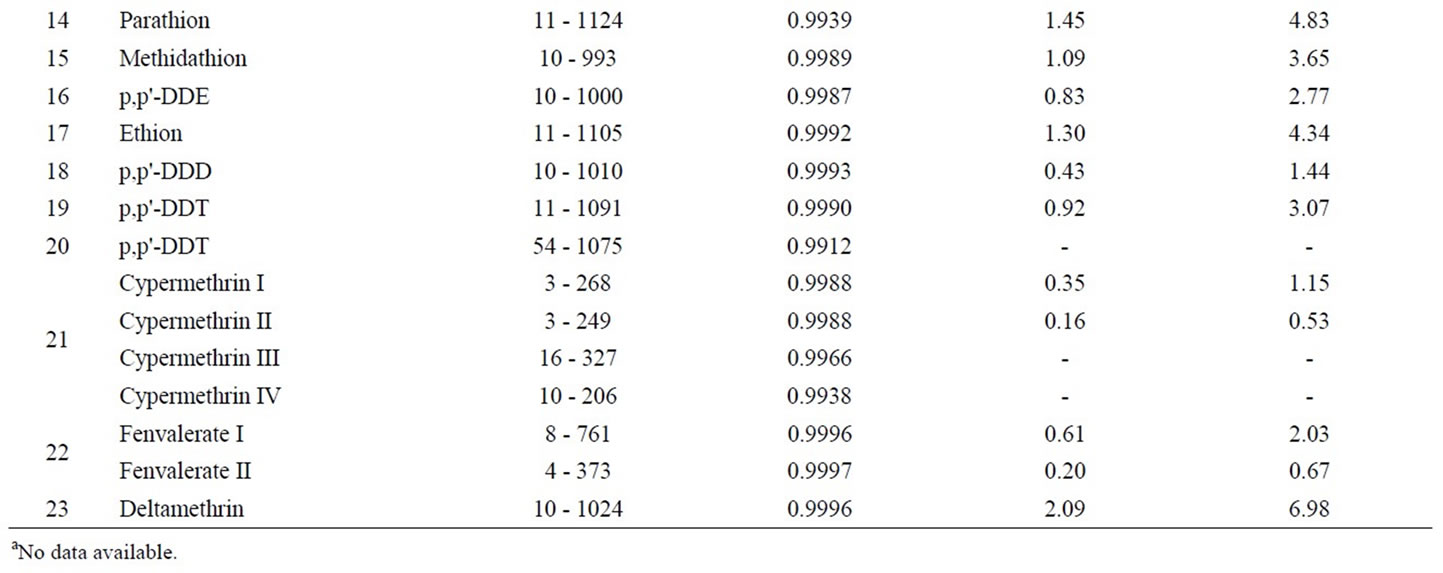
Table 4. Linear ranges, correlation coefficients, LODs and LOQs for 23 pesticides in flos lonicerae.
purification and GC-MS detection was developed. The method has good accuracy and precision, as well as low LODs. The method showed great prospects in determining common classes of pesticides in a typical traditional Chinese medicine.
5. Acknowledgements
This study is funded by the Natural Science Foundation of Fujian Province, PR China (B0220001). The authors thank Dr. Dengyun CHEN and all colleagues in the research group of Marine Analytical Chemistry for their assistance. Thanks also to the editor and anonymous for their comments that greatly improved the quality of the paper.
REFERENCES
- K. Chan, “Progress in Traditional Chinese Medicine,” Trends in Pharmacological Sciences, Vol. 16, No. 6, 1995, pp. 182-187. doi:10.1016/S0165-6147(00)89019-7
- K. Chan, “Some Aspects of Toxic Contaminants in Herbal Medicines,” Chemosphere, Vol. 52, No. 9, 2003, pp. 1361-1371. doi:10.1016/S0045-6535(03)00471-5
- P. Drasar and J. Moravcova, “Recent Advances in Analysis of Chinese Medical Plants and Traditional Medicines,” Journal of Chromatography B: Analytical Technologies in the Biomedical and Life Sciences, Vol. 812, No. 1-2, 2004, pp. 3-21. doi:10.1016/S1570-0232(04)00741-X
- E. Ernst, “Toxic Heavy Metals and Undeclared Drugs in Asian Herbal Medicines,” Trends in Pharmacological Sciences, Vol. 23, No. 3, 2002, pp. 136-139. doi:10.1016/S0165-6147(00)01972-6
- R. J. Huang, Z. X. Zhuang, Y. Tai, R. F. Huang, X. R. Wang and F. S. C. Lee, “Direct Analysis of Mercury in Traditional Chinese Medicines Using Thermolysis Coupled with Online Atomic Absorption Spectrometry,” Talanta, Vol. 68, No. 3, 2006, pp. 728-734. doi:10.1016/j.talanta.2005.05.014
- F. M. Li, Z. L. Xiong, X. M. Lu, F. Qin and X. Q. Li, “Strategy and Chromatographic Technology of Quality Control for Traditional Chinese Medicines,” Chinese Journal of Chromatography, Vol. 24, No. 6, 2006, pp. 537- 544. doi: 10.1016/S1872-2059(06)60022-9
- J. F. Deng, “Clinical and Laboratory Investigations in Herbal Poisonings,” Toxicology, Vol. 181, 2002, pp. 571- 576. doi:10.1016/S0300-483X(02)00484-5
- J. Jung, M. Hermanns-Clausen and W. Weinmann, “Anorectic Sibutramine Detected in a Chinese Herbal Drug for Weight Loss,” Forensic Science International, Vol. 161, No. 2-3, 2006, pp. 221-222. doi:10.1016/j.forsciint.2006.02.052
- J. Xue, L. L. Hao and F. Peng, “Residues of 18 Organochlorine Pesticides in 30 Traditional Chinese Medicines,” Chemosphere, Vol. 71, No. 6, 2008, pp. 1051- 1055. doi:10.1016/j.chemosphere.2007.11.014
- A. G. Frenich, P. P. Bolanos and J. L. M. Vidal, “Multiresidue Analysis of Pesticides in Animal Liver by Gas Chromatography Using Triple Quadrupole Tandem Mass Spectrometry,” Journal of Chromatography A, Vol. 1153, No. 1-2, 2007, pp. 194-202. doi:10.1016/j.chroma.2007.01.066
- S. N. Sinha and M. Odetokun, “Liquid Chromatography Mass Spectrometer (LC-MS/MS) Study of Distribution Patterns of Base Peak Ions and Reaction Mechanism with Quantification of Pesticides in Drinking Water Using a Lyophilization Technique,” American Journal of Analytical Chemistry, Vol. 2, No. 5, 2011, pp. 511-521. doi:10.4236/ajac.2011.25061
- S. Wang, P. Zhao, G. Min and G. Z. Fang, “Multi-Residue Determination of Pesticides in Water Using MultiWalled Carbon Nanotubes SolidPhase Extraction and Gas Chromatography-Mass Spectrometry,” Journal of Chromatography A, Vol. 1165, No. 1-2, 2007, pp. 166-171. doi:10.1016/j.chroma.2007.07.061
- P. Liu, Q. Liu, Y. Ma, J. Liu and X. Jia, “Analysis of Pesticide Multiresidues in Rice by Gas ChromatographyMass Spectrometry Coupled with Solid Phase Extraction,” Chinese Journal of Chromatography, Vol. 24, No. 3, 2006, pp. 228-234. doi:10.1016/S1872-2059(06)60011-4
- C. S. Roegge, O. A. Timofeeva, F. J. Seidler, T. A. Slotkin and E. D. Levin, “Developmental Diazinon Neurotoxicity in Rats: Later Effects on Emotional Response,” Brain Research Bulletin, Vol. 75, No. 1, 2008, pp. 166- 172. doi:10.1016/j.brainresbull.2007.08.008
- R. McKinlay, J. A. Plant, J. N. B. Bell and N. Voulvoulis, “Calculating Human Exposure to Endocrine Disrupting Pesticides Via Agricultural and Non-Agricultural Exposure Routes,” Science of the Total Environment, Vol. 398, No. 1-3, 2008, pp. 1-12. doi:10.1016/j.scitotenv.2008.02.056
- A. G. Frenich, J. L. M. Vidal, A. D. C. Sicilia, M. J. G. Rodriguez, P. P. Bolanos and R. G. A. C. Contaminan, “Multiresidue Analysis of Organochlorine and Organophosphorus Pesticides in Muscle of Chicken, Pork and Lamb by Gas Chromatography-Triple Quadrupole Mass Spectrometry,” Analytica Chimica Acta, Vol. 558, No. 1-2, 2006, pp. 42-52. doi:10.1016/j.aca.2005.11.012
- Y. C. Ling, H. C. Teng and C. Cartwright, “Supercritical Fluid Extraction and Clean-up of Organochlorine Pesticides in Chinese Herbal Medicine,” Journal of Chromatography A, Vol. 835, No. 1-2, 1999, pp. 145-157. doi:10.1016/S0021-9673(98)01077-2
- M. Barriada-Pereira, E. Concha-Grana, M. J. GonzalezCastro, S. Muniategui-Lorenzo, P. Lopez-Mahia, D. PradaRodriguez and E. Fernandez-Fernandez, “MicrowaveAssisted Extraction Versus Soxhlet Extraction in the Analysis of 21 Organochlorine Pesticides in Plants,” Journal of Chromatography A, Vol. 1008, No. 1, 2003, pp. 115- 122. doi:10.1016/S0021-9673(03)01061-6
- P. P. Bolanos, A. G. Frenich and J. L. M. Vidal, “Application of Gas Chromatography-Triple Quadrupole Mass Spectrometry in the Quantification-Confirmation of Pesticides and Polychlorinated Biphenyls in Eggs at Trace Levels,” Journal of Chromatography A, Vol. 1167, No. 1, 2007, pp. 9-17. doi:10.1016/j.chroma.2007.08.019
- Z. Q. Huang, Y. J. Li, B. Chen and S. Z. Yao, “Simultaneous Determination of 102 Pesticide Residues in Chinese Teas by Gas Chromatography-Mass Spectrometry,” Journal of Chromatography B-Analytical Technologies in the Biomedical and Life Sciences, Vol. 853, No. 1-2, 2007, pp. 154-162. doi:10.1016/j.jchromb.2007.03.013
- S. H. Hong, U. H. Yim, W. J. Shim, J. R. Oh, P. H. Viet and P. S. Park, “Persistent Organochlorine Residues in Estuarine and Marine Sediments from Ha Long Bay, Hai Phong Bay, and Ba Lat Estuary, Vietnam,” Chemosphere, Vol. 72, No. 8, 2008, pp. 1193-1202. doi:10.1016/j.chemosphere.2008.02.051
- S. B. Singh, G. D. Foster and S. U. Khan, “Determination of Thiophanate Methyl and Carbendazim Residues in Vegetable Samples Using Microwave-Assisted Extraction,” Journal of Chromatography A, Vol. 1148, No. 2, 2007, pp. 152-157. doi:10.1016/j.chroma.2007.03.019
- M. G. D. Silva, A. Aquino, H. S. Drea and S. Navickiene, “Simultaneous Determination of Eight Pesticide Residues in Coconut Using Mspd and Gc/Ms,” Talanta, Vol. 76, No. 3, 2008, pp. 680-684. doi:10.1016/j.talanta.2008.04.018
- C. Lesueur, P. Knittl, M. Gartner, A. Mentler and M. Fuerhacker, “Analysis of 140 Pesticides from Conventional Farming Foodstuff Samples after Extraction with the Modified Quechers Method,” Food Control, Vol. 19, No. 9, 2008, pp. 906-914. doi:10.1016/j.foodcont.2007.09.002
- T. D. Nguyen, E. M. Han, M. S. Seo, S. R. Kim, M. Y. Yun, D. M. Lee and G. H. Lee, “A Multi-Residue Method for the Determination of 203 Pesticides in Rice Paddies Using Gas Chromatography/Mass Spectrometry,” Analytica Chimica Acta, Vol. 619, No. 1, 2008, pp. 67-74. doi:10.1016/j.aca.2008.03.031
- T. D. Nguyen, J. E. Yu, D. M. Lee and G. H. Lee, “A Multiresidue Method for the Determination of 107 Pesticides in Cabbage and Radish Using Quechers Sample Preparation Method and Gas Chromatography Mass Spectrometry,” Food Chemistry, Vol. 110, No. 1, 2008, pp. 207-213. doi:10.1016/j.foodchem.2008.01.036
- B. Hu, W. Song, L. Xie and T. Shao, “Determination of 33 Pesticides in Tea Using Accelerated Solvent Extraction/Gel Permeation Chromatography and Solid Phase Extraction/Gas Chromatography-Mass Spectrometry,” Chinese Journal of Chromatography, Vol. 26, No. 1, 2008, pp. 22-28. doi:10.1016/S1872-2059(08)60009-7
- F. Goni, R. Lopez, A. Etxeandia, E. Millan, A. Vives and P. Amiano, “Method for the Determination of Selected Organochlorine Pesticides and Polychlorinated Biphenyls in Human Serum Based on a Gel Permeation Chromatographic Clean-Up,” Chemosphere, Vol. 76, No. 11, 2009, pp. 1533-1539. doi:10.1016/j.chemosphere.2009.05.041
- C. Ferrer, M. J. Gomez, J. F. Garcia-Reyes, I. Ferrer, E. M. Thurman and A. R. Fernandez-Alba, “Determination of Pesticide Residues in Olives and Olive Oil by Matrix Solid-Phase Dispersion Followed by Gas Chromatography/Mass Spectrometry and Liquid Chromatography/ Tandem Mass Spectrometry,” Journal of Chromatography, A, Vol. 1069, No. 2, 2005, pp. 183-194. doi:10.1016/j.chroma.2005.02.015
NOTES
*Corresponding author.