Journal of Power and Energy Engineering
Vol.05 No.08(2017), Article ID:78496,16 pages
10.4236/jpee.2017.58005
Historical Satellite Data Analysis to Enhance Climate Change Adaption and Hydrologic Models in Egypt
Mariam G. Salem1, Eman A. H. El-Sayed2
1Environment and Climate Changes Research Institute, National Water Research Center, Delta Barrages, Egypt
2Water Resources Research Institute, National Water Research Center, Delta Barrages, Egypt

Copyright © 2017 by authors and Scientific Research Publishing Inc.
This work is licensed under the Creative Commons Attribution International License (CC BY 4.0).
http://creativecommons.org/licenses/by/4.0/


Received: June 17, 2017; Accepted: August 14, 2017; Published: August 17, 2017
ABSTRACT
Egypt suffers from the impacts of climate change. Adaption plans should solve the shortage in water resources and increase the use of renewable energy. Detailed data on rainfall as non conventional water and detailed data on potential renewable energy are important. The added value of this research is to investigate the suitability of satellite data locally in North Sinai in Egypt. The Tropical Rainfall Measuring Mission (TRMM) satellites and available data from ground rain gauges are studied at North Sinai of Egypt. Local multiplication factors and correlation equations on a monthly basis were developed based on short term historical data. General equation based on short term data was developed to enhance TRMM data for the rainy season to minimize spatial and temporal errors. This equation would be very useful, especially in the ungauged areas in North Sinai to adjust TRMM rainfall data. TRMM data are spatially distributed, so it enhances the hydrology models for runoff estimation. This runoff could be used as non conventional water resource. The runoff was estimated in the RasSudr area in the 2010 storm to be 3.6 (m3/s). The hydropower of this runoff was estimated and ranged from 15,135 to 57,352 (kWh). The solar energy is studied from (NASA) satellite data. The monthly averaged solar energy was estimated to get possible generated power from the solar panel at locations of rainfall ground stations. The generated solar energy would supply self-sufficient energy for ground stations measuring instruments rather than batteries. The results show that a small solar panel project of 200 (m2) could safe electric network power by generating about 20,385 (kWh/year). The results of this study could help in enhancing adapting plans for climate change and runoff estimation model that needs grid data, especially in the area lacking ground data.
Keywords:
Tropical Rainfall Measuring Mission Data Analysis, Hydrologic Model, Bias Factor, Renewable Power Generation, Climate Change, RS, GIS

1. Introduction
The most challenging for Egypt is rapid declines in water resources, rapid declines in energy, and the potential threats of climate change. FAO puts priority for Egypt in adapting to the impacts of climate change and conserving natural water and energy resources, FAO Egypt [1] . Met Office Hadley Centre studied climate observations, projections, and impacts in Egypt. Met Office reported that Egypt suffers from the impacts of climate change, especially on its water resources. Understanding the climate is essential for adaptation plans, Met Office Hadley Centre [2] .
Egypt’s water resource adaptation plans are essential for future development. Adaptation plans should include rainwater harvesting, extraction of groundwater, water recycling, and desalination to enhance Egypt’s ability to cope with water shortage, Agrawala et al. [3] . Egypt has limited water resources. Therefore, Egypt should use non-conventional water resources to overcome water shortage. Rainwater harvesting is important and Egypt should address this issue seriously due to water scarcity.
Climate change will make things worse, so Egypt should focus on non-con- ventional water resources development anyway. Rainwater harvesting is one solution, especially in northern regions, Abdel-Shafy et al. [4] . Egypt suffers from increasing population beside water shortage. More storage of non conventional water, especially rainfall could give surplus water demands in times of water shortage. Rainfall could be harvested to add some millions (m3/year), El-Bar- bary, Sallam [5] . Egypt is located in sub-tropical region that affects its climate. It is close to a high atmospheric pressure belt and sandwiched between the vast continental land masses of Africa and Asia. Rainfall is significant along the northern coastal strip with average total annual rainfall of 196 (mm), Met Office Hadley Centre [2] .
Rainfall occurs in the northern strip of Egypt in winter. The average annual amount of utilized rainfall water is estimated to be 1.3 (BCM/year). This amount is not used efficiently because of lack of measuring data describing rainfall spatially and temporally, Ministry of Water Resources and Irrigation, Egypt [6] . Rain gauges and satellites, remote sensing could provide rainfall data temporally and spatially. Rainfall varies from region to another. Rain gauge was used to measure rainfall at ground stations. Recently, satellite has given real time rainfall with better spatial distribution than rain gauges, Gomez [7] .
Many researchers have studied differences between satellite and ground rainfall data for rainfall measurement validation in many areas in the specific areas worldwide, Condom et al. [8] , Gomez [7] , Bowman [9] , Bowman et al. [10] , Georgakakos et al. [11] , Valdés-Pineda et al. [12] , and Haigen et al. [13] .
The added value of this research is to evaluate the suitability of satellite data locally in north Sinai in Egypt. Bowman [9] studied long term rainfall in Ocean Bouys in the tropical Pacific. He estimated the bias between a set of gauges and the Tropical Rainfall Measuring Mission (TRMM) data. He founded that TRMM is very little bias with respect to the gauges with an R2 of 0.97. Condom et al. [8] estimated the spatial and temporal rainfall in regions located above 3000 (m) in the mountainous areas of the Peruvian Andes. They collected ground gauges rainfall and TRMM 3B43 monthly rainfall data from 1998 to 2007. They found that in situ data were greater than the TRMM 3B43 data. Gomez [7] studied rainfall in Oruro, Bolivia from 1998 to 2005. He compared 22 rainfall ground stations with TRMM satellite data. He concluded that the relevance of the comparison analysis is reliable for the studied working area, thus future studies should test the correlation between TRMM and ground data locally for each region.
UNDP [14] addresses water scarcity in the Arab region to secure the future. Arab countries suffer from vulnerable water resources, both conventional water resources (rivers and groundwater) and non conventional (desalinated water, wastewater, drainage water, rainwater harvesting). Threats include pollution, overexploitation and climate change. Urgent solutions should be initiated before reaching the verge of water depletion. The impacts of climate change and demographic and economic growth nearly decrease water in the Arab region by 15 per cent of what it was in 1960. Egypt depends mainly on surface water. The objectives of this study are:
・ Study the correlation between TRMM and ground stations locally in North Sinai of Egypt to compare distributed data with point data, where potential rainfall is available;
・ Get correlation equations based on short term 5 year period on a monthly basis to help in the assessment and verification process of satellite data;
・ Adjust a hydrological model to read spatial distributed rainfall (TRMM) and point rainfall (Ground station) to estimate the runoff volume and discharge;
・ Study rainfall runoff harvesting and hydropower at RasSudr to optimize use of non conventional rainfall runoff and renewable energy;
・ Study the monthly averaged insolation and estimate solar energy generation to supply self-sufficient power to ground rainfall station.
2. Methodology
The study area is located in Egypt representing the northern half of the Sinai Peninsula. North Sinai total area is about 27,574 (km2) as shown in Figure 1. The elevation varies from about 500 m above sea level at the mountainous area to the Mediterranean Sea level at the flat area. The population was about 434,781 at 2015. The majority of the population lives in urban areas. People live in urban

Figure 1. Map of the study area and ground rainfall gauges locations. Base map is a mosaic land sat images.
areas are 261,686; while people live in rural areas are 173,095, Wikipedia [15] . Figure 2 shows the methodology flow chart. The methodology steps are as follows:
1. Collect local short term 5 years satellite TRMM rainfall within the study area;
2. Collect ground rainfall data for the same short term 5 years within the study area;
3. Estimated factors between TRMM and ground to present local spatial and temporal distribution;
4. Develop local short term 5 years monthly correlation equations to enhance TRMM in North Sinai;
5. Estimate runoff in RasSudr area in the 2010 storm and estimate the hydropower of this runoff;
6. Calculate power generation from solar panel at ground station locations.
2.1. Local Short Term TRMM Data
The monthly TRMM satellite data were downloaded locally in North Sinai for short term period from 2005 to 2010. The 3B43 TRMM is NetCdf fine grid cell size 0.25 × 0.25 degree. TRMM 3B43 is a monthly average in (mm/hr) for easy comparison because the total days in each month are different. The 3B43 TRMM data are converted from (mm/hr) by multiplying the hourly rain rate with 24 (hr) with the total days in that month.

Figure 2. Methodology flow chart.
2.2. Local Short Term Ground Rainfall Data
Eight ground rainfall data were collected from the Egyptian Meteorological Authority for the period from 2005 to 2010. The ground rainfall stations were locally distributed over the entire area of North Sinai in northern Egypt. The total monthly values of rainfall for each ground station were estimated for the rainy season from December to March. Local ground stations short term data were interpolated by Kriging method to generate the monthly raster grid. The grid cells were generated to coincide with TRMM grid.
2.3. Local Short Term Correlation Equations
TRMM rainfall point values at each ground station were calculated locally in North Sinai by GIS tools. Point TRMM values were exported to work sheets. Differences between TRMM and ground values were calculated for each station for the rainy months from 2005 to 2010. These differences were used to filter the values to difference limits of ±10.
 (1)
(1)
where:
D: Local short term difference value between TRMM and ground rainfall station.
2.4. Local Short Term Factor Estimation
The local short term multiplication factors between ground and TRMM were estimated to present temporal and spatial distribution as follows:
 (2)
(2)
where:
F: Local short term multiplication factor.
2.5. Rainfall Runoff Estimation Using TRMM
In order to reduce the threat of flash floods due to heavy rainfall events and utilize its water in arid regions simulating flash flood becomes a crucial issue. Estimating runoff hydrograph is necessary in hydrological analysis to propose and design different protection and harvesting structures. The efforts to understand and to quantify rainfall amounts and its transition into flood are often hampered by the absence or paucity of appropriate monitoring station network. One of the most important and essential input parameters to hydrological model is the rainfall value, duration, time distribution and spatial distribution. One goal of this paper is to estimate flood peaks using satellite rainfall TRMM, additional to the in situ data. Then, this distributed rainfall is integrated with a hydrological model for flash floods simulation and runoff estimation. The analysis was applied to WadiSudr in Sinai Peninsula showing the feasibility to support flood management. The watershed of WadiSudr equipped for rainfall and runoff measurement in early 1990. The records for the rainfall and the runoff are used for model parameter calibration [16] . Recent runoff measurements are unavailable due to in situ obstacles. Watershed Modelling System WMS version 10.1 is used to delineate Sudr watershed and to compute its characteristics; length, area, slope, main stream length, etc. Also, it used to create the 2D grid of 500 × 500 (m) to use with loss rate method; grid SCS Curve Number and transformation method; Mod Clark. The grid daily rainfall data TRMM 3B42 of 17 January 2010 is converted from Asci format into DSS format with 3 hour time step.
2.6. Renewable Power Generation
The runoff water could operate a turbine and generate power at outlet point. The hydropower was estimated as follow:
 (3)
(3)
where:
g: Gravity (m2/s).
h: Head (m).
P: Power generated (kWh).
V: Runoff volume (m3).
η: Efficiency (%).
ρ: Runoff density (kg/m3).
The solar energy is studied from NASA surface meteorology and solar data. The solar panel power generation was calculated according to the following equation:
 (4)
(4)
where:
A: Solar panel Area (m²).
N: Number of days.
P: Power generated (kWh).
PR: Performance ratio.
R: Average solar radiation (kWh/m2/day).
η: Efficiency (%).
3. Results and Discussions
Georgakakos et al. [11] used METEOSAT data to estimate daily rainfall over rainy areas in the Nile River basin. Data for historical years 1992-1997 were used to determine the rainy areas. The estimates of daily rainfall were based on a dynamic regression relationship with rain gauge rainfall values over a 3 pixel × 3 pixel window centered at each rain gauge site. A conceptual hydrological model was run for the Blue Nile flow at Diem using satellite and ground gauges rainfall. Satellite data improves the spatial distribution of rainfall and improved flow simulation. Mahmoud [17] studied rainfall-runoff modelling in Egypt by using remote sensing and GIS. Annual runoff depth is estimated based on the annual rainfall and runoff coefficient. A variation from 0 to 180 (mm) was observed due to divergence in topography and climate in Egypt. The largest rainfall was in the northern part of the country. However, the result of the study indicates the absence of ground measurements of rainfall. Cools et al. [18] studied early warning system for flash floods in part of the Sinai in Egypt. They mentioned limited understanding of the wadi response to rainfall, due to the lack of rainfall data and observed flash flood events. They identified the obstacle of poor data, especially the spatial and temporal distribution of the rainfall.
In this research the monthly TRMM is compared with ground stations. TRMM is freely downloaded and has a fine grid resolution of 0.25 × 0.25 (degree). TRMM is widely used in satellite-rainfall studies. Historical short term 5 years TRMM data of 2005-2010 were studied in North Sinai. The local short term monthly bias between the satellite and the ground gauges is estimated by correlating the average rainfall in space and time.
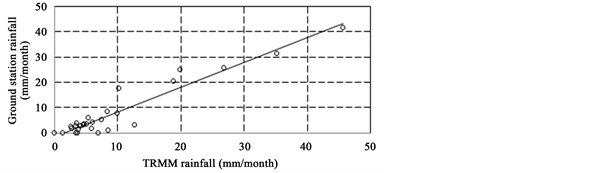
After estimating the differences between TRMM and ground values, the differences were used to filter the values to difference limits of ±10. The filtered rainfall values were used to develop local short term monthly equations to correct TRMM in North Sinai. Local short term monthly data of TRMM and ground stations have good correlation with STDEV ranged from 1.96 to 3.23 as shown in Figure 3 and Table 1. The application condition of these developed formulas equations are locally for north Sinai region.
 (a)
(a) (b)
(b)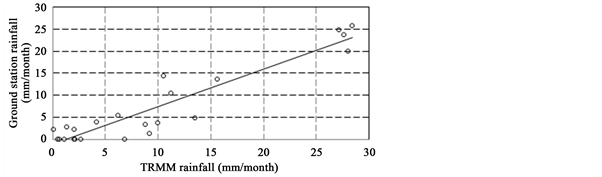 (c)
(c)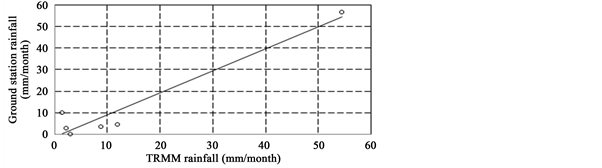 (d)
(d)
Figure 3. Local short term relationship between TRMM and ground data in North Sinai. (a) Jan., (b) Feb., (c) Mar., (d) Dec.

Table 1. Developed local short term monthly correlation equations in North Sinai.
Satellites have sensors that measure rainfall. Sensors are accurate with space as they measure integrated rainfall in its view. It takes an average time of rainfall to fall down. So it is poorer with time. Satellites give data for certain location once or 4 times every day when it orbits the earth, so it has error with time if it rains at locations when the satellite is not in its view. While, the ground gauges measure in site data so they are always better with time and poor with a space. The comparison between satellite and ground gauge data is important to minimize spatial and temporal errors, Bowman [9] . Haigen et al. [13] studied TRMM in Weihe River catchment in China. Rainfall was occurring from July to September in the form of storms. Seven rain gauges data were compared with TRMM from 2001 to 2010 to understand the impact of rainfall on the hydrological simulation. The accuracy of the satellite data was evaluated against the rain gauge observations. The results get good linear relationships between TRMM and rain gauge with R2 varying from 0.78 to 0.89 for the individual stations. In this study, short term 5 years’ data from 2005-2010 for rainy season from December to March were analyzed. General local short term equation was developed to correct TRMM data. The equation based on 2 parameters. The first parameter is TRMM value and the second parameter is the month value as follows:
 (5)
(5)
where:
X1: TRMM rainfall (mm/month).
X2: Month.
Y: Developed local short term ground station rainfall (mm/month).
The term 0.9/X2 in the equation is used to get developed rain in a certain month, for example for January X2 = 1, for February X2 = 2, etc. Figure 4 shows the values of the developed local short term equation and real ground values. The STDEV was 1.67. The application condition of this developed formula equation is locally for north Sinai region. The results are consistent with previous studies, Haigen et al. [13] in Weihe River catchment in China; Bowman [9] ; Bowman et al. [10] in the tropical Pacific, and Gomez [7] in Oruro, Bolivia. The added value of this research is the developed local equation for North Sinai.
After estimating the local short term multiplication factors between ground and TRMM, maps were generated to present spatial and temporal distribution.

Figure 4. Verification of local developed equation with short term 5 years ground data in North Sinai.
Figure 5 shows local short term bias multiplication factor maps between TRMM satellite data and ground station data for rainy season from 2005 to 2010 in North Sinai. Local maps of average bias multiplication factors were generated for months; January, February, March, and December in North Sinai, Figure 6. These maps can be used to correct the satellite TRMM rainfall data locally in North Sinai. Figure 5 and Figure 6 in the research are for rainy months Jan., Feb., Mar., and Dec., rest of the year almost has no rains.
After preparing all the hydrological model input data with WMS, the model is exported to HEC-HMS hydrological model as shown in Figure 7. Ground record of the same storm of 17 January 2010 is used in the hydrology model. Figure 8 shows the simulated flow hydrographs which are produced using the ground gauge and TRMM rainfall data. The figure shows general agreement between the two simulated hydrographs. According to this comparison, it appears that TRMM rainfall data have the potential to be suitable especially in developing countries. The model results for TRMM and ground rainfall data shows that the peak discharge is 3.8 and 3.6 (m3/s) and the volume is 276.9 and 307.7 (thousand m3) respectively. This result shows good agreement between TRMM and ground rainfall data for this specific storm.
After studying rainfall runoff in RasSudr, the hydropower was estimated. The ASTER Global Digital Elevation Model (GDEM) of Ras Sudr was downloaded from Earth Explorer to calculate turbine head. The proposed turbine is of kinetic energy type with 95% efficiency. Kinetic energy turbine does not need large civil works. It can use existing weir structures at Ras Sudr. The head of the proposed turbine at runoff streams is ranging from 19 - 72 (m), Figure 9. The estimated turbine hydropower at Ras Sudr runoff in 2010 storm ranged from 15,135 to 57,352 (kWh). This potential renewable energy at Ras Sudr could be used in different purposes such as desalinating seawater and brackish groundwater.

Figure 5. Local short term bias multiplication factors between TRMM satellite and ground station data for rainy season in North Sinai.

Figure 6. Local short term maps of average bias multiplication factors for months; January, February, March, and December in North Sinai.
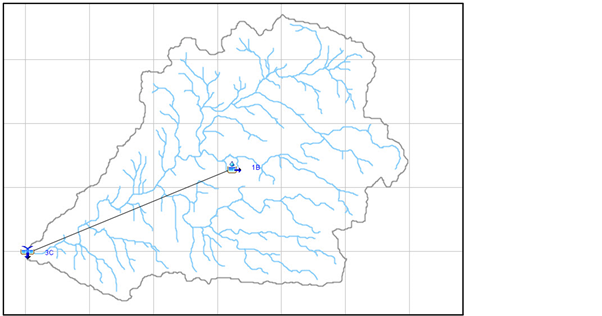
Figure 7. HEC-HMS hydrology model of Wadi Sudr.
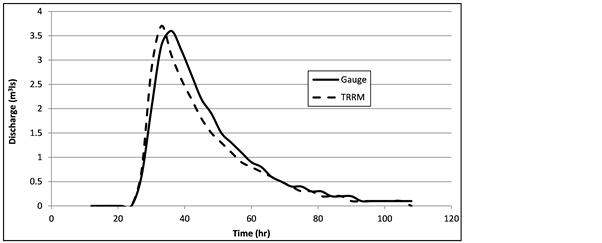
Figure 8. Comparison of discharge using the ground gauge and TRMM rainfall data.

Figure 9. Cross section A-B at Ras Sudr outlet drainage channel, base map is ASTER digital elevation model at proposed turbine outlet.
The monthly averaged insolation incident on a horizontal surface (kWh/m2/day) was studied at the locations of ground rain stations. The insolation incident has high potential ranges from 2.7 (kWh/m2/day) in winter months to 8.5 (kWh/m2/day) in the summer months as shown in Figure 10. The generated power from solar panel for area of 200 (m2) and solar panel efficiency 6.5% was calculated and shown in Table 2. A small solar panel project of 200 (m2) would safe electric network by generating about 20,385 (kWh/year). The generated solar energy could be used to operate rainfall ground station rather than batteries. This would supply Self-sufficiency energy for ground stations measuring instruments. Tang et al. [19] developed Graphene solar panel that could generate power from the sun and rain. These solar panels could also be used to generate power from raindrops in cloudy weather and winter seasons in low sunny days.
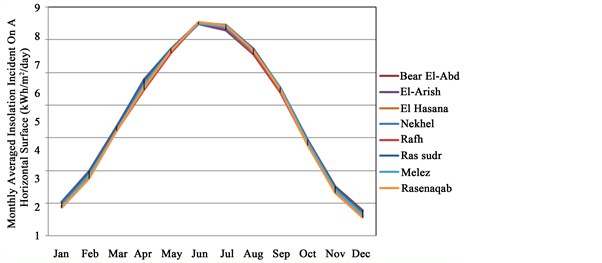
Figure 10. Monthly averaged insolation incident on a horizontal surface (kWh/m2/day) at locations of ground rainfall stations in North Sinai.
Table 2. Generated power from solar panel.
4. Conclusion and Recommendations
Egypt suffers from the negative impacts of climate change, especially on its water resources. Egypt’s water resource adaptation plans are essential for future development. Therefore, Egypt should use non-conventional water resources to overcome water shortage. Rainwater harvesting is one solution, especially in northern regions. Detailed data of rainfall are important to better estimate this amount of non conventional water. The rainfall from the (TRMM) satellite is compared with the available data from ground rain gauges at the north Sinai of Egypt. The results of this research are short term local bias correlation factors and equations on a monthly basis. The short term developed equations are useful in estimating more accurate rainfall grid. Also, TRMM distributed rainfall data could adjust and enhance hydrologic model to estimate runoff water as non-conventional source of water locally in North Sinai in Egypt. This runoff in Ras Sudr area in 2010 storm was estimated to be 3.6 (m3/s) that could operate a turbine to generate hydropower. The estimated turbine hydropower at Ras Sudr runoff in 2010 storm ranged from 15,135 to 57,352 (kWh). This potential renewable energy at Ras Sudr could be used to desalinate seawater and brackish groundwater. The generated power from solar panels is estimated in the study area that would supply self-sufficient energy to operate ground stations measuring instruments. The results of this study would help in enhancing climate adaptation plans, according to the integrated use of available nonconventional water resources rainfall and renewable energy. It is recommended that more storms need to be studied to get the storm bias factor similar to the monthly bias factor proposed in this paper and to enhance the hydrologic model and accordingly get more accurate runoff estimation.
Acknowledgements
Thanks for Water Resources Research Institute for providing ground data and software.
Cite this paper
Salem, M.G. and El-Sayed, E.A.H. (2017) Historical Satellite Data Analysis to Enhance Climate Change Adaption and Hydrologic Models in Egypt. Journal of Power and Energy Engineering, 5, 56-71. https://doi.org/10.4236/jpee.2017.58005
References
- 1. FAO (2013) Egypt Country Programming Framework (CPF).
http://www.fao.org/3/a-bp605e.pdf - 2. Met Office Hadley Centre (2011) Climate: Observations, Projections and Impacts: Egypt. Produced by the Met Office.
- 3. Agrawala, S., Moehner, A., El Raey, M., Conway, D., Aalst, M.V., Hagenstad, M., et al. (2004) Development and Climate Change in Egypt: Focus on Coastal Resources and the Nile. Development and Climate Change Project OECD. Environment Directorate Environment Policy Committee. Working Party on Global and Structural Policies. Working Party on Development Co-operation and Environment.
- 4. Abdel-Shafy, H.I., EL-Saharty, A.A., Regelsberger, M. and Platzer, C. (2010) Rainwater in Egypt: Quantity, Distribution and Harvesting. Mediterranean Marine Science, 11, 245-257.
https://doi.org/10.12681/mms.75 - 5. El-Barbary, Z. and Sallam, G.A. (2004) Optimizing Use of Rainfall Water in East Desert of Egypt. 8th International Water Technology Conference, 73-81.
- 6. Ministry of Water Resources and Irrigation, Egypt (2014) Water Scarcity in Egypt: The Urgent Need for Regional Cooperation among the Nile Basin Countries.
http://www.mfa.gov.eg/SiteCollectionDocuments/Egypt%20Water%20Re
sources%20Paper_2014.pdf - 7. Gomez, M.R.S. (2007) Spatial and Temporal Rainfall Gauge Data Analysis and Compar-ison with TRMM Microwave Radiometer Surface Rainfall Retrievals. M.SC., International Institute for Geo-Information Science and Earth Observation Enschede.
https://www.itc.nl/library/papers_2007/msc/wrem/sandoval.pdf - 8. Condom, T., Rau, P. and Espinoza, J.C. (2010) Correlation of TRMM 3B43 Monthly Pre-cipitation Data over the Mountainous Areas of Peru during the Period 1998- 2007. Hydrological Processes. Published Online at Wiley Online Library.
- 9. Bowman, K.P. (2005) Comparison of TRMM Precipitation Retrievals with Rain Gauge Data from Ocean Buoys. Journal of Climate, 18, 178-190.
https://doi.org/10.1175/JCLI3259.1 - 10. Bowman, K.P., Phillips, A.B. and North, G.R. (2003) Comparison of TRMM Rainfall Re-trievals with Rain Gauge Data from the TAO/TRITON Buoy Array. Geophy- sical Re-search Letter, 30, 1-4.
https://doi.org/10.1029/2003GL017552 - 11. Georgakakos, K.P., Tsintikidis, D., Attia, B. and Roskar, J. (2001) Estimation of Pixel-Scale Daily Rainfall over Nile River Catchments Using Multi-Spectral METEOSAT Data. IAHS, 267, 11-15.
- 12. Valdés-Pineda, R., Demaría, E.M.C., Valdés, J.B., Sungwook, W. and Serrat-Cap- devila, A. (2016) Bias Correction of Daily Satellite-Based Rainfall Estimates for Hydrologic Forecasting in the Upper Zambezi, Africa. Hydrology and Earth System Sciences, 437, 1-28.
- 13. Haigen, Z., Shengtian, Y., Zhiwei, W., Xu, Z., Ya, L. and Linna, W. (2015) Evaluating the Suitability of TRMM Satellite Rainfall Data for Hydrological Simulation Using a Dis-tributed Hydrological Model in the Weihe River Catchment in China. Journal of Geo-graphical Sciences, 25, 177-195.
https://doi.org/10.1007/s11442-015-1161-3 - 14. UNDP (2013) Water Governance in the Arab Region. Managing Scarcity and Securing the Future.
- 15. Wikipedia Encyclopaedia (2016).
https://en.wikipedia.org/wiki/Representative_Concentration_Pathways - 16. El-Sayed, E.A. and Habib, E. (2008) New Technique for Rainfall-Runoff Simulation in Arid Region Case Study; Sinai Catchments, Egypt. The 3rd International Confe-rence on Water Resources and Arid Environments, Riyadh.
- 17. Mahmoud, S.H. (2014) Investigation of Rainfall-Runoff Modeling for Egypt by Using Remote Sensing and GIS Integration. Catena, 120, 111-121.
- 18. Cools, J., Vanderkimpen, P., El Afandi, G., Abdelkhalek, A., Fockedey, S., El Sammany, M., et al. (2012) An Early Warning System for Flash Floods in Hyper-Arid Egypt. Natural Hazards and Earth System Sciences, 12, 443-457.
https://doi.org/10.5194/nhess-12-443-2012 - 19. Tang, Q., Wang, X., Yang, P. and He, B. (2016) A Solar Cell That Is Triggered by Sun and Rain. Angewandte Chemie International Edition, 55, 5243-5246.
https://doi.org/10.1002/anie.201602114