Journal of Power and Energy Engineering
Vol.04 No.09(2016), Article ID:70593,9 pages
10.4236/jpee.2016.49005
An Investigation on the Flow Characteristics in the Cross-Flow Turbine-T15 300
Isack Amos Legonda
Department of Mechanical and Industrial Engineering, University of Dar es Salaam, Dar es Salaam, Tanzania

Copyright © 2016 by author and Scientific Research Publishing Inc.
This work is licensed under the Creative Commons Attribution International License (CC BY 4.0).
http://creativecommons.org/licenses/by/4.0/


Received: October 28, 2015; Accepted: September 11, 2016; Published: September 14, 2016
ABSTRACT
A study on the flow characteristics in the cross-flow turbine model T15 300 has been conducted. The study was designed to examine the fluid flow trajectory in the turbine and identify areas for further improvement. Computational fluid dynamics (CFD) approach was employed and the results were compared with experimental data. The simulation study was conducted at guide vane angle of 20o, 30o, 35o and 41o. The shaft diameter was set at 30 mm, 45 mm, 60 mm, and 75 mm for each head while the head was maintained at 50 m. The flow characteristics were determined using particles trajectory. The research findings showed that the optimal vane angle and shaft diameter for cross-flow turbine were 41o and 45 mm respectively. These results are in good agreement with experimental data from previous studies.
Keywords:
Cross-Flow Turbine, CFD, Hydropower

1. Introduction
Hydropower generation has been achieved through different turbine designs including cross-flow type. Cross-flow turbine has been used successfully for power generation since 1918 [1] . The majority of these turbines differ on the geometrical design and are normally characterized with a large range of operating conditions which require optimization [2] . The guide vane angle and head are among the parameters with significant effect to the turbine performance. The former controls the flow rate to the turbine blades while the latter is the potential energy. Controlling flow rate through guiding vane may also result into change of flow characteristics in the turbine.
Studies in cross-flow turbines using computational fluid dynamic tools have been conducted by a number of researchers [3] - [5] . Most of these studies dwelt on varying two mainly factors which are geometrical shape and operating parameters, such as head, flow rate, guide vane angle and others. In fact, these factors are believed to affect flow characteristics of any turbine which in turn dictates the performance of the turbine. Thus, characterizing the flow in the turbine could bring improvement through identification of areas causing increase of drag force.
Although the experimental data for the improved design have been established, the study on the flow characterization in the turbine is not yet known. Therefore, the aim of this study was to investigate the flow characteristics of the fluid in the cross-flow turbine model T15 300 using Computational Fluid Dynamics (CFD) deploying Fluent 14.5.
2. Methods and Data
2.1. Model Geometry
The use of CFD for characterizing flow in the turbines has been reported elsewhere [5] . In this study, a typical geometry of cross-flow turbine under investigation is shown in Figure 1. It should be noted that the guide vane angle was set at 20˚, 30˚, 35˚ and 41˚. Similarly, the effect of shaft diameter on fluid flow characteristics was studied at 30 mm, 45 mm, 60 mm and 75 mm as well as for the case of no shaft.
As seen from the model geometry, the fluid flows from Inlet then through the turbine blades and exits at the Outlet. The vent is provided to reduce negative pressure in the turbine resulting from recirculation zones. The geometry was meshed with tetrahedral cells and the maximum skewness achieved was 0.8. This mesh quality was good agreement with the recommended value of less than 0.95 [6] .

Figure 1. The Model Geometry. Key: 1. Inlet; 2. Guide vane; 3. Blades; 4. Shaft; 5. Vent; 6. Outlet.
2.2. Modelling Procedures
The characterization of fluid flow in the cross-flow turbine was predicted using standard, k-ɛ model. This model assumes that the flow is fully turbulent, and the effects of molecular viscosity as well as swirl are negligible. The transport equations for the flowing fluid in the computational domain were solved considering mainly turbulence kinetic resulting from velocity gradients and buoyancy effect as expressed in Equation 1. Solution methods for gradient, pressure and momentum were to Least Squares Cell Based, Standard and Second Order Upwind respectively while the turbulent kinetic energy and turbulent dissipation rate were set to Second Order Upwind. The Least Squares Cell Based was chosen due inexpensive at comparable accuracy with other methods [6] . Similarly, selection of Second Order Upwind considered its strength in stability for supersonic flows and captures shocks better than the first-order upwind scheme.
 (1)
(1)
where  and
and  are fluid density and turbulence kinetic energy respectively;
  represents the generation of turbulence kinetic energy due to the mean velocity gradients and
  is the generation of turbulence kinetic energy due to buoyancy;
  is the viscosity of the flowing fluid and
  represents Pranditl number.
2.3. Boundary Conditions
The turbines are sensitive to inlet conditions, specifically head [7] . Boundary conditions used in this model were derived from the experimental data summarized in Table 1. The temperature was taken at ambient condition while the pressure was derived from a head of 50 m considered for all modeling conditions. Vent and Outlet were set to pressure-outlet to simulate actual operating conditions for cross-flow turbines. Similarly, the Inlet was set to pressure-inlet based on the relationship described using Equation (2). Moreover, turbulent intensity and viscosity ration were set to 5% and 10 respectively to enhance decay rate.
 (2)
(2)
where  is the head in meter.
Furthermore, the power output from the turbine was expressed in terms of total pressure acting normal to the center of the turbine blade on Pitch Circle Diameter (PCD) illustrated in Figure 2. The resulting total pressure for all turbine blades ( ) was calculated using Equation (3).

Table 1. Parameters setting for boundary conditions.
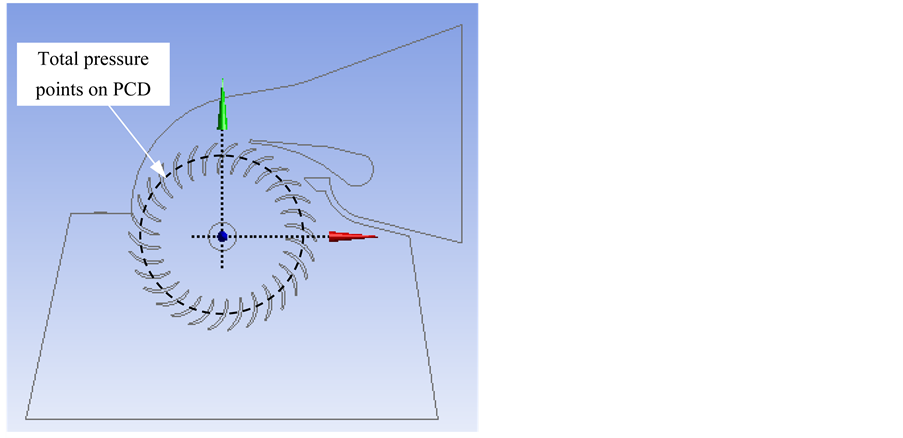
Figure 2. Turbine profile showing total pressure points.
 (3)
(3)
where  is the total pressure at turbine blade i and n is the total number of blades.
3. Results
3.1. Zones in the Cross-Flow Turbine
Figure 3 shows the contour of the flow pattern in the turbine. It can be seen from the figure that the cross-flow turbine can be divided into four zones located in quadrants I - IV respectively. Zone I and III are mainly dominated with negative pressures while Zone II and IV are dominated with positive pressures. These zones plays major role in improving turbine performance. The two positive zones are responsible for torque generation while negative suppresses power generation.
3.2. The Effect of Guide Vane Angle
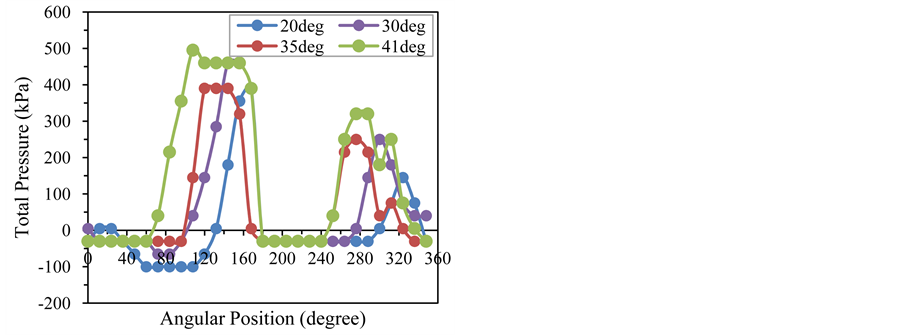
Figure 4(a) shows the total pressure in the turbine at different setting of the guide vane angle. It can be seen from the figure that the positive peaks showed increasing trend with increasing guide vane angle. Figure 4(b) compares the total pressure on the turbine blade responsible for torque generation. The pressure showed similar increasing trend as revealed in Figure 4(a).
There are several possible explanations of these results. The existence of negative pressure zones at turbine blades is usually associated with resistance force. This force could be responsible for the deficiency of the turbine. Similar findings have been also reported by Chen and Choi [3] in predicting the flow the cross-flow turbine. In fact, positive pressure is responsible for driving the turbine during power generation process. Thus, reduction of negative pressures in the turbine blades could result in an effective system performance.

Figure 3. Main flow zones of the cross-flow turbine.
 (a)
(a) (b)
(b)
Figure 4. The effect of guide vane angle on total pressure in the cross-flow turbine. (a) Total pressure profile in the turbine; (b) Resultant Total pressure.
Another finding reveals that the optimal angle established in this study was 41˚ which is in good agreement with the experimental data. The observed increase on turbine power output could be due to increased flow rate as well as improved fluid flow characteristics through reduction of recirculation zones.
3.3. The Effect of Shaft Diameter
The effect of shaft diameter on the fluid flow characteristics in the turbine was also determined. Figure 5(a) shows the total pressure at different shaft diameters of the turbine while Figure 5(b) provides total resultant total pressure at first peak (Pt) and second peak (P2t). It can be seen from Figure 5(a) and Figure 5(b) that there exists a slight difference in total pressure for all shaft diameters. In addition, the highest total pressure in zone III reached 1415 kPa with no shaft while with shaft 1380 kPa was recorded at 45 mm diameter. Furthermore the lowest value was obtained at 75 mm diameter. Another result in Figure 6 shows the contour of total pressure in the cross flow turbine at different shaft diameters. It can be seen from the figure that there exist a fluid flow separation past the shaft.
 (a)
(a) (b)
(b)
Figure 5. The effect of shaft diameter on total pressure in the cross-flow turbine. (a) Total pressure profile in the turbine; (b) Resultant Total pressure.
 (a)
(a)
 (b) (c)
 (d) (e)
Figure 6. Predicted total pressure profile in the turbine at different shaft diameters. (a) Contours of total pressure without shaft (Pa); (b) Contours of total pressure for shaft diameter 30 mm (Pa); (c) Contours of total pressure for shaft diameter 45 mm (Pa); (d) Contours of total pressure for shaft diameter 60 mm (Pa); (e) Contours of total pressure for shaft diameter 75 mm (Pa).
These results provide the evidence on the effect of shaft diameter on the flow characteristics in the cross flow turbine. The observed decrease in total pressure for peaks in zone III could be due to the flow separation resulted from the shaft. These findings suggests that the shaft diameter has slightly effect to the turbine performance and the optimal value ranges 30 - 60 mm. Similar findings have been reported earlier by Sammartano et al. [4] through experimental study of Cross-Flow Micro-turbine. Thus, shaft sizing can be determined based on material strength and respective cost implication.
3.4. Comparison of Model and Experimental Data
Figure 7 compares the trends for total pressure and efficiency of the cross-flow turbine. The values for efficiency were extracted from experimental performance test report conducted by Entec [7] . It can be seen from the figure that both trends were increasing with increasing guide vane angle. Further observation reveals that the change in total pressure for guide vane angle 30˚ - 35˚ is also similar to the respective efficiency trend.
The comparison presented in Figure 7 highlights strong correlation between efficiency and pressure in the cross-flow turbine. Another earlier study by Sammartano et al. [4] linked the inlet pressure and inlet velocity. Although turbine efficiency depends on the design geometry [8] , enhancing inlet pressure could lead to improved performance. In addition, pressure drop in turbine blades also need to be minimized. On the other hand, the results provide the degree of accuracy of the model results. The observed slightly difference could be due to the assumptions in model simulation. These findings suggest that the model prediction is in good agreement with the experimental data.
4. Conclusion
It has been shown that there exists sensitivity to the guide vane angle and shaft dia-

Figure 7. Comparison between model and experimental data.
meter on the overall performance of the turbine. The turbine output was found to increase with increasing guide vane angle and decreased with increasing shaft diameter above 45 mm. The optimal guide vane angle and shaft diameter were found to be 41o and 45 mm respectively. Furthermore, there exist two zones dominated with positive pressures and two zones with negative pressures. These findings suggest that cross- flow turbine can be divided into four zones for flow characterization. Furthermore, the larger the positive zone, the higher the performance of the turbine.
Cite this paper
Legonda, I.A. (2016) An Investigation on the Flow Characteristics in the Cross-Flow Turbine-T15 300. Journal of Power and Energy Engineering, 4, 52-60. http://dx.doi.org/10.4236/jpee.2016.49005
References
- 1. Josh, C.B., Seshadri, V. and Singh, S.N. (1995) Modifications in Cross Flow Turbine for Improvement. Indian Journal of Engineering & Material Sciences, 2, 261-267.
- 2. Sammartano, V., Aricò, C., Carravetta, A., Fecarotta, O. and Tucciarelli, T. (2013) Banki- Michell Optimal Design by Computational Fluid Dynamics Testing and Hydrodynamic Analysis. Energies, 6, 2362-2385.
http://dx.doi.org/10.3390/en6052362 - 3. Chen, Z.M. and Choi, Y.D. (2013) Performance and Internal Flow Characteristics of a Cross-Flow Turbine by Guide Vane Angle. IOP Conference Series: Materials Science and Engineering, 52, 1-6.
http://dx.doi.org/10.1088/1757-899X/52/5/052031 - 4. Sammartanoa, V., Morrealea, G., Sinagraa, M., Collurab, A. and Tucciarelli, T. (2014) Experimental Study of Cross-Flow Micro-Turbines for Aqueduct Energy Recovery. Procedia Engineering of the 16th Water Distribution System Analysis Conference, 89, 540-547.
- 5. Khan, M.A. and Badshah, S. (2014) Design and Analysis of Cross Flow Turbine for Micro Hydro Power Application Using Sewerage Water. Research Journal of Applied Sciences, Engineering and Technology, 8, 821-828.
- 6. (2009) ANSY-FLUENT-12.0, “Manual”.
- 7. Entec Consulting and Engineering (2014) Technical Report on Characteristics of Cross- Flow Turbine T15.
- 8. Nasir, B.A. (2013) Design of High Efficiency Cross-Flow Turbine for Hydro-Power Plant. International Journal of Engineering and Advanced Technology (IJEAT), 2, 308-311.