Open Journal of Forestry
Vol.07 No.02(2017), Article ID:75322,15 pages
10.4236/ojf.2017.72010
Above-Ground Carbon Sequestration during Restoration of Upland Evergreen Forest in Northern Thailand
Kanlayarat Jantawong1, Stephen Elliott2, Prasit Wangpakapattanawong3
1Environmental Science, Faculty of Science, Chiang Mai University, Chiang Mai, Thailand
2Forest Restoration Research Unit (FORRU), Department of Biology, Faculty of Science, Chiang Mai University, Chiang Mai, Thailand
3Department of Biology, Faculty of Science, Chiang Mai University, Chiang Mai, Thailand

Copyright © 2017 by authors and Scientific Research Publishing Inc.
This work is licensed under the Creative Commons Attribution International License (CC BY 4.0).
http://creativecommons.org/licenses/by/4.0/


Received: December 27, 2016; Accepted: April 7, 2017; Published: April 10, 2017
ABSTRACT
Tropical deforestation reduces the global terrestrial carbon sink and substantially contributes towards global climate change. Conversely, tropical forest restoration could help to mitigate the problem, but few measurements of how much carbon can be absorbed by forest restoration have been published. Therefore, this study used a partial harvesting method to compare carbon sequestration among 11 framework tree species (selected to accelerate forest regeneration by suppressing weeds and attracting seed dispersers), in a restoration trial in northern Thailand. The goal was to enable restoration practitioners to factor in carbon sequestration, when selecting tree species to plant. Above-ground carbon sequestration was derived from wood density, tree volume and above-ground biomass of 3 trees of each of 12 tree species, in 5, 10 and 14-year old restoration plots (RF5, RF10 and RF14, respectively). Wood density did not vary significantly with tree age (p ≤ 0.05), but it did differ significantly among tree species (p ≤ 0.05). Gmelina arborea wood was the densest (0.57 ± 0.10 g/cm3). Carbon concentration of stem wood did not vary significantly among tree species or age (p ≤ 0.05), averaging 44.67% (±0.54). Tree volume varied among the species in the youngest plot, but such variation declined with tree age. In the oldest plot (RF14), Erythrina subumbrans and Spondias axillaris grew significantly larger than the other species and sequestered the most above-ground carbon: 135.23 and 115.87 kgC/tree respectively. Bischofia javanica sequestered the least, only 9.80 kgC/tree. An even framework species mix would sequester 13.2, 44.3 and 105.8 tC/ha, 5, 10 and 14 years respectively after planting and would achieve carbon storage levels similar to those of nearby natural forest in 16 - 17 years. The framework species method is therefore capable of rapidly accumulating carbon, a property which, along with its acceleration of biodiversity recovery and provision of a wide range of forest products and ecological services to local people, meets both the requirements and safeguards of REDD+ projects.
Keywords:
Carbon Sequestration, Biomass, Forestry, Forest Restoration, REDD+

1. Introduction
Tropical forests are a major terrestrial sink for atmospheric CO2, absorbing about 18% of anthropogenic emissions ( IPCC, 2000 ). Tropical deforestation not only reduces the capacity of this CO2 sink, but it also directly adds CO2 to the atmosphere. From 2005 to 2010, tropical forest carbon stocks decreased by approximately 0.5 GtC/year ( FAO, 2010 ). From 1980 to 2005, tropical forest cover declined from 19.7 to 17.7 million km2 (−0.37% per year), contributing 6% - 17% towards total anthropogenic greenhouse gas emissions ( Scharlemann et al., 2010 ). In Southeast Asia, from 1990 to 2000, tropical deforestation resulted in carbon emissions of 0.47 GtC/year, or about 29% of the global net carbon, released from deforestation ( Kim Phat et al., 2004 ).
Conversely reforestation in the tropics could increase the carbon sink and remove substantial amounts of CO2 from the atmosphere. Realization of the significant contribution that tropical reforestation could make towards mitigating global climate change has led to what could be described as a global reforestation frenzy. In 2011, the Bonn Challenge set an ambitious goal to reforest 150 million hectares, worldwide, by 2020. Just 3 years later, at the 2014 UN Climate Summit, the New York Declaration on Forests increased this target to 350 million hectares by 2030, which would sequester an estimated 1.7 GtC/year; a substantial contribution towards climate change mitigation ( Bonn Challenge, 2011 ).
Developed under the UN Framework Convention on Climate Change (UNFCCC) REDD+ stands for Reducing Emissions from Deforestation and Forest Degradation in developing countries. This global initiative has given rise to policies and incentives to encourage forest conservation and sustainable ma- nagement and it has emerged as the main global vehicle to maintain and increase the global forest carbon sink. Originally conceived as a mechanism merely to reduce the rate at which CO2 from forest destruction entered the atmosphere, REDD+ was subsequently expanded to include “enhancement of carbon stocks” ( UNFCCC, 2007 ) i.e. removal of CO2 from the atmosphere by forest expansion. If the financial mechanisms, proposed by REDD+, materialize and are sustained, anthropogenic carbon emissions could be reduced by approximately 0.82 GtC/year, over 35 years (2015-2050), ( Khun & Sasaki, 2014 ). However, two important safeguards apply to REDD+ funding ( UNFCCC, 2010 ). Firstly, restoration must be carried out with the “full and effective engagement of indigenous peoples and local communities”, which means that restored forests should provide local communities with the same variety of forest products and ecological services, as the original forest formerly did. Secondly, actions must be “consistent with the conservation of natural forests and biological diversity and used to incentivize the protection and conservation of natural forests and their ecosystem services and to enhance social and environmental benefits”.
Neither of these safeguards is achieved by conventional plantations of fast- growing tree species ( Alexander et al., 2011 ). Consequently, “ecological restoration” ( Lamb, 2015 ) must be carried out to recreate structurally complex and biodiversity-rich forests, to meet both these safeguards. Therefore, the following definition applies:
“Forest restoration is directing and accelerating ecological succession towards an indigenous target forest ecosystem of the maximum biomass, structural complexity, biodiversity and ecological functioning that are self-sustainable within prevailing climatic and soil limitations.” ( Elliott et al., 2013 ).
Since the definition includes climate dependence, and climate change is unpredictable, restoration should also maximize ecosystem adaptability by maximizing species and genetic diversity and facilitating gene mobility. Forest restoration is most appropriate where the follow management objectives must be maximized and balanced: i) carbon sequestration (since biomass determines carbon storage); ii) biodiversity recovery (since structurally complex forests trend towards maximum equilibrium species richness) and/or iii) delivery of a diverse range of forest products (from biodiversity enhancement) and ecological services to communities.
The framework species method of forest restoration aims to satisfy all the above listed conditions. The method involves planting mixtures of 20 - 30 indigenous tree species that include both pioneer and climax species, that share the following characteristics: i) high survival rate, ii) rapid growth, iii) dense, spreading crowns and iv) attractiveness to seed-dispersing wildlife at a young age (by producing nectar-rich flowers or fleshy fruits) ( FORRU, 2006 ). The planted trees rapidly re-establish a multilayered canopy, which shades out weeds and provides diverse wildlife habitats. Seed-dispersing animals, attracted to the planted trees, disperse seeds from nearby forest into the restoration sites, leading to a highly diverse second generation of naturally established trees, along with ground flora species, epiphytes and woody climbers ( Elliott et al., 2013 ).
Twenty years ago, the Forest Restoration Research Unit of Chiang Mai University (FORRU-CMU) began to establish a chronosequence of framework species trial plots on abandoned agricultural land in the upper Mae Sa valley, Mae Rim district, Chiang Mai province. This plot system (planted annually from 1997 to 2013) now provides a unique opportunity to quantify the extent to which verified framework tree species sequester carbon at different ages.
More precise measurements of biomass and carbon sequestration in restoration projects are essential, to meet the monitoring and evaluation requirements of funders and to engage the beneficiaries of REDD+ programs ( IPCC, 2006a ). Young secondary forests and plantations, in the moist tropics, rapidly accumulate biomass, sequestering large amounts of carbon ( Raich et al., 2014 ). Tree biomass can be estimated by both destructive and non-destructive methods. How- ever, destructive sampling obviously defeats the objective of carbon storage, so partial harvesting methods are now being developed. They involve direct measurements of stem and branch volumes and wood density and taking samples without felling trees. The dry weight of each tree is calculated from multiplying tree volume by wood density ( Snowdon et al., 2002 ).
Therefore, this study compared the carbon sequestration potential of selected framework tree species, using a novel partial harvesting approach. The goal was to provide input on the choice of species to maximize overall benefits of future forest restoration plantings.
2. Materials and Methods
2.1. Study Area
The study area was in the Upper Mae Sa Valley, Mae Rim district, Chiang Mai Province, Thailand (at 18˚52'N and 98˚51'E) at 1200 to 1400 m elevation. The average temperature was 26.8˚C, with a dry season from November to April and a wet season from May to October (Figure 1).
Small fragments of disturbed, primary, upland, seasonally dry, evergreen forest remained in the valley, with a high frequency of tree species in the Fagaceae, such as Castanopsis diversifolia and C. tribuloides. A system of trial forest restoration plots had been established, using the framework species method from 1997 to 2013, by planting tree saplings 30 - 50 cm tall, 1.8 m apart, followed by fire prevention measures and weeding and fertilizer application 3 times per rainy season for 2 years after planting. The plot system forms a wildlife corridor along a ridge joining Dong Seng Forest (DSF) in the east to an unnamed, degraded forest remnant in the west. For a complete account of the study site and the restoration technique see Elliott et al., (2012) . The 3 plots, used for this study, had been planted in 2007, 2002 and 1998 and were 5, 10 and 14 years old at the time of the study (henceforth referred to as the RF5, RF10 and RF14 plots respectively) (Figure 2).
2.2. Species Selection
Lists of the tree species that had been planted in each of the plots were compared, to find 11 species common to all 3 plots. A survey located 3 average-sized trees of each species in each of the 3 plots. The selected trees were tagged and their wood density, tree volume, above-ground biomass and carbon sequestration measured.
2.3. Partial Harvest Method
Tree volume was calculated from a combination of trunk and branch measurements. A partial harvesting method was developed, which required cutting only small parts of each tree to calculate tree volume and biomass ( Snowdon et al., 2002 ). The girth at breast height (GBH) was measured by tape measurement and
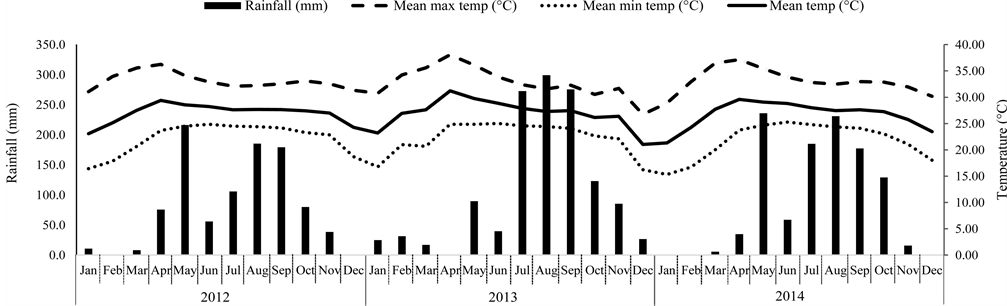
Figure 1. Monthly rainfall (mm) and average monthly temperature 2012-2014 (Northern Meteorological Center, Chiang Mai).

Figure 2. The study area in the Upper Mae Sa Valley, Mae Rim District Chiang Mai Province, Thailand. The village is marked in grey, with agricultural fields in hatched brown. The light green area encompasses the chronosequence of restoration plots, with locations of plots used in this study marked. DSF = Dong Saeng Forest (degraded primary forest).
tree height by clinometer.
Branches were categorized as primary, secondary, tertiary and so on. Primary branches were those growing out from the main trunk; secondary branches were those that grew out from primary branches, whilst tertiary branches grew out from the secondary branches. Primary branches were counted and one was cut from each sample tree, to measure length and circumference (Figure 3).
Trunk diameter was measured at the base and top and the trunk volume was calculated, using the formula for a frustum cone (Equation (1)).
 (1)
(1)
where h = height, R = lower girth and r = upper girth. Branch volume (for each

Figure 3. Tree parts: T = Trunk, 1B = Primary branch, 2B = Secondary branch, 3B = Tertiary branch).

Table 1. Calculation of branch volume.
branch order) was also calculated, using the frustum cone formula (Equation (1)). The calculation steps are listed in Table 1.
2.4. Wood Density
Wood core samples were collected with an increment borer, 30 cm long, 5 mm diameter. Tree trunks were bored half way through to collect wood samples. Oil paint was applied to the bore hole to prevent fungal infection. One wood sample was collected at breast height from each of 3 trees per species. The wood samples were oven-dried at 70˚C for 72 hours. Wood sample volume was derived from the formula used to calculate the volume of a cylinder. Wood density was calculated by dividing the sample mass with volume.
2.5. Trees Biomass
The biomass of the woody structures of each tree was calculated by multiplying wood density by tree volume. To this was added leaf biomass. Leaves from cut branches were oven-dried at 70˚C for 72 hours. Leaf mass was calculated by multiplying the leaf mass from one cut typical primary branch by the number of primary branches.
2.6. Carbon
The dried wood samples were ground and sieved and sent to the Faculty of Science, Kasetsart University’s lab for carbon content analysis, with a Carbon (C), Hydrogen (H) and Nitrogen (N) elemental analyzer. The percentage of carbon in each wood samples was multiplied by the respective tree biomass to derive the total carbon stored in each sampled tree.
3. Results and Discussion
3.1. Wood Density, Tree Volume and Above-Ground Biomass
Differences in wood density among the plots (within species) were not significant (Duncan’s Multiple Range test, p ≤ 0.05), indicating that tree age had no effect on wood density. Therefore, for each of the species, wood density measurements were pooled from all the plots (N = 9) to calculate species means. Differences in mean wood density, among species, were highly significant (Duncan’s Multiple Range test, p ≤ 0.05) (Figure 4, Table 2).
In general, early pioneer species tended to have lower wood density than later succession species, agreeing with other authors (e.g. Henry et al., 2010 ), but Gmelina arborea and Prunus cerasoides were notable exceptions having higher than expected wood density for pioneer tree species. In this study, G. arborea wood density ranged from 0.43 to 0.70 g/cm3, with a mean value of 0.57 g/cm3. These values compare similarly with those from other studies e.g. 0.34 - 0.49 g/cm3 (calculated from quoted values of 0.40 - 0.58 g/cm3 at 15% moisture con-
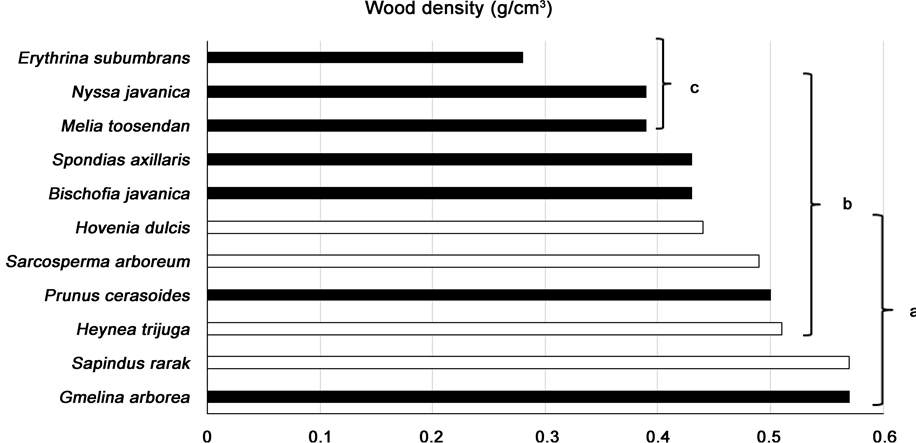
Figure 4. Species ranked in order of increasing mean wood density (g/cm3), pooled across plots (N = 9). Black = pioneer species; white = later successional or climax species. Bars not sharing the same superscript are significantly different (p < 0.05).
Table 2. Species details, mean wood density (±standard deviation, N = 9) and tree volume (N = 3) for partial sampling (Duncan’s Multiple Range test, p ≤ 0.05) in restoration plots 5, 10 and 14 after tree planting.
tent) ( PROSEA, 1994 ), 0.56 g/cm3 in India ( Benthall, 1984 ) and 0.41 - 0.45 g/cm3 (Brown, 1997). The species is commonly used for construction, because of its lightweight but hard wood. P. cerasoides wood density was 0.31 to 0.82 g/cm3 (mean 0.50 g/cm3). Other published values for P. cerasoides could not be found, but for the genus Prunus, PROSEA (1994) states that the wood is light to medium-weight hard-wood, with densities over several species of 0.35 - 0. 65 g/cm3 (calculated from the values 0.41 - 0.77, at 15% moisture content).
Tree volume varied considerably among the species in the youngest plot, but such inter-species variation declined as the trees matured (F-test = 100.10, p ≤ 0.05) (Table 2). In the younger RF5 and RF10 plots Spondias axillaris achieved highest tree volumes (means ± SD, 0.11 ± 0.05 m3 & 0.43 ± 0.11 m3, respectively, but this species was overtaken in the oldest RF14 plot by Erythrina subumbrans, which had the highest tree volumes of 0.99 ± 0.30 m3).
Despite its low wood density, Erythrina subumbrans attained the highest above-ground biomass in the oldest plot (RF14), due to its high growth: 301.23 ± 91.83 kg/tree, significantly higher than any other species (p < 0.05) (Table 3, Figure 5). In the RF5 plot, Gmelina arborea and Spondias axillaris (48.03 ± 12.68 and 47.30 ± 35.37 kg/tree respectively) attained above-ground dry biomass significantly higher than that of other species in the same plot. For the faster-growing species, above-ground dry biomass increased exponentially with plot age (Figure 6), but for some of the slower-growing species, the limited sampling possible (3 trees per plot) was not sufficient to reveal a reliable size-age pattern.
Trunks constituted most of the above-ground tree dry biomass (nearly 80%), followed by branches (around 17%) and leaves (3% - 5%). These relative percentages varied very little among species (Table 4). The faster-growing species tended to allocate, proportionally, slightly more biomass to branches and slightly
Table 3. Mean above-ground dry biomass of selected framework tree species and their components 5, 10 and 14 years after planting. Data are mean masses (kg) of 3 trees per plot.
Note: Values not sharing the same superscript are significantly different between species within plots (p < 0.05).
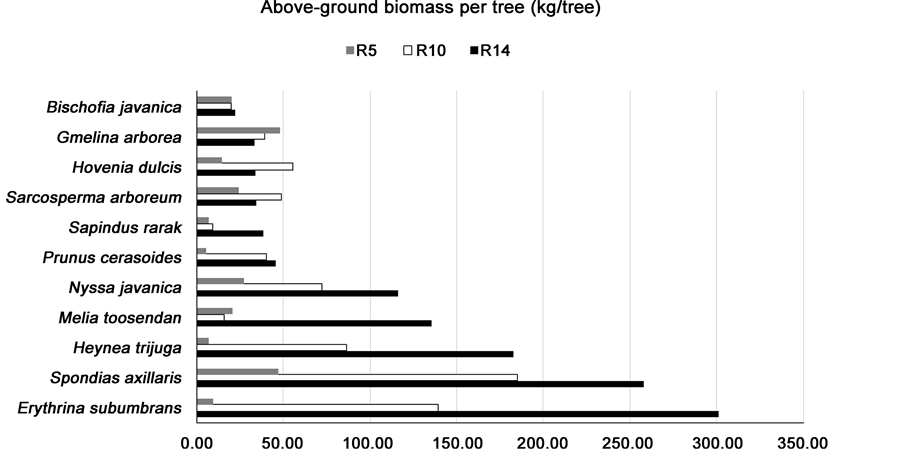
Figure 5. Species ranked in order of increasing biomass per tree and showing changes in biomass with age.

Figure 6. Increase in above-ground tree carbon sequestration over time, calculated from carbon per tree, averaged across all species (assuming even species mix) and the known stocking density in each of the plots. Y = 3.838e0.2401x, R2 = 0.9989. The arrow indicates the level in nearest natural remnant of mature forest.
Table 4. Percentage allocation of above-ground dry biomass among components of selected framework tree species 5, 10 and 14 years after planting.
less towards trunks and leaves, but the trend was not statistically significant. As the trees aged, they tended to allocate very slightly more biomass towards branches and proportionally less towards the trunk and leaves, but again the trend was not statistically significant.
3.2. Carbon Sequestration
The carbon concentration of the dry stem wood varied little among species and among plots, falling within the narrow range 43.18% to 45.89% (% of dry wood). The mean value was 44.67% (±0.54) with no significant differences among the species or the plots (Duncan’s Multiple Range test, p ≤ 0.05) (Table 5).
This value was slightly lower than the standard published values, commonly used to calculate carbon storage for REDD+ projects and others that depend on carbon credits. For example, Brown (1997) recommended 50% and Tsutsumi (1983) 49.9%. For trees, less than 10 cm diameter at breast height, IPCC (2006a) recommends 46%, and for larger trees, 49%. This suggests that for seasonally dry tropical forests, current standard carbon accounting methods may slightly over-estimate the amount of carbon sequestered. As carbon concentration varies so little, differences in carbon storage among species is almost entirely attributable to differences in growth.
In the younger plots, Spondias axillaris trees sequestered the most carbon, but by year 14, Erythrina subumbrans trees had overtaken them, storing more carbon than the trees of any other species of the same age (Table 5). Both are pioneer species. Trees of Heynea trijuga (a late-successional species) were the third best performer in terms of carbon storage, whereas Gmelina arborea and Bischofia javanica, both considered to be pioneer species, performed unexpectedly poorly in terms of carbon sequestration.
4. Conclusion
When implementing forest restoration for carbon sequestration, such as for REDD+ projects, it is tempting to maximize carbon absorption by planting (or encouraging natural regeneration of) one or a few of the top carbon-storing tree species, since the funding of such projects is linked to how much carbon is se-
Table 5. Carbon sequestration of selected framework species across different aged plots. Species ranked in declining order of carbon storage in RF14 plot.
questered. However, reducing the number of tree species planted would also reduce the rate of biodiversity recovery and might limit the range of forest pro- ducts available to local stakeholders (thus contravening two REDD+ safeguards mentioned in the introduction). This study shows that in addition to its proven ability to accelerate biodiversity recovery ( Elliott et al., 2012 ), the framework species method sequesters considerable amounts of carbon, which greatly increases the value of the technique.
For example, if an even mix of all the framework tree species, tested in this study, were to be planted, then multiplying the mean tree carbon content (averaged across all the species = 9.4, 29.0 and 48.8 kgC, in RF5, RF10 and RF14, respectively) (Table 5) by the known stocking density of each plot (1401, 1529 and 2166 trees/ha, respectively) provides an estimate of above-ground tree carbon per hectare (13.2, 44.3 and 105.8 tC/ha, respectively). The above-ground tree carbon in the nearest mature forest remnant was 181.5 tC/ha (measured in a related study); a level likely to be surpassed in the restoration trial plots 16 - 17 years after tree planting (Figure 6).
Carbon sequestration in RF14 and the nearest mature forest remnant exceeded the amount reported in “dry evergreen” forest, growing under very similar climatic conditions in Thong Pha Phum National Forest, Kanchanaburi Province i.e. 70.29 ± 7.38 tC/ha ( Terakunpisut et al., 2007 ). The value for the forest remnant in the present study even exceeded the reported value for so- called “tropical rain” forest in Kanchanaburi i.e. 138 tC/ha and the RF14 value will clearly do so within the next 1 - 2 years (Figure 6).
Increasing the proportion of the faster-growing pioneer species in the initial species mix planted would accelerate carbon accumulation even more, but pioneer trees have a short life span. Therefore, retaining slower-growing climax tree species in the initial species mix helps to sustain carbon storage over the longer term ( Shimamoto et al., 2014 ), once the pioneer trees start to die back. For example, Erythrina subumbrans starts to die back 6 - 8 years after planting, due to infestation with a stem borer.
To derive carbon sequestered in tree roots, IPCC (2006b) recommends multiplying the above-ground biomass by a factor of 0.37 for tropical evergreen forests. Applied to the above calculation, total estimated carbon sequestration in trees, including roots, then becomes 18.1, 60.7 and 144.9 tC/ha in the RF5, RF10 & RF14 plots, respectively.
The framework species method also has beneficial effects on soil carbon. In trial plots, adjacent to those used in this study, Kavinchan et al. (2015a) found that the restoration technique results in higher soil carbon storage than that supported by monoculture tree plantations in the same region. They also predicted a return to soil organic carbon concentrations, typical of mature forest, within 21.5 years after tree planting. Unfortunately, use of different aged plots in the soil study and the lingering impact of land use, prior to restoration, on soil carbon precludes combining soil and tree carbon to arrive at a reliable figure for overall carbon storage. In a related study, in the same area, the same authors ( Kavinchan et al., 2015b ) found that net inputs of carbon into the soil pool, via litterfall (taking into account decomposition) decline below control levels for at least 7 years after forest restoration commences (probably due to fire and weeding). Thereafter, inputs increase rapidly, reaching 61% of natural forest levels by 11 years and they were projected to reach natural forest levels (1.33 tC/ha/y) in 14 - 16 years after tree planting.
Therefore, most components of the carbon cycle in restoration plots approach levels similar to those of mature forest by around 20 years.
Apart from carbon sequestration, the beneficial effects of the framework species method on biodiversity recovery have been well-documented in the same plot system as that used for the present study. Toktang (2005) recorded an increase in the species richness of the bird community from about 30 before tree planting, to 88 after 6 years, when more than half (54%) of the bird species, recorded in natural forest, had recolonized the restored plots. Sinhaseni (2008) reported that seedlings of 73 non-planted tree species re-colonized the trial plot system within 8 - 9 years, most having germinated from seeds dispersed from nearby forest by birds (particularly bulbuls), fruit bats and civets. The species richness of mycorrhizal fungi and lichens also increased rapidly in the restored plots, exceeding that of natural forest ( Nandakwang et al., 2008 & Phongchiewboon, 2008 , respectively).
The partial harvesting method worked well in this study. It allowed derivation of above-ground tree biomass without tree felling, which is not permitted in conservation areas in Thailand. The alternative standard method is to use allometric equations, based on direct measurements from previously cut trees. The results from such equations can vary widely; depending on the parameters used ( Chave et al., 2014 ) and no such equations for the tree species or the forest type used in this study have been published. Therefore, partial harvesting remained the only option. However, the method has several disadvantages. Firstly, ladders and ropes must be used to sample the taller trees, which raises health and safety issues and tends to influence field workers to select smaller trees for sampling, which leads to underestimation of tree biomass. It is, therefore, important to carry out a preliminary survey of the study plots, to measure girth at breast height of as many trees as possible of each species selected, so that trees closest to the average size are selected for sampling. The time-consuming nature of partial harvesting (average 2 - 3 hours per tree) means that sample sizes tend to be very small, so selection of average trees is essential to make sure that the trees sampled are representative of each plot age.
Acknowledgements
This research was funded by The Royal Golden Jubilee (RGJ) Ph.D. Program and National Science and Technology Development Agency (NSTDA). We thank Khun Neng, Jatupoom Meesena, Robyn Sakkara, Nuttira Kavinchan, Phushewan Suriyawong, Worradorn Phaireung and every FORRU’s interns from Maejo University for helping with field work.
Cite this paper
Jantawong, K., Elliott, S., & Wangpakapattanawong, P. (2017). Above-Ground Carbon Sequestration during Restoration of Upland Evergreen Forest in Northern Thailand. Open Journal of Forestry, 7, 157-171. https://doi.org/10.4236/ojf.2017.72010
References
- 1. Alexander, S., Nelson, C. R., Aronson, J., Lamb, D., Cliquet, A. et al. (2011). Opportunities and Challenges for Ecological Restoration within REDD+. Restoration Ecology, 19, 683-689.
https://doi.org/10.1111/j.1526-100X.2011.00822.x [Paper reference 1] - 2. Benthall, A. P. (1984). The Trees of Calcutta: And Its Neighbourhood. Calcutta: Thacker Spink & Co. Ltd. [Paper reference 1]
- 3. Bonn Challenge (2011). The Challenge: A Global Effort.
http://www.bonnchallenge.org [Paper reference 1] - 4. Brown, S. (1997). Estimating Biomass and Biomass Change of Tropical Forests: A Primer (p. 134). A Forest Resources Assessment Publication. FAO Forestry Paper. [Paper reference 1]
- 5. Chave, J., Rejou-Mechain, M., Burquez, A., Chidumayo, E., Colgan, M. et al. (2014). Improved Allometric Models to Estimate the Aboveground Biomass of Tropical Trees. Global Change Biology, 20, 3177-3190.
https://doi.org/10.1111/gcb.12629 [Paper reference 1] - 6. Elliott, S., Blakesley, D., & Hardwick, K. (2013). Restoring Tropical Forests: A Practical Guide (344 p.). Kew: Royal Botanic Gardens. [Paper reference 2]
- 7. Elliott, S., Kuaraksa, C., Tunjai, P. Toktang, T., Boonsai, K., Sangkum, S., Suwanaratanna, S., & Blakesley, D. (2012). Integrating Scientific Research with Community Needs to Restore a Forest Landscape in Northern Thailand: A Case Study of Ban Mae Sa Mai. In J. Stanturf, P. Madsen, & D. Lamb (Eds.), A Goal-Oriented Approach to Forest Landscape Restoration (pp. 149-152). New York, NY: Springer.
https://doi.org/10.1007/978-94-007-5338-9_7 [Paper reference 2] - 8. FAO (2010). Global Forest Resources Assessment: Main Report. Rome: Food & Agriculture Organization of the United Nations. [Paper reference 1]
- 9. FORRU (2006). How to Plant a Forest: The Principles and Practice of Restoring Tropical Forest. Chiang Mai: Biology Department, Science Faculty, Chiang Mai University. [Paper reference 1]
- 10. Henry, M., Besnard, A., Asante, W. A., Eshun, J., Adu-Bredu, S., Valentini, R., Bernoux, M., & Saint-Andre, L. (2010). Wood Density, Phytomass Variations within and among Trees, and Allometric Equations in a Tropical Rainforest of Africa. Forest Ecology and Management, 260, 1375-1388.
https://doi.org/10.1016/j.foreco.2010.07.040 [Paper reference 1] - 11. IPCC (2000). Land Use, Land-Use Change, and Forestry (pp. 1-9). [Paper reference 1]
- 12. IPCC (2006a). Guidelines for National Greenhouse Gas Inventories Volume 4: Agriculture, Forestry and Other Land Use. [Paper reference 2]
- 13. IPCC (2006b). 2006 IPCC Guidelines for National Greenhouse Gas Inventories. In H. S. Eggleston, L. Buendia, K. Miwa, T. Ngara, & K. Tanabe (Eds.), The National Greenhouse Gas Inventories Programme. Kanagawa: IGES.
www.ipcc-nggip.iges.or.jp/public/2006gl/vol4.html [Paper reference 1] - 14. Kavinchan, N., Wangpakapattanawong, P., Elliott, S., & Pinthong, J. (2015a). Soil Organic Carbon Stock in Restored and Natural Forests in Northern Thailand. KKU Research Journal, 20, 294-304. [Paper reference 1]
- 15. Kavinchan, N., Wangpakapattanawong, P., Elliott, S., Chairuangsri, S., & Pinthong, J. (2015b). Use of the Framework Species Method to Restore Carbon Flow via Litterfall and Decomposition in an Evergreen Tropical Forest Ecosystem, Northern Thailand. Kasetsart Journal, 49, 639-650. [Paper reference 1]
- 16. Khun, V., & Sasaki, N. (2014). Re-Assessment of Forest Carbon Balance in Southeast Asia: Policy Implications for REDD+. Low Carbon Economy, 5, 153-171.
https://doi.org/10.4236/lce.2014.54016 [Paper reference 1] - 17. Kim Phat, N., Knorr, W., & Kim, S. (2004). Appropriate Measures for Conservation of Terrestrial Carbon Stocks Analysis of Trends of Forest Management in Southeast Asia. Ecology Management, 191, 283-299.
https://doi.org/10.1016/j.foreco.2003.12.019 [Paper reference 1] - 18. Lamb, D. (2015). Ch. 28: Restoration of Forest Ecosystems. In Routledge Handbook of Forest Ecology (650 p). Oxford: Routledge. [Paper reference 1]
- 19. Nandakwang, P., Elliott, S., Youpensuk, S., Dell, B., Teaumroon, N., & Lumyong, S. (2008). Arbuscular Mycorrhizal Status of Indigenous Tree Species Used to Restore Seasonally Dry Tropical Forest in Northern Thailand. Research Journal of Microbiology, 3, 51-61. [Paper reference 1]
- 20. Phongchiewboon, A. (2008). Recovery of Lichen Diversity during Forest Restoration in Northern Thailand. M.Sc. Thesis, Chiang Mai: Graduate School, Chiang Mai University. [Paper reference 1]
- 21. PROSEA (1994). Plant Resources of South-East Asia No. 5(1): Timber Trees: Major Commercial Timbers (pp. 215-220). Bogor: PROSEA. [Paper reference 2]
- 22. Raich, J. W., Clark, D. A., Schwendenmann, L., & Wood, T. E. (2014). Aboveground Tree Growth Varies with Belowground Carbon Allocation in a Tropical Rainforest Environment. PLoS ONE, 10, e0117932.
https://doi.org/10.1371/journal.pone.0100275 [Paper reference 1] - 23. Scharlemann, J. P. W., Kapos, V., Campbell, A., Lysenko, I., Burgess, N. D., Hansen, M. C., Gibbs, H. K., Dickson, B., & Miles, L. (2010). Securing Tropical Forest Carbon: The Contribution of Protected Areas to REDD. Oryx, 44, 352-357.
https://doi.org/10.1017/S0030605310000542 [Paper reference 1] - 24. Shimamoto, C. Y., Botosso, P. C., & Marques, M. C. M. (2014). How Much Carbon Is Sequestered during the Restoration of Tropical Forests? Estimates from Tree Species in the Brazilian Atlantic Forest. Forest Ecology & Management, 329, 1-9. [Paper reference 1]
- 25. Sinhaseni, K. (2008). Natural Establishment of Tree Seedlings in Forest Restoration Trials at Ban Mae Sa Mai, Chiang Mai Province. M.Sc. Thesis, Chiang Mai: Chiang Mai University. [Paper reference 1]
- 26. Snowdon, P., Keith, H., & Raison, R. (2002). Protocol for Sampling Tree and Stand Biomass (Technical Report No. 31, pp. 1-76). Australian Greenhouse Office. [Paper reference 2]
- 27. Terakunpisut, J., Gajaseni, N., & Ruankawe, N. (2007). Carbon Sequestration Potential in Aboveground Biomass of Thong Pha Phume National Forest Thailand (BRT Research Reports, pp. 255-262). [Paper reference 1]
- 28. Toktang, T. (2005). The Effects of Forest Restoration on the Species Diversity and Composition of a Bird Community in Doi Suthep-Pui National Park Thailand from 2002-2003. MSc. Thesis, Chiang Mai: Chiang Mai University. [Paper reference 1]
- 29. Tsutsumi, T., Yoda, K., Sahunalu, P., Dhanmanonda, P., & Prachaiyo, B. (1983). Forest: Felling, Burning and Regeneration. In K. Kyuma, & C. Pairintra (Eds.), Shifting Cultivation (pp. 13-62). Tokyo. [Paper reference 1]
- 30. UNFCCC (2007). Conference of the Parties (COP): Report of the Conference of the Parties on Its Thirteenth Session. Bali: UNFCCC.
http://unfccc.int/meetings/bali_dec_2007/meeting/6319.php [Paper reference 1] - 31. UNFCCC (2010). Conference of the Parties (COP): Report of the Conference of the Parties on Its Sixteenth Session. Cancun: UNFCCC.
http://unfccc.int/meetings/cancun_nov_2010/meeting/6266.php [Paper reference 1]