Open Journal of Ecology
Vol.3 No.4(2013), Article ID:35041,10 pages DOI:10.4236/oje.2013.34035
Evaluation of habitat quality for selected wildlife species associated with island back channels
![]()
1Division of Forestry and Natural Resources and Environmental Research Center, West Virginia University, Morgantown, USA; jim.anderson@mail.wvu.edu
2Wildlife and Fisheries Resources, Division of Forestry, West Virginia University, Morgantown, USA
3US Geological Survey West Virginia Cooperative Fish and Wildlife Research Unit, West Virginia University, Morgantown, USA
4West Virginia Division of Natural Resources, Wildlife Resources Section, Fairmont, USA
Copyright © 2013 James T. Anderson et al. This is an open access article distributed under the Creative Commons Attribution License, which permits unrestricted use, distribution, and reproduction in any medium, provided the original work is properly cited.
Received 16 April 2013; revised 27 May 2013; accepted 3 July 2013
Keywords: Habitat Suitability Index; Island Back Channel; Model Validation; Ohio River; Riparian Wildlife
ABSTRACT
The islands and associated back channels on the Ohio River, USA, are believed to provide critical habitat features for several wildlife species. However, few studies have quantitatively evaluated habitat quality in these areas. Our main objective was to evaluate the habitat quality of back and main channel areas for several species using habitat suitability index (HSI) models. To test the effectiveness of these models, we attempted to relate HSI scores and the variables measured for each model with measures of relative abundance for the model species. The mean belted kingfisher (Ceryle alcyon) HSI was greater on the main than back channel. However, the model failed to predict kingfisher abundance. The mean reproduction component of the great blue heron (Ardea herodias) HSI, total common muskrat (Ondatra zibethicus) HSI, winter cover component of the snapping turtle (Chelydra serpentina) HSI, and brood-rearing component of the wood duck (Aix sponsa) HSI were all greater on the back than main channel, and were positively related with the relative abundance of each species. We found that island back channels provide characteristics not found elsewhere on the Ohio River and warrant conservation as important riparian wildlife habitat. The effectiveness of using HSI models to predict species abundance on the river was mixed. Modifications to several of the models are needed to improve their use on the Ohio River and, likely, other large rivers.
1. INTRODUCTION
Over the past 200 years, industrialization and navigational projects have dramatically altered the Ohio River, USA, essentially changing it from a free-flowing river to a series of connected lakes [1]. Many of the islands on the river have been completely eliminated or severely degraded due to these activities [2].
The islands and associated back channels (i.e., areas between an island and mainland not receiving comercial barge traffic) on the Ohio River are generally believed to provide critical habitat features for several wildlife species. However, few studies have quantitatively evaluated the quality of these areas for wildlife [3, 4]. This information is important to assist federal and state resource managers in determining what types of activities are compatible with conserving these areas for wildlife.
A widely accepted method to assess the habitat quality of an area for particular species is the use of Habitat Suitability Index (HSI) models [5,6]. The United States Fish and Wildlife Service (USFWS) originally developed these models as part of the Habitat Evaluation Procedures [7,8]. The models are based on measurements of structural variables necessary for important life requisites of individual species. Each variable is scored from 0 - 1, and then entered into a formula to calculate a final HSI score, also 0 - 1. Higher final HSI scores indicate higher habitat quality for that species [8]. The relation between HSI scores and carrying capacity is assumed to be positively linear [8].
The need to evaluate HSI model performance is commonly recognized [5,9-11]. The preferable means to accomplish this is by testing a model against population measures, such as species density or reproductive success [5,12]. Results of studies attempting such correlations have been inconsistent [9,13-15]. Thus, considering the demand for rapid assessment methods, further validation studies have been encouraged [5,11].
Over 158 HSI models are available from the USFWS in published form. For this study, we chose models for the belted kingfisher (Ceryle alcyon; total model) [16], great blue heron (Ardea herodias; total model) [17], common muskrat (hereafter muskrat; Ondatra zibethicus; freshwater model) [18], snapping turtle (Chelydra serpentina; total model) [19], and wood duck (Aix sponsa; brood-rearing component and winter model) [20]. Summaries of each of these models can be found in Zadnik [21]. These species are commonly associated with riparian areas and are known to exist along the Ohio River [22]. They also are representative of different taxonomic groups. Furthermore, we believed the variables measured in accordance with these models should provide a thorough representation of the overall habitat quality of the study area.
Our main objective with this study was to evaluate the potential wildlife value, based on HSI scores, of back channel and main channel areas associated with islands on the Ohio River. In addition, to test the effectiveness of these models on the Ohio River, and potentially other large rivers, we related HSI scores and the variables measured for each model with measures of relative abundance for the model species.
2. STUDY AREA AND METHODS
2.1. Study Area
This study was conducted on back channel and main channel areas associated with 10 islands (Captina, Paden, Williamson, Wells, Mill Creek, Middle, Buckley, Muskingum, Neal, and Buffington) on the Ohio River, West Virginia, USA (Figure 1). These islands are part of the Ohio River Islands National Wildlife Refuge [22]. They occurred between river kilometer 174 and 349 in 4 separate navigational pools: Hannibal, Willow Island, Belleville, and Racine. Island back channels varied from 0.92 - 39.9 ha in size, 0.63 - 4.13 km in length, and 0.03 - 0.22 km in width. Main channel areas associated with the islands had widths ranging from 0.24 - 0.42 km. A thorough description of the study area can be found in Zadnik [21].
2.2. Methods
2.2.1. HSI Variables
We attempted to evaluate each island back and main channel once during this study using the published HSI
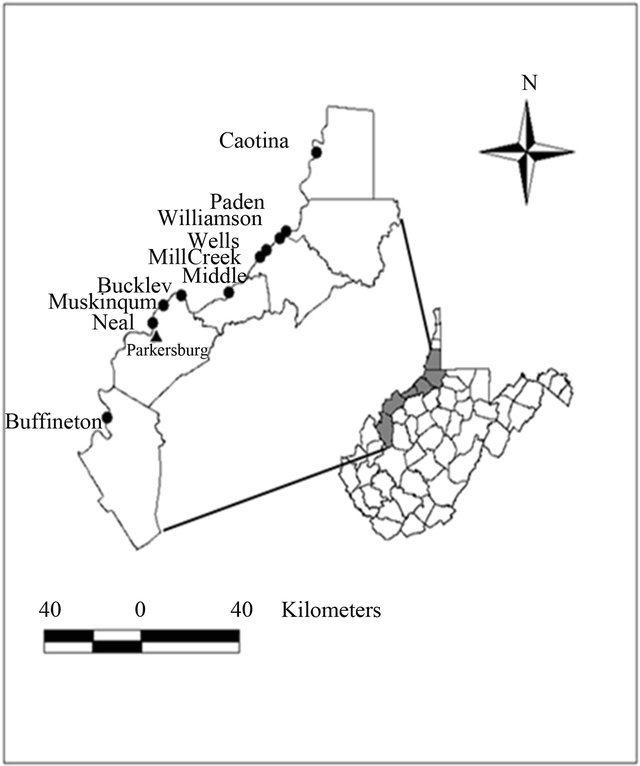
Figure 1. Location of 10 islands (indicated by points) between river kilometer 174 and 349, on the Ohio River, West Virginia, USA.
models for the belted kingfisher, great blue heron, muskrat, snapping turtle, and wood duck. However, Captina Island and Mill Creek Island could not be evaluated using the wood duck brood-rearing component because the back channels associated with those islands did not meet the minimum area required for broods (4 ha) [20]. Similarly, those islands could not be evaluated using the belted kingfisher model because the channels did not meet the minimum shoreline length (1 km) [16]. A total of 27 variables was measured and used in determining HSI scores (Table 1). All field measurements were taken from a boat May-September 2001 and 2002. Once measured, each variable was given a suitability index (SI) determined by the specific model. These indices were then used to determine indices for specific life requisites (e.g., cover or food components) and/or final HSI scores (Table 1).
We determined the percent canopy cover of aquatic vegetation, herbaceous vegetation, woody downfall, and overhanging vegetation ≤1 m from the water’s surface (including coverage ≤15 m from shore) using the line intercept method [23] (Table 1). Transects, set at 250-m intervals, were established perpendicular to the flow of water and extending the width of each channel. The number of transects per island ranged from 4 - 19, although an equal number of transects were established per channel across each island. By extending each transect onto shore, the percent herbaceous canopy cover ≤10 m
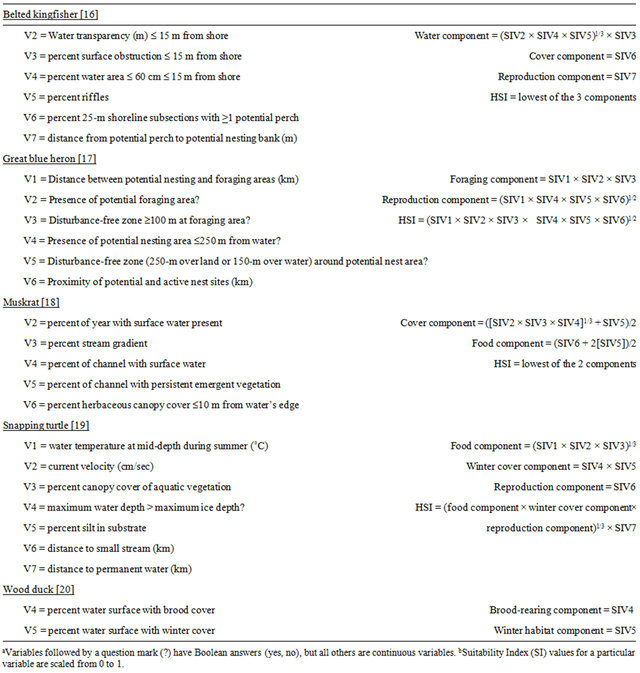
Table 1. Variables (V) a measured and equations used to determine life components (based on variable suitability indices [SI]) b, and habitat suitability index (HSI) scores for belted kingfisher, great blue heron, muskrat, snapping turtle, and wood duck, on the Ohio River, West Virginia, 2001-2002.
from the water’s edge was estimated. The percent of the channel with surface water present during typical minimum flow was estimated by measuring the portion of a transect extended across the channel that was not over open water.
We measured the percent silt by collecting 10 random substrate samples using an Ekman dredge and a posthole digger. Each sample was oven dried for >2 days, weighed, and passed through a 63-micron sieve using a sieve shaker. The material that passed through was weighed and divided by the total sample weight.
We measured average water temperature (˚C) at middepth using a temperature sensitive probe. One transect was randomly chosen per channel and temperature readings taken every 5 m. Water velocity was measured as the time it took a neutrally buoyant object (an orange) to travel a measured distance down the center of each channel [23]. Water transparency ≤15 m from shore was measured by randomly taking a Secchi disk reading along each transect [24].
The relation between perches and cover for the belted kingfisher model was based on the number of 25-m channel subsections/km that contained ≥1 suitable perch [16]. Along each channel shoreline, a randomly located 1-km section was divided into 40, 25-m subsections. We then evaluated each subsection to determine if it contained ≥1 potential perch. On-site inspections along with aerial photographs and topographic maps projected with Geographic Information System software (ArcView, hereafter GIS) [25] were used to determine the shortest distance from a subsection containing ≥1 suitable perch to a potential nesting bank [16]. We measured the soil texture of a potential nesting bank using the feel method [23].
We determined the percent of the water area ≤15 m from shore and ≤60 cm deep using a graduated rod [23] along each transect. The percent of riffles in each channel was estimated using a measuring tape [23]. We measured the percent stream gradient in each channel using GIS and topographic maps.
Whether or not a channel contained potential foraging areas for great blue herons was based on the proportion of transects along each channel that we believed met the necessary criteria (presence of a shallow water body with suitable prey population and foraging substrate) [17]. If the majority of transects met the criteria, then the channel was considered a potential foraging area. We assumed the river contained a suitable prey population [4,26]. We used on-site inspections and GIS to determine the following additional variables for the great blue heron model: presence of a disturbance-free zone ≥100 m around potential foraging areas, presence of potential nesting areas ≤250 m from open water, presence of a ≥250-m (land) or ≥150-m (water) disturbance-free zone around potential nest sites, distance between potential nest sites and foraging areas, and proximity between potential nest sites and active nest sites (Table 1). Potential sources of disturbance included houses, other buildings, and improved roads [17].
We measured the distance from each channel to a small stream using GIS and on-site inspections. Whether the maximum water depth was greater than the maximum ice depth was determined with winter field observations and local data (Table 1). It was not necessary to measure the distance to permanent water or percent of the year with surface water present, as our study area included the permanent water of the river.
2.2.2. Wildlife Population Measures
Belted kingfishers, great blue herons and wood ducks were surveyed with shoreline counts during daylight hours. In 2001, surveys were conducted once in the spring, twice in the summer, and once in the fall. In 2002, surveys were conducted once in the winter, once in the spring, 3 times in the summer, and once in the fall.
Snapping turtles were trapped using commercially available nylon hoop nets (1.5-m long × 0.9-m diameter) with 5-cm mesh (Memphis Net and Twine Company, Inc., Memphis TN, USA) baited with chopped fish [27]. Trapping was conducted once in fall 2001, 3 times in summer 2002, and once in fall 2002. Traps were set for 1 night before being moved. A trap-night was considered as 1 trap found completely intact the day after being set. We completed 376 trap-nights (mean = 75.1 trap-nights per period; SE = 2.5). Captured turtles were shell-notched [28] and released at the capture site.
Muskrat relative abundance was based on direct observation or the observation of appropriate sign (e.g., tracks, cuttings, middens, or burrows). Sign was searched for within a 15-m zone around each HSI transect. Each channel was examined once for appropriate sign. Direct observations within this zone were counted as they occurred. Complete methods for all investigations can be found in Zadnik [21].
2.2.3. Analyses
The relative abundance of belted kingfishers, great blue herons and wood ducks was calculated as the frequency (number/km of channel shoreline) of each observed during the surveys. To avoid double counting from the multiple summer periods, the summer period with the maximum number of individuals of each species observed per year was used in the analyses. Snapping turtle relative abundance was calculated as the number captured/trap-night. The relative abundance of muskrat was calculated as the frequency of transects on which the species was detected.
We used a complete block design analysis of variance (ANOVA) [29], with island as the block, to evaluate final HSI scores and scores for particular life requisites using channel and side (island side and mainland side) as independent variables. A similar ANOVA was used to evaluate species relative abundance using channel, side, year, season, and their interactions as independent variables. Model data and belted kingfisher, great blue heron, snapping turtle, and wood duck relative abundance data were log transformed to meet normal distribution assumptions. Muskrat relative abundance data were power transformed. An alpha level of 0.05 was used for all tests. Presented means and standard errors are untransformed to ease interpretation.
We used simple linear regression to relate final HSI and or life requisite scores with the measures of relative abundance. In this analysis, all data were log transformed. We used multiple regression using the backward variable selection procedure to relate the individual habitat variables for each model with measures of relative abundance. Muskrat model data were power transformed for this analysis. Data for the other models were log transformed. We tested all HSI models, components, and variables against species relative abundance data from the season(s) stated or implied by the model.
3. RESULTS AND DISCUSSION
3.1. Belted Kingfisher
Belted kingfisher density and frequency showed channel x season interactions (F160 ≥ 4.96, P ≤ 0.030); thus, further analyses were conducted within season. Relative abundance differed only during the summer, with the main channel having a greater mean abundance than the back channel (Table 2). The belted kingfisher total HSI model and water component had higher mean scores on the main channel than back channel (Table 3). The model and all components failed to show a linear relationship with abundance (Table 4). However, results of the multiple regression showed that water transparency and % riffles were positively correlated with belted kingfisher abundance and formed the best-fit model, based on the Akaike Information Criterion (AIC) value (Table 5).
These results suggest that the abundance of belted kingfishers on the main channel relative to the back channels is at least partially due to increased foraging opportunities. Kingfishers require clear water to locate potential prey [30]. Though turbidity often occurred throughout the study area, mean transparency was greater on the main channel [21]. Also, kingfishers are known to forage in areas of riffles [30, Brooks and Davis as cited in 16]. Extensive areas of riffles once occurred at the heads of the islands due to gravel beds [22]. However, past activities have degraded these areas, and the few remaining areas of riffles observed within the study area occurred at the mouths of tributaries along the main channel shoreline. The belted kingfisher model could likely be improved for use on the Ohio River by modifying the suitability indices given to water transparency and % riffles.
3.2. Great Blue Heron
Great blue heron abundance did not differ between back and main channels (Table 2). The great blue heron reproduction component of the HSI model had a higher mean score on the back channel than the main channel (Table 3). A linear association was found between the total HSI model and abundance (Table 4). However, no correlation was found between the individual model variables and abundance. The best-fit model included Variable 5 (presence of a disturbance-free zone around potential nest sites) and Variable 6 (proximity of potential and active nest sites; Tables 1 and 5).
These results suggest the importance of areas free from human disturbance for great blue herons [17,31]. On the Ohio River, this condition is met most readily on the islands. Herons prefer isolation particularly during nesting [17,32,33]. Indeed, all active nests observed within our study area occurred on islands. The back channels may improve nesting conditions provided on the islands both due to the narrowness of most back
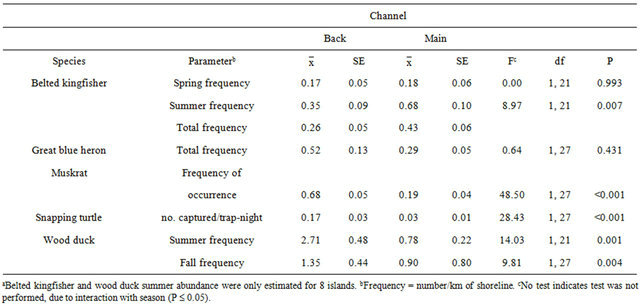
Table 2. Relative abundance of 5 species on back and main channels, averaged across years, associated with 10 islands on the Ohio River, West Virginia, USA, 2001-2002a.
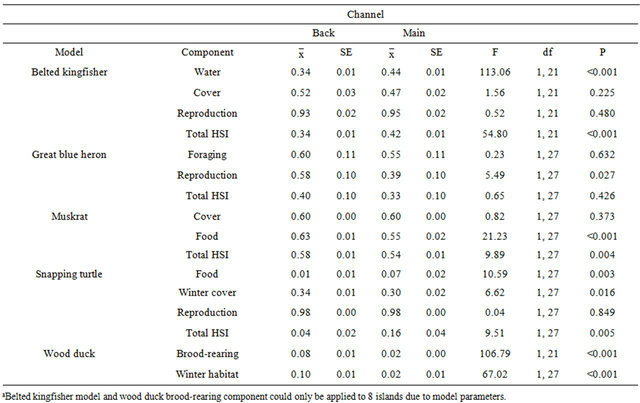
Table 3. Habitat suitability index (HSI) model scores, and the scores of model components, for 6 species, on back and main channels associated with 10 islands on the Ohio River, West Virginia, USA, 2001-2002a.
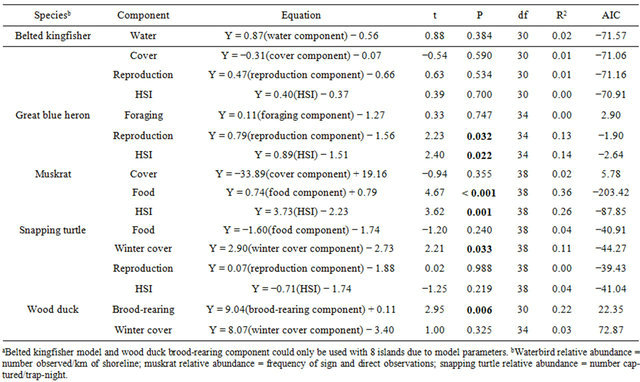
Table 4. Linear regression models of relative abundance of 5 species modeled with habitat suitability index (HSI) models and model components in areas associated with 10 islands on the Ohio River, West Virginia, 2001-2002a.
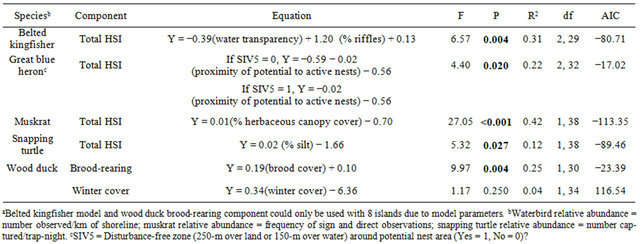
Table 5. Backwards selection multiple regression models of relative abundance of 5 species modeled with habitat suitability index (HSI) model variables in areas associated with 10 islands on the Ohio River, West Virginia, 2001-2002a.
channels compared to the main channel, as well as greater woody canopy closure along the back channel island shorelines relative to the main channel island shorelines [21]. These conditions may provide not only disturbance-free zones but also potentially new nesting sites.
3.3. Muskrat
Muskrat relative abundance was greater on the back channel than main channel (Table 2). The muskrat total model and food component had higher mean scores on the back channel than main channel (Table 3). There were linear associations between the total HSI score, the food component and relative abundance (Table 4). Results of the multiple regression showed a positive correlation between % cover and relative abundance (Table 5).
According to the HSI model, muskrat cover can be provided by persistent emergent vegetation within the river channel itself or herbaceous canopy cover along the shore [18]. In our study area, a complete lack of persistent emergent vegetation meant that cover was primarily provided by shoreline herbaceous vegetation, which was most abundant on the back channel island shoreline. Additional cover was likely provided by woody debris and undercut banks [34], conditions provided in more abundance on the back channels (measured as % brood cover for the wood duck model) [21] but not included as variables in the muskrat model.
3.4. Snapping Turtle
Snapping turtles had a greater mean relative abundance on the back channel than the main channel (Table 2). However, the snapping turtle food component and total HSI model had higher scores on the main channel than back channel (Table 3). Conversely, scores for the winter cover component were higher on the back channel than the main channel. There was a linear association between the winter cover component and relative abundance (Table 4). Similarly, % silt in the substrate, one of the variables included in the winter cover component, was positively correlated with relative abundance (Table 5)
The obvious discrepancy between snapping turtle total HSI and food component scores compared with relative abundance is primarily due to the weight given aquatic vegetation by the model. The model assumes that a complete absence of aquatic vegetation removes all food value for the area being evaluated [19]. Hence, since the aquatic vegetation observed within our study area occurred primarily on the main channel [21], that area was considered higher quality habitat as compared with back channels. The model states that snapping turtles are primarily carnivorous in early spring, and then switch to a more herbivorous diet later in the spring and summer [19]. If that was the case in our study area, we should have found a higher abundance of turtles on the main channel than the back channel, particularly in the summer when the few areas of aquatic vegetation were visible (A. Zadnik personal observation). While trapping was not conducted in early spring, back channels had a higher abundance of turtles throughout the 2 seasons in which trapping was conducted, summer and fall. Furthermore, main channel turtle abundance stayed consistently low during those seasons. Due to the overall scarcity of aquatic vegetation on the Ohio River, it is probable that snapping turtles remain primarily carnivorous throughout the year, with back channels likely providing more foraging opportunities than the main channel. The HSI model would be more effective for use on the Ohio River if it put less weight on abundance of aquatic vegetation. However, additional research is needed to evaluate food preferences and identify any seasonal shifts in area use.
The one variable that was positively correlated with relative abundance, % silt in the substrate, reflects the value of back channels as overwintering sites for snapping turtles. Snapping turtles are known to escape from harsh winter conditions by burying themselves deep in the substrate [35]. The model assumes that substrate with a greater % of silt is of higher quality for the species [19]. Mean % silt was greater on the back channel than main channel [21]. Of course, while silt in the substrate appears to positively affect snapping turtles, suspended silt can have negative impacts on the overall habitat quality for other species [36].
Though significant, the correlation between % silt and relative abundance is rather weak (r2 = 0.12; Table 5), indicating additional variability not accounted for by the model. Current velocity was another variable included in the model (Table 1). Snapping turtles are typically associated with slower waters [35,37]. While it appeared that mean velocity was less on the back channel than main channel [21], our analyses did not find a correlation between velocity and relative abundance. Even with all model variables included, the correlation with relative abundance remained weak (r2 = 0.18; [21]). That still leaves 82% of the variation in turtle relative abundance unaccounted for by the model. Additional research is needed to identify other factors contributing to turtle abundance.
3.5. Wood Duck
Wood duck summer relative abundance (corresponding to the brood-rearing component) and fall abundance (corresponding to the winter model) was greater on the back channel than the main channel (Table 2). There were no wood ducks observed during the winter survey.
Both wood duck models had higher scores on the back channel than the main channel (Table 3). In addition, the wood duck brood-rearing component showed a linear correlation with relative abundance (Table 4). Not surprisingly, the only variable in the model, % brood cover was found to be positively correlated with relative abundance (Table 5).
Brood cover is defined as woody downfall, emergent vegetation, and overhanging branches ≤1 m from the water’s surface [20]. With the exception of emergent vegetation, which failed to occur during the sampling, these characteristics were >3 times more prevalent on the back channel than main channel [21]. The importance of woody cover for wood ducks in riverine systems is commonly recognized. Cottrell et al. [38], in a Tennessee study, found that wooded shorelines and fallen trees were 2 features that determined use of areas by ducklings. Similarly, Minser [39] found that wood duck brood density (number/km) was positively correlated with woody debris in the water and large overhanging trees. In general, woody overhead cover is considered an essential component of good brood habitat [40].
Nonbreeding habitat for wood ducks is considered similar to high quality brood habitat [41-43], a common feature being the presence of woody vegetation [44]. Hence, due to the lack of emergent vegetation in our study area, winter cover was considered identical to brood cover. The lack of correlation between the winter model and relative abundance is likely due to the absence of wood ducks during the winter survey. This is not surprising, however, as the West Virginia portion of the Ohio River is at the far northern edge of the species wintering range [45]. Furthermore, although the back channels in particular were used for brood-rearing [21], the overall lower quality wood duck habitat on the river compared to other wetland types [46], may have limited use of the study area by this species.
4. MANAGEMENT IMPLICATIONS
With the continuing pressure to develop Ohio River island back channels and back channel mainland shorelines, the need to better understand the value of these areas for wildlife is clear [27]. We found that certain wildlife species appeared to be more abundant in back channel than main channel areas due to particular habitat characteristics not as prevalent on the main channel, including herbaceous vegetation, woody downfall and overhanging limbs, and a substrate with high silt content. Other back channel characteristics potentially benefiting wildlife include protection from human disturbance and slower water current. Conversely, species on the main channel appeared to benefit from overall less turbid water and presence of riffles. Due to the uniqueness and rarity of back channels on the Ohio River, their conservation and restoration are warranted [21,27].
We found that the total HSI model for the muskrat and the brood-rearing model for the wood duck can both be used to successfully predict habitat quality for those species on the Ohio River and possibly similar large rivers. In addition, the great blue heron total model can be used with limited success. Our results indicate the snapping turtle total HSI model needs to be modified to better account for the likely year-round carnivorous habits of this species. As published, the winter cover component of the model can be used to some extent to predict use of the river by snapping turtles. However, further research is needed to identify other variables affecting snapping turtle relative abundance. Finally, our results indicate the belted kingfisher model needs to be modified to better predict use of the river, possibly by changing the suitability indices to include measures of water transparency and riffle area.
5. ACKNOWLEDGEMENTS
We thank the West Virginia Division of Natural Resources, United States Environmental Protection Agency, United States Geological Survey West Virginia Cooperative Fish and Wildlife Research Unit, and the West Virginia University Davis College of Agriculture, Natural Resources, and Design for funding, resources, and support. We are grateful to the late G. Seidel for his assistance and expertise with statistical analysis and W. S. Kordek for project support. We thank M. Christ, W. Kordek, J. Pitchford, and S. Welsh for comments on this manuscript. We also thank the many individuals who assisted in the field and laboratory. Turtle trapping and handling protocols were approved by the West Virginia University Animal Care and Use Committee (protocol #001209). This is scientific article number 3160 of the West Virginia University Agricultural and Forestry Experiment Station. Use of trade names or products does not constitute endorsement by the U.S. Government.
REFERENCES
- Frost, S.L. and Mitsch, W.J. (1989) Resource development and conservation history along the Ohio River. Ohio Journal of Science, 89, 143-152.
- United States Army Corps of Engineers. (2000) Ohio River ecosystem restoration program, integrated decision document and environmental assessment. United States Army Corps of Engineers, Great Lakes and Ohio River Division, Cincinnati.
- Thorp, J.H. (1992) Linkage between islands and benthos in the Ohio River, with implications for riverine management. Canadian Journal of Fisheries and Aquatic Sciences, 49, 1872-1882. doi:10.1139/f92-207
- Millard, M.J. (1993) Nearshore habitat use by larval fishes near two islands in the upper Ohio River. Dissertation, West Virginia University, Morgantown.
- Brooks, R.P. (1997) Improving habitat suitability index models. Wildlife Society Bulletin, 25, 163-167.
- Morrison, M.L., Marcot, B.G. and Mannan, R.W. (1998) Wildlife habitat relationships: concepts and applications. University of Wisconsin Press, Madison.
- United States Fish and Wildlife Service. (1980) Habitat evaluation procedures (HEP). United States Fish and Wildlife Service, ESM 102.
- United States Fish and Wildlife Service. (1981) Standards for the development of habitat suitability index models. United States Fish and Wildlife Service, Release No. 1-81, 103 ESM 103.
- Thomasma, L.E., Drummer, T.D. and Peterson, R.O. (1991) Testing the habitat suitability index model for the fisher. Wildlife Society Bulletin, 19, 291-297.
- Bender, L.C., Roloff, G.J. and Haufler, J.B. (1996) Evaluating confidence intervals for habitat suitability models. Wildlife Society Bulletin, 24, 347-352.
- Roloff, G.J. and Kernohan, B.J. (1999) Evaluating reliability of habitat suitability index models. Wildlife Society Bulletin, 27, 973-985.
- Prosser, D.J. and Brooks, R.B. (1998) A verified habitat suitability index for the Louisiana waterthrush. Journal of Field Ornithology, 69, 288-298.
- Clark, J.D. and Lewis, J.C. (1983) A validity test of a habitat suitability index model for clapper rail. Proceedings of the Annual Conference of the Southeastern Association of Fish and Wildlife Agencies, 37, 95-102.
- Cook, J.G. and Irwin, L.L. (1985) Validation and modification of a habitat suitability model for pronghorns. Wildlife Society Bulletin, 13, 440-448.
- Robel, R.J., Fox, L.B. and Kemp, K.E. (1993) Relationship between habitat suitability index values and ground counts of beaver colonies in Kansas. Wildlife Society Bulletin, 21, 415-421.
- Prose, B.L. (1985) Habitat suitability index models: Belted kingfisher. United States Fish and Wildlife Service Biological Report 82 (10.87).
- Short, H.L. and Cooper, R.J. (1985) Habitat suitability index models: Great blue heron. United States Fish and Wildlife Service Biological Report 82 (10.99).
- Allen, A.W. and Hoffman, R.D. (1984) Habitat suitability index models: Muskrat. United States Fish and Wildlife Service, FWS/OBS-82/10.46.
- Graves, B.M. and Anderson, S.H. (1987) Habitat suitability index models: Snapping turtle. United States Fish and Wildlife Service Biological Report 82 (10.141).
- Sousa, P.J. and Farmer, A.H. (1983) Habitat suitability index models: Wood duck. United States Fish and Wildlife Service, FWS/OBS-82/10.43.
- Zadnik, A.K. (2003) Wildlife use and habitat quality of back channel areas associated with islands on the Ohio River, West Virginia. Thesis, West Virginia University, Morgantown.
- United States Fish and Wildlife Service. (2002) Ohio River Islands National Wildlife Refuge, comprehensive conservation plan. United States Fish and Wildlife Service, Parkersburg.
- Hays, R.L., Summers, C. and Seitz, W. (1981) Estimating wildlife habitat variables. United States Fish and Wildlife Service, FWS/OBS-81/47.
- Orth, D.J. (1983) Aquatic habitat measurements. In: Nielsen, L.A. and Johnson, D.L., Eds., Fisheries techniques. American Fisheries Society, Bethesda, 61-84.
- ESRI, ARC/INFO. (1994) Version 7.01. Environmental Systems Research Institute, Redlands.
- Van Hassel, J.H., Reash, R.J., Brown, H.W., Thomas, J.L. and Matthews Jr., R.C. (1988) Distribution of upper and middle Ohio River USA fishes, 1973-1985 I., associations with water quality and ecological variables. Journal of Freshwater Ecology, 4, 441-458. doi:10.1080/02705060.1988.9665195
- Zadnik, A.K., Anderson, J.T., Wood, P.B. and Bledsoe, K. (2009) Wildlife use of back channels associated with islands on the Ohio River. Wetlands, 29, 543-551. doi:10.1672/08-46.1
- Cagle, F.R. (1939) A system of marking turtles for future identification. Copeia, 1939, 170-173. doi:10.2307/1436818
- User’s Guide. VersionSAS Institute. (1990) SAS/STAT 6, 4th Edition, Vol. 2, SAS Institute, Cary.
- Davis, W.J. (1982) Territory size in Megaceryle alcyon along a stream habitat. Auk, 99, 353-362.
- Vance, J.A, Angus, N.B. and Anderson, J.T. (2012) Riparian and riverine wildlife response to a newly created bridge crossing. Natural Resources, 3, 213-228. doi:10.4236/nr.2012.34029
- Gibbs, J.P., Woodward, S., Hunter, M.L. and Hutchinson, A.E. (1987) Determinants of great blue heron colony distribution in coastal Maine. Auk, 104, 38-47. doi:10.2307/4087230
- Watts, B.D. and Bradshaw, D.S. (1994) The influence of human disturbance on the location of great blue heron colonies in the lower Chesapeake Bay. Colonial Waterbirds, 17, 184-186. doi:10.2307/1521298
- Errington, P.L. (1937) Habitat requirements of streamdwelling muskrats. Transactions of the North American Wildlife Conference, 2, 411-416.
- Ernst, C.H., Barbour, R.W. and Lovich, J.E. (1994) Turtles of the United States and Canada. Smithsonian Institution Press, Washington DC.
- Bridges, C.M. and Semlitsch, R.D. (2002) Linking xenootics to amphibian declines. In: Lannoo, M., Ed., Status and Conservation of United States Amphibians, Consertion Essays, Vol. 1, University of California Press, Berkeley, in press.
- DonnerWright, D.M., Bozek, M.A., Probst, J.R. and Anderson, E.M. (1999) Response of turtle assemblage to environmental gradients in the St., Croix River in Minnesota and Wisconsin, U.S.A. Canadian Journal of Zoology, 77, 989-1000. doi:10.1139/z99-068
- Cottrell, S.D., Prince, H.H. and Padding, P.I. (1990) Nest success, duckling survival, and brood habitat selection of wood ducks in a Tennessee riverine system. In: Fredrickson, L.H., Burger, G.V., Havera, S.P., Graber, D.A., Kirby, R.E. and Taylor, T.S., Eds., Proceedings of the North American Wood Duck Symposium, St. Louis, 20-22 February 1988, 191-197.
- Minser, W.G. (1993) The relationship of wood duck brood density to river habitat factors. Proceedings of the Annual Conference of the Southeastern Fish and Wildlife Agencies, 47, 112-122.
- Webster, C.G. and McGilvrey, F.B. (1966) Providing brood habitat for wood ducks. In: Trefethen, J.B., Ed., Wood Duck Management and Research: A Symposium, Wildlife Management Institute, Washington DC, 70-75.
- McGilvrey, F.B. (1968) A guide to wood duck production habitat requirements. Bureau of Sport Fish and Wildlife Resources Publication, Washington DC, 60.
- Gilmer, D.S., Kirby, R.E., Ball, I.J. and Riechmann, J.H. (1977) Post-breeding activities of mallards and wood ducks in north-central Minnesota. Journal of Wildlife Management, 41, 345-359. doi:10.2307/3800504
- Haramis, G.M. (1990) The breeding ecology of the wood duck: A review. In: Fredrickson, L.H., Burger, G.V., Havera, S.P., Graber, D.A., Kirby, R.E. and Taylor, T.S., Eds., Proceedings of the North American Wood Duck Symposium, 20-22 February 1988, St. Louis, 45-60.
- Hein, D.A. and Haugen, A.O. (1966) Autumn roosting slight counts as an index to wood duck abundance. Journal of Wildlife Management, 30, 657-668. doi:10.2307/3798271
- Bellrose, F.C. (1980) Ducks, geese and swans of North America. Stackpole Books, Harrisburg.
- Balcombe, C.K. (2003) An evaluation of vegetative communities and wildlife habitat use in mitigated and natural wetlands of West Virginia. West Virginia University, Morgantown.