Open Journal of Statistics
Vol.3 No.3(2013), Article ID:33237,5 pages DOI:10.4236/ojs.2013.33022
Sequential Probability Ratio Test of Correlation Coefficient Using Fuzzy Hypothesis Testing
Department of Statistics, Hacettepe University, Ankara, Turkey
Email: sevil@hacettepe.edu.tr
Copyright © 2013 Sevil Bacanli, Duygu Icen. This is an open access article distributed under the Creative Commons Attribution License, which permits unrestricted use, distribution, and reproduction in any medium, provided the original work is properly cited.
Received March 19, 2013; revised April 22, 2013; accepted April 30, 2013
Keywords: Correlation; Sequential Probability Ratio Test; Fuzzy Hypothesis Testing
ABSTRACT
One of the important fields in statistics is testing hypothesis of correlation coefficient. The extension of the idea of testing correlation to fuzzy hypothesis is of great interesting. In this study, we examined the use of fuzzy hypothesis testing approach for the Sequential Probability Ratio Test (SPRT) of correlation coefficient. Use of fuzzy hypothesis testing for correlation coefficient with SPRT is illustrated by an example.
1. Introduction
Correlation coefficient (ρ) is found to have applications in some area such as medicine, genetics, psychology, numerical taxonomy and quality control [1]. In these areas, the data is obtained sequentially. Thus it is advantageous to use sequential tests.
Wald [2] proposed SPRT which is designed to decide between two simple hypotheses. SPRT require substantially fewer observations than fixed sample size test.
The SPRT for the correlation coefficient has been investigated by Choi [3], Kowalski [1] and Pradhan and Sathe [4]. Choi [3] developed a SPRT which is essentially a test for the Cauchy parameter. Kowalski [1] derived a SPRT under the bivariate normal distribution.
Pradhan and Sathe [4] proposed an unbiased estimator of correlation coefficient. This estimator suggested a SPRT for  which reduces to an SPRT for the Bernoulli parameter
 , which is a simple function of, but two pairs of observations need each step. Pradhan and Sathe’s SPRT is more efficient than Kowalski’s and Choi’s tests [4].
There are several components for making decisions in traditional statistics such as crispness of data, random variables, hypothesis testing, decision rules and so on. There have been several attempts to analyze above situations with fuzzy set theory developed by Zadeh [5]. One of them is fuzzy hypothesis testing procedure. In fuzzy hypothesis testing the sample data and hypotheses are either crisp or fuzzy. In this study we focus on fuzzy hypothesis with crisp observations.
Several authors have proposed SPRT for fuzzy case. Neyman Pearson lemma for fuzzy hypothesis testing was given by Taheri and Behboodian [6]. Torabi and Behboodian [7] gave the SPRT for fuzzy hypothesis testing with fuzzy observations. Talukdar and Baruah [8] have fuzzified SPRT. Torabi and Mirhosseini [9] introduced a SPRT for fuzzy hypothesis testing. They developed fuzzy SPRT for testing the mean of Normal distribution with known variance and the parameter of Bernoulli distribution  Akbari [10] proposed a new approach for SPRT of fuzzy hypothesis under density probability function. Testing hypothesis concerning correlation coefficient with fuzzy data was investigated by Leu et al. [11].
In this study, we apply SPRT to test fuzzy hypothesis for the correlation coefficient of a bivariate normal distribution. Then this method is demonstrated by an example.
This paper is organized as follows: in Section 2, SPRT for the correlation coefficient [4] is given. In Section 3, some of the basic concepts of fuzzy hypothesis testing are defined and reviewed. In Section 4, Torabi and Mirhosseini’s SPRT approach for Bernoulli parameter is given [9]. In addition we apply this fuzzy SPRT to test fuzzy hypothesis for the correlation coefficient. Then an example and conclusion are presented in Sections 5 and 6.
2. Sequential Test for the Correlation Coefficient
Let the independent random variable  be from bivariate normal distribution. Than the correlation coefficient is given as
 (1)
(1)
Let the hypothesis to be tested be
 (2)
(2)
where  is a positive or negative constant
 . Pradhan and Sathe [4] gave Theorem 1 which establishes a basic relationship between correlation coefficient
  and the Bernoulli parameter
Theorem 1: Let the independent random variables  be from bivariate Normal distribution
 . Then,
 (3)
(3)
In the sequential testing procedure, it is taken two pairs of observations at each step. At the ith step it is defined as,
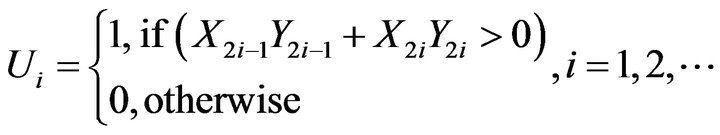 (4)
(4)
Then  follows Bernoulli distribution with
 . (5)
. (5)
Hence hypotheses for the correlation coefficient (2) can be written as,
 (6)
(6)
and SPRT for the Bernoulli parameter can be applied [2].
For testing  versus
  SPRT is defined as follows:
Let  be a sequence i.i.d. rv’s from Bernouilli distribution Ber
  where
where ,
,
 (7)
(7)
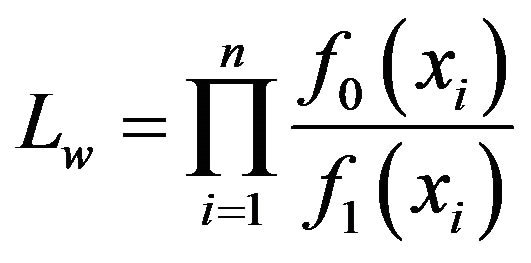
then the likelihood ratio is,
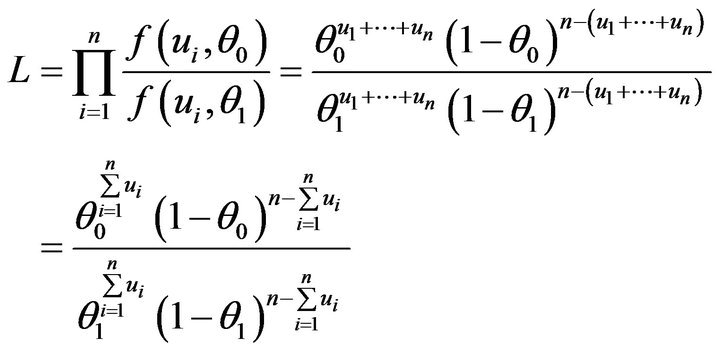 (8)
(8)
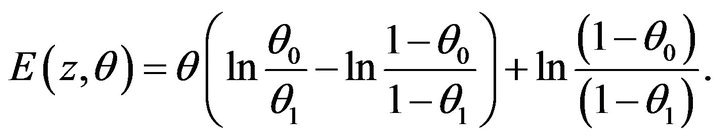
By taking logarithm and simplifying, Equation (8) can be written as,
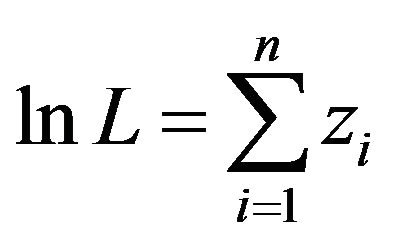 (9)
(9)
where ![]() is taken as following
is taken as following
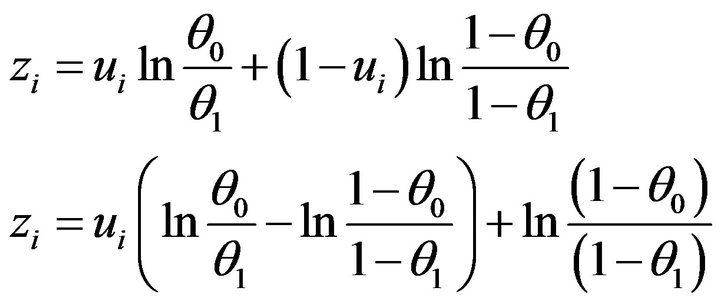 (10)
(10)
Hence
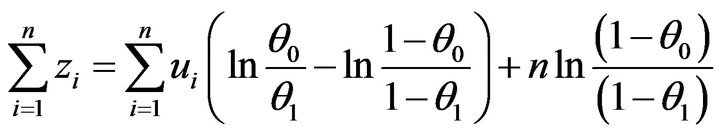 . (11)
After each observation is computed the  and compared with
  and
and
 , where
 ![]() is the type I and
is the type I and  is the type II error probability. Then one of the following decisions is reached 1) If
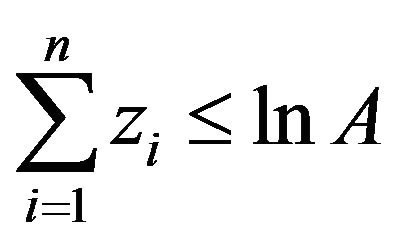 , reject
  and stop sampling.
2) If 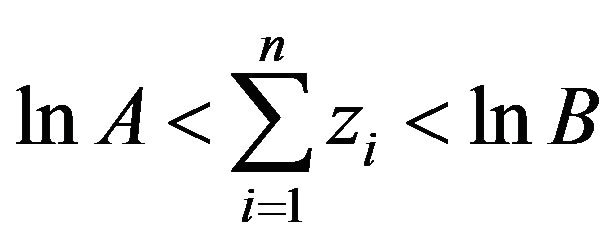 continue sampling.
3) If 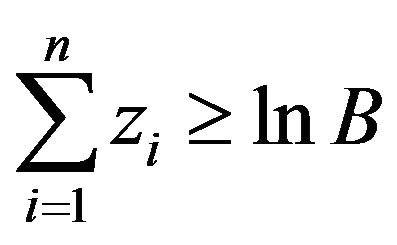 accept
  and stop sampling.
Let  be the random variable denoting the sample size of the SPRT. The SPRT with
 ![]() and
and , expected sample size when the
  is true,
 (12)
(12)
otherwise, when  is true,
 (13)
(13)
where  is defined as from Equation (10) (
 )
)
 (14)
(14)
Pradhan-Sathe’s [4] SPRT need two pairs of observations each step. Therefore, the expected sample size of this SPRT is given by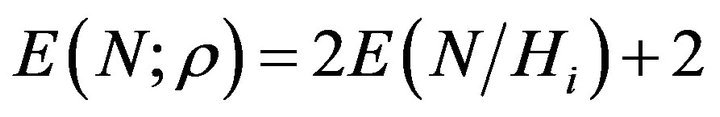 , for
, for .
.
3. Fuzzy Hypothesis Testing
We may face a fuzzy hypothesis in practice in many areas [6,9,12]. Hence, in this section we briefly introduce some definitions about fuzzy hypothesis testing (FHT).
Preliminaries
Some preliminaries are given below for testing fuzzy hypotheses.
Definition 3.1 Any hypothesis of the form “ ” is called fuzzy hypothesis (FH), where “
 ” implies that
  is in a fuzzy set of
  (the parameter space) with membership function
  i.e. a function from
  to
to .
.
Note that the ordinary hypothesis  is a fuzzy hypothesis with membership function
  at
at , and zero otherwise, i.e., the indicator function of the crisp set
  [6,7]
[6,7]
Definition 3.2 In FHT with crisp data, the main problem is testing
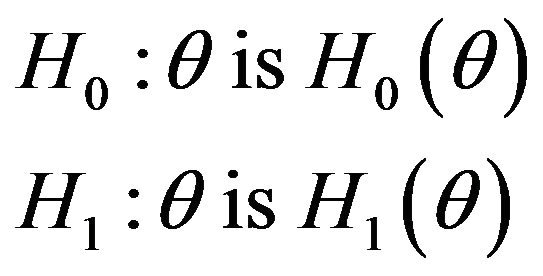 (15)
(15)
according to a random sample  from a parametric population with the probability density function (PDF)
 . It follows that the PDF of the random sample X is [12]
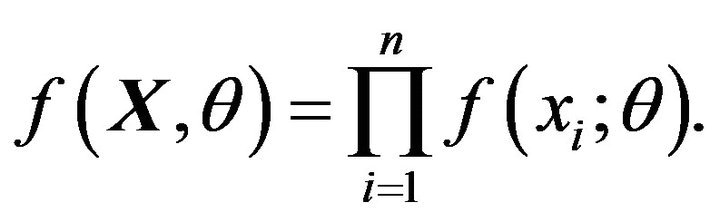 (16)
(16)
Definition 3.3 The pseudo-membership function of  is defined by
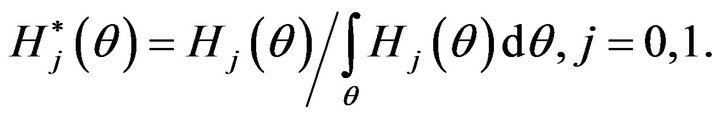 (17)
(17)
Substitute ∫ by  in discrete cases; i.e. in the case that
  has just uncountable values [9].
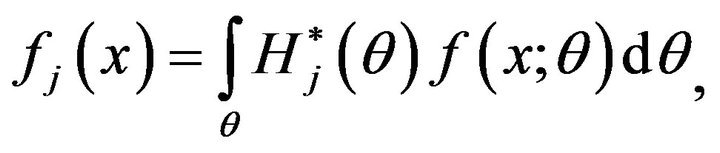
Definition 3.4 Let X be a random variable with PDF . Under the hypothesis
 , the weighted probability density function (WPDF) of X is defined by
 (18)
(18)
i.e., the expected value of  over
over
 If X is a random sample from PDF
 , then the joint WPDF of X is defined by
 . (19)
Then the weighted likelihood ration is defined as [6]
 . (20)
4. Fuzzy Hypothesis Testing for the Sequential Probability Ratio Test of Correlation Coefficient
It is known that correlation coefficient is related to the Bernoulli parameter  [4]. In the sense of this information which is given in Section 1 with Theorem 1, hypothesis testing for correlation coefficient with Equation (2) can be written as
 (21)
(21)
Therefore, Torabi and Mirhosseini’s [9] fuzzy SPRT for the Bernoulli parameter can be applied. For testing (21) fuzzy SPRT is defined as follows:
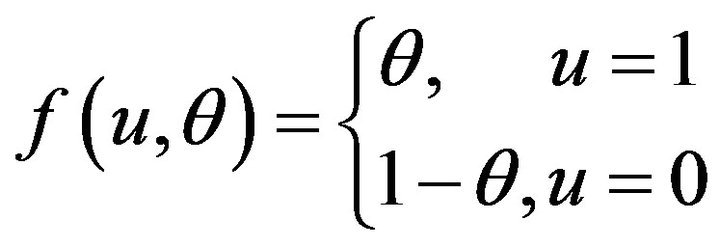
Let  be a sequence of i.i.d. r.v.’s from Bernoulli distribution
 ,
,
 . (22)
We want to test
 (23)
(23)
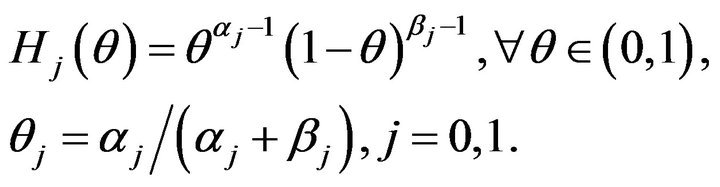
with the membership functions [9]
 (24)
(24)
The pseudo-membership function of  is defined from Definition 3.3,
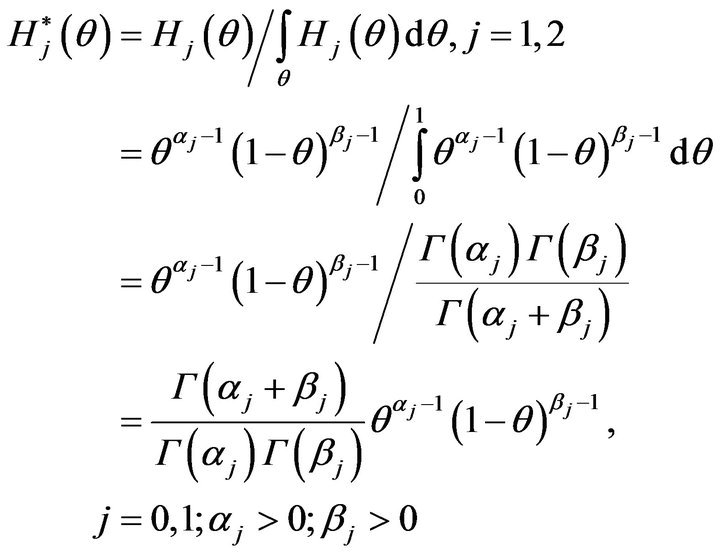 (25)
(25)
Hence  is Beta distribution. The weighted probability density function of
  is defined by (Definition 3.4)
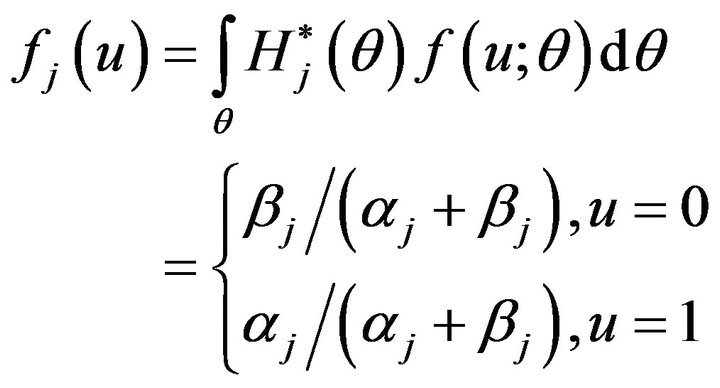 (26)
(26)
Hence the FHT (Equations (23)) is equivalent to
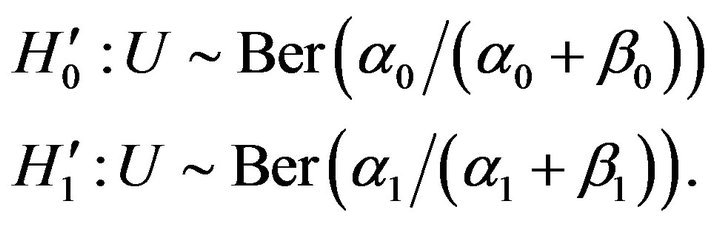 (27)
(27)
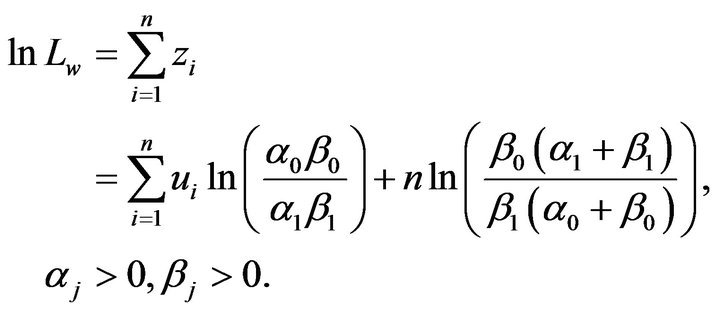
Thus, test statistics for the sequential FHT weighted probability density function can be defined as
 . (28)
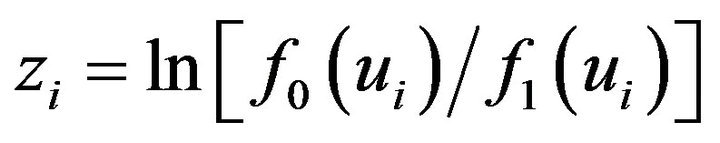
Then SPRT test statistic defined in Section 2 can be obtained as
 . (29)
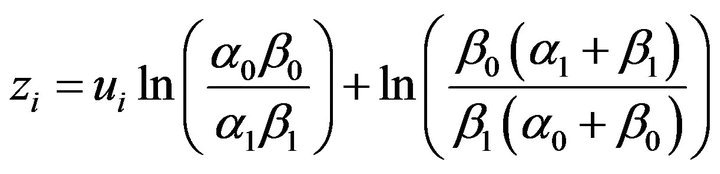
Hence,
 (30)
(30)
Expected value of  and
and  is defined as
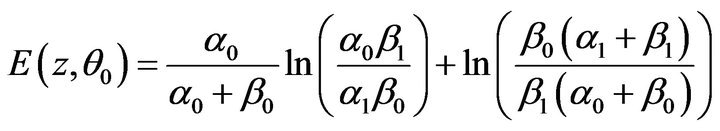 (31)
(31)
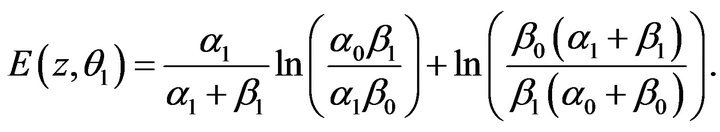 (32)
(32)
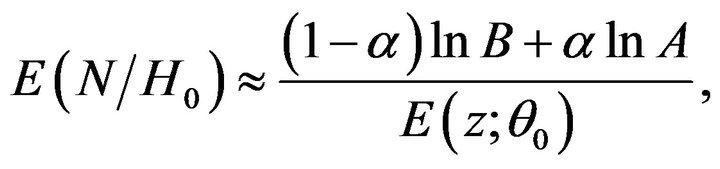
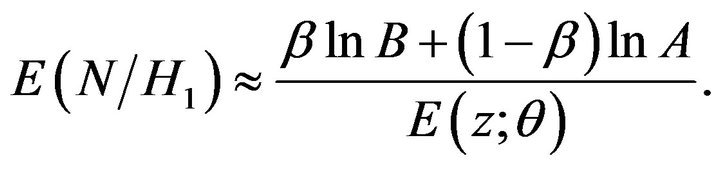
Let N be the random variable denoting the sample size of the fuzzy SPRT. The fuzzy SPRT with ![]() and
and , the expected sample size when
  is true,
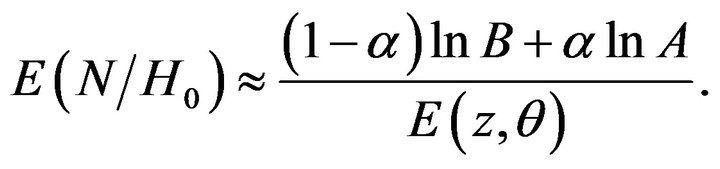 (33)
(33)
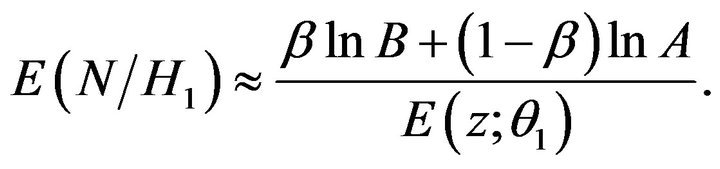
Otherwise, when  is true,
 (34)
(34)
As it is mention in Section 2, SPRT’s observation equation which is 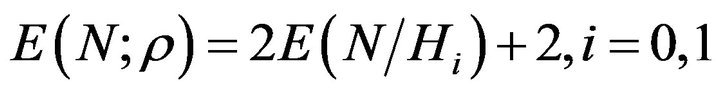 is still valid for the FHT of correlation coefficient.
Therefore in this study we showed that fuzzy hypothesis testing for correlation coefficient can be applied using Torabi and Mirhosseini’s [9] SPRT.
5. Example
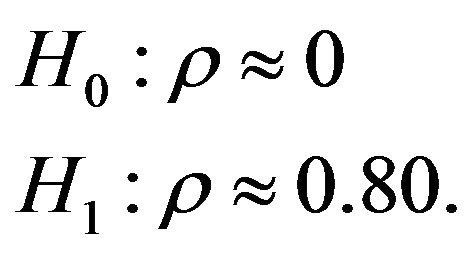
In this section we present an example to clarify the method so far. Let  be a sequence from iid r.v.’s from Bivariate Normal distribution. We want to test
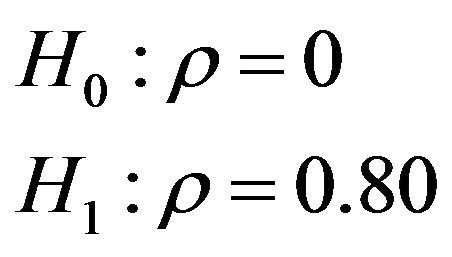 (35)
(35)
It is possible to write this hypothesis as follows according to the information given with Theorem 1 in Section 2
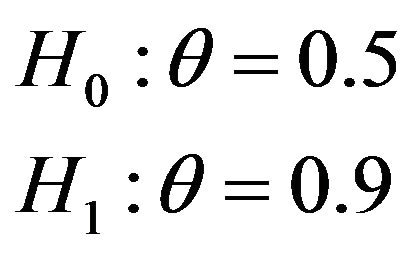 (36)
(36)
Let  and
and  then we calculate
 and
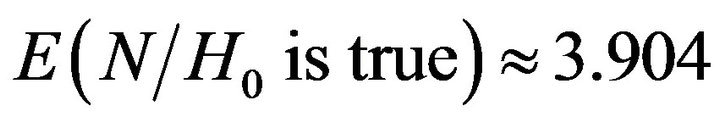
and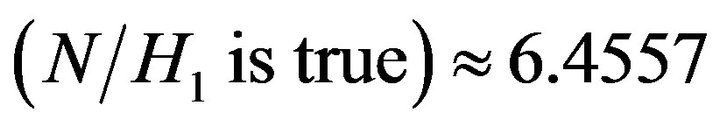 . It is known that Prathan-Sathe’s [4] SPRT needs two pair of observations each step. Therefore the expected sample size of this SPRT is given by
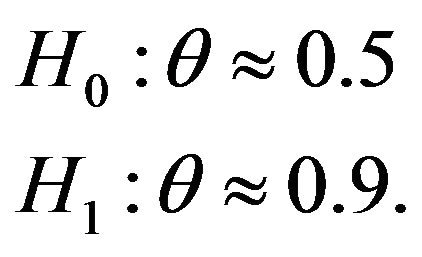
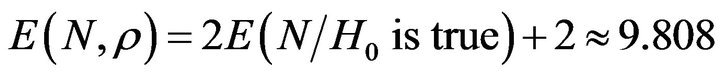 . These results are obtained by applying classical hypothesis testing procedure which is assumed that both the underlying hypotheses are crisp. However, we want to test if the correlation coefficient is nearly zero or nearly 0.8. Because fuzzy approaches are extremely popular in real life situations and it ensures to obtain closer values to real results [6,8,11]. Hence crisp hypothesis turns into fuzzy hypothesis given below
 (37)
(37)
It is known that  and
and . Then we write this hypothesis with Equation 38 by combining the information given in Section 2 and Section 3 as
 (38)
(38)
In addition, we determined ,
,
 ,
, . Then, membership functions can also be defined as
 (39)
(39)
Afterwards we calculate  and
and
 ,
,  and
and
 Hence we obtain
 and
and
 .
.
6. Conclusion
In this study, the use of SPRT to test fuzzy hypothesis concerning the correlation coefficient for the bivariate normal distribution is examined. It is known that one can develop SPRT for simple fuzzy hypothesis for correlation coefficient. However, in real world, we may confront with fuzzy hypothesis. According to recent studies, the methods taking into account the statistical hypothesis with fuzzy approaches can be so worthwhile. Thus, in this study, we showed that fuzzy hypothesis testing procedure can be used for SPRT of correlation coefficient.
REFERENCES
- C. J. Kowalski, “The OC and ASN Functions of Some SPRT’s for the Correlation Coefficient,” Technometrics, Vol. 13, No. 4, 1971, pp. 833-840. doi:10.1080/00401706.1971.10488853
- A. Wald, “Sequential Analysis,” John Wiley & Sons, Inc., New York, 1947.
- S. C. Choi, “Sequential Test for Correlation Coefficients,” Journal of the American Statistical Association, Vol. 66, No. 335, 1971, pp. 575-576. doi:10.1080/01621459.1971.10482308
- M. Pradhan and Y. S. Sathe, “An Unbiased Estimator and a Sequential Test for the Correlation Coefficient,” Journal of the American Statistical Association, Vol. 70, No. 349, 1975, pp. 160-161. doi:10.1080/01621459.1975.10480278
- L. A. Zadeh, “Fuzzy Sets,” Information and Control, Vol. 8, No. 3, 1965, pp. 338-353. doi:10.1016/S0019-9958(65)90241-X
- S. M. Taheri and J. Behboodian, “Neyman-Pearson Lemma for Fuzzy Hypotheses Testing,” Metrika, Vol. 64, No. 3, 2006, pp. 289-304. doi:10.1007/s00184-006-0049-8
- H. Torabi and J. Behboodian, “Sequential Probability Ratio Test for Fuzzy Hypotheses Testing with Vague Data,” Austrian Journal of Statistics, Vol. 34, No. 1, 2005, pp. 25-38.
- R. Talukdar and H. K. Baruah, “Sequential Probability Ratio Test with Fuzzy Observations,” The Journal of Fuzzy Mathematics, Vol. 15, No. 3, 2007, pp. 627-643.
- H. Torabi and S. M. Mirhosseini, “Sequential Probability Ratio Tests for Fuzzy Hypotheses Testing,” Applied Mathematical Sciences, Vol. 3, No. 33, 2009, pp. 1609-1618.
- M. G. Akbari, “Sequential Test of Fuzzy Hypothesis,” American Journal of Statistics, Vol. 1, No. 2, 2011, pp. 87-92. doi:10.4236/ojs.2011.12010
- C. H. Leu, C. C. Chen, and C. M. Lai, “Testing Hypothesis Concerning Correlation Coefficient with Fuzzy Data,” 5th International Conference on Fuzzy Systems and Knowledge Discovery, Jinan, 18-20 October 2008, pp. 635-643. doi:10.1109/FSKD.2008.352
- H. Torabi and J. Behboodian, “Likelihood Ratio Tests for Fuzzy Hypothesis Testing,” Statistical Papers, Vol. 48, No. 3, 2007, pp. 509-522. doi:10.1007/s00362-006-0352-5