Open Journal of Statistics
Vol. 2 No. 5 (2012) , Article ID: 25545 , 7 pages DOI:10.4236/ojs.2012.25063
An Integrated Statistical Model to Measure Academic Teaching Quality
Department of Economics and Management, University of Pavia, Pavia, Italy
Email: paola.cerchiello@unipv.it, giudici@unipv.it
Received September 13, 2012; revised October 15, 2012; accepted October 26, 2012
Keywords: Teaching Quality; Perceived Quality; Non-Parametric Indexes
ABSTRACT
The aim of this paper is to present a new proposal for the classification of Academic institutions in terms of quality of teaching. Our methodological proposal borrows concepts from operational risk, such as scorecard models, employed to assess University performances, on the basis of both the perceived and the actual quality. We propose to summarize opinion data using new non parametric indexes able to exploit efficiently the ordinal nature of the analysed variables and to integrate different sources of data. In particular we show how web survey methods can improve the quality and robustness of collected data, especially when integrated with students career data. Empirical evidence is given on the basis of real data from the University of Pavia.
1. Introduction
In this paper we present models for the evaluation of the quality of Academic teaching. The objective of the proposed methodology is to evaluate and, therefore, to improve the quality of University institutions. The quality of University teaching depends mainly on the performances of its students who, thereby, represent the main actors of the analysis. Indeed choosing the right institution could be a key decision for the students future. Moreover University rankings are becoming very important as reputational indicators: an institution with a good ranking position could have a better capacity of attracting students, professors, resources and better chance to participate into important international research projects and meetings. Media attention is very high for rankings such as the Academic Ranking of World Universities (Shanghai Jiao Tong), as in [1], Times Higher Education World University Rankings, as in [2], D. (2010). Such articles mainly debate on pros and cons of the employed methodologies to produce the relative rankings: the size of the sample size, the typology of survey, the weight assigned to each indicators, the number of indicators. However we believe that also local evaluations should be relevant: they would give the opportunity to an Academic institution to identify, evaluate and classify the risk factors that could affect the global quality of the institution, considering the characteristics and opportunities offered by the territory in which it is located and not only international criteria. To achieve this aim we propose to summarize students perceived quality data (subjective component) and actual quality data (objective component) based on University careers, using new non parametric indexes able to exploit efficiently the ordinal nature of the analysed information. Using such summary indexes, we can obtain a ranking of the taught courses, either considering one aspect per time or in an aggregative way. The final purpose of our analysis is producing indicators that allow the institutional boards, responsible of the organization of teaching activities, to formulate evaluations on the didactic ability of the teachers and consequently planning actions on the organizational component and on the relationship between didactics and adequacy of the resources. The paper is organized as follows: Section 2 describes the context of analysis, Section 3 presents the new proposed indexes, Section 4 shows the application on the available data and Section 5 illustrates the conclusions.
2. Web Based Quality Assessment
Assessing the quality of university teaching is a difficult process and the most employed practices analyse student satisfaction questionnaires that measure perceived quality and elaborate them using simple quantitative indicators. Here we present what experimented at the University of Pavia within the context of a research project funded by the Italian evaluation agency CNVSU. In order to improve the teaching quality we have implemented a webbased questionnaire that is compiled by the whole corpus of students in a mandatory way. The experimentation, whose results we are going to present, has been successful: the outcomes have been presented and agreed upon in a National conference and the University of Pavia itself is expected to extended the experimentation to all courses by the and of the year 2013. A relevant innovation of the project is the proposal of new statistical methods to analyse the data that respect their ordinal nature. Before presenting such proposal we inform the reader that after the completion of CNVSU project the authors have entertained further research within the project UNI5NET4STUDENTS granted by the Italian Ministry of Public Administration. Therefore we present the statistical methodologies employed in both the projects and the relative application to the experimental data collected by the University of Pavia.
3. Methodological Proposal
In this section we borrow some concepts from operational risk (e.g. [3-6]). Our aim can be seen as an attempt to present efficient statistical methods aimed at measuring the performance of academic services, through the development of appropriate operational performance and risk indicators. From a managerial aspect, the issue is to properly rank operational risks, say from high priority to low priority, thus to identify fine tuned management decisions and actions directed at improving preventive controls on such risks. In general, the measurement of operational risks leads to the measurement of the efficacy of controls in place: the higher the operational risks, the worse such controls. This points towards a potential efficiency problem. The scorecard approach develops the so-called Self Assessment, based on the experience of a number of internal experts of an institution who usually correspond to different areas of activities or processes. An internal procedure of self assessment can be periodically carried out through questionnaires, submitted to such experts. The collected questionnaires give information on which risks are perceived as most important by the chosen experts, for a future given period. Here we will deal with data derived by questionnaires, compiled by the University students at the end of each course. University students can thus be considered as the experts, evaluating University courses and giving information about the quality of the didactics. Once interviews are collected, the aim is to assign a ranking or rating to each risk event, based on the distribution of the opinions. As described in [7], to assign such ordinal “rating” to the event under analysis (items of the questionnaire), they propose to employ the median as a location measure for each distribution, and the normalized Gini index as an indicator of the “consensus” on such location measure. This results in 4 rating measures for each event, expressed using the conventional risk letters: A for low riskB for medium risk, C for higher risk and D for highest risk. While the median is used to assign a “single letter” measure, the Gini index is used to double or triple the letter, depending on its value.
Several methodologies that take both opinions and data into account, are described for example in [8] and [9]. [8] proposes to quantify and measure operational risk according to a scorecard approach, by collecting expert opinions on each combination business line/event type, in order to overcome the chronic scarcity of quantitative data in such context. [9] propose to measure operational risk by means of a fuzzy approach able to exploit both the qualitative and quantitative data thanks to an interval representation of the data. Recently [10] proposed position indexes based on ordinal variables from discrete parents to efficiently summarize questionnaire items when the number of observations is limited.
In this paper we propose a different approach that exploit two types of information: on one hand quality perception questionnaires and on the other hand the careers of student in terms of velocity in passing exams. The questionnaire is filled by the students in an anonymous way, during the on-line registration to the exam. Since June 2010 it is mandatory to compile the questionnaire at the moment of the exam registration: it is not possible to take an exam without compiling the whole questionnaire. Moreover the questionnaire has two sections: one for the students that actually attended the class under consideration, one for the ones that did not attend. In this way the questionnaire structure permits to evaluate the opinion of the students who really have knowledge on the course contents and the Professor performance. Such questionnaire is considered as a proxy of the quality of the course as perceived by each student, thus representing the subjective component of the analysis being based on personal perceptions. Course quality is to be evaluated not only using perceived quality but also effective quality. According to the standards defined by the Italian Minister of University Education, a University course can be considered of good quality according to different indicators, in particular a rather objective information is the number of years needed to pass the exam. In other words, if students pass the exam related to each course within one academic year, we can conclude that the teaching impact and efficiency is of high level. Conversely, a delay in taking the exam is considered a symptom of low quality. The structure of the two databases, related to the subjective and objective quality, will be described in details in the application section.
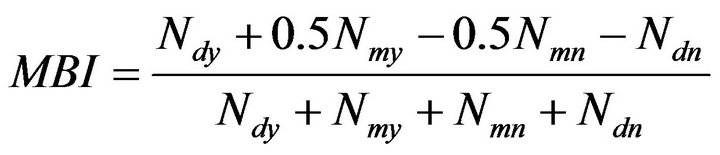
Starting from what exposed above, we focus on developing a new method, that allow complete ordering of the University courses exploiting subjective and objective components. A first possible solution is applying a weighted mean of the modalities, as in the following index, named Mean Based Index (MBI):
 (1)
(1)
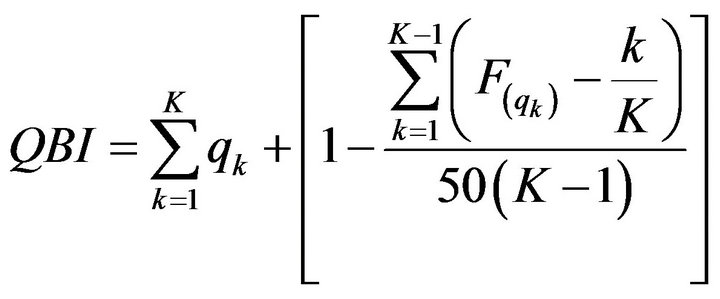
where Ndy, Nmy, Nmn and Ndn point out, respectively, the number of questionnaire responses “definitely yes”, “more yes than no”, “more no than yes” or “definitely no”. The MBI index can then lead to an aggregated value for all items by taking the arithmetic mean among the MBI derived by each question. Note that the MBI index is calculated with default weights for the four possible modalities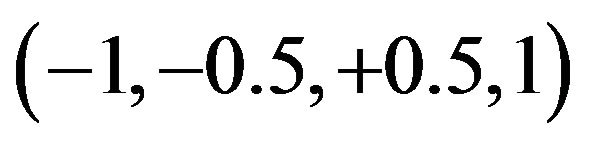 . Note that the above index can combine the information in the two quality data base by taking, for example, the arithmetic mean of the two corresponding indicators. This because the arithmetic mean is known to possess the associative property. Although the previous index has good properties, our purpose is to obtain new indexes, useful to aggregate different modalities in a single evaluation, but avoiding default weights, that imply an arbitrary quantifications of modalities. Thus we summarize (academic) evaluation data by using an index based on quantiles and frequency excesses of the cumulative distribution function [10]. Such index named Quantile Based Index (QBI) is flexible and depends on the scale employed within questionnaires. QBI is formulated as follows:
 (2)
(2)
or
 (3)
(3)
where K is the number of points of the measurement scale,  is the cumulative distribution function,
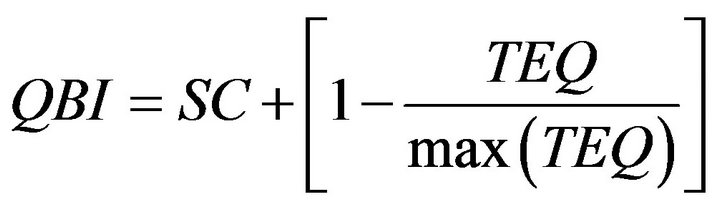
 (named SC) is the sum of the K points scale that contain the predefined quantiles, TEQ is the sum of the total frequency excesses at each predefined quantile, whose normalization is obtained dividing it by its maximum (equal to 50(K−1)). For example, if we have a 4 points scale for a given question or item, we will employ the 4 associated quartiles (25˚, 50˚, 75˚ and 100˚) as follows. First we verify in which point scale the first quartile obtains at least 25% of the cumulative distribution function. The obtained point scale is the first term of the SC component. The difference between the cdf calculated in the point scale and the 25% is the first term of the TEQ component. Second we verify in which point scale the second quartile obtains at least 50% of the cdf. The obtained point scale is the second term of the SC component. The difference between the cdf calculated in the point scale and the 50% is the first term of the TEQ component. We proceed analogously for the remaining terms. Note that the part of the index due to the SC quantity establishes the position of the course at hand (our interest unit in this case) on a discrete scale, according to the range reported in Table 1. On the other hand, in order to avoid a step function effect, we add the normalized TEQ part that plays the role of a smoother allowing a differentiation among courses sharing the same SC. The proposed index can be normalized according to a [0;1] range. Considering α as the minimum and β as the maximum values assumed by QBI, we can define QBI' as follows:
 (4)
(4)
Note that α ≤ QBI ≤ β and thus . For sake of interpretability we can adapt the normalized index to a predefined range, say between γ and δ. For this purpose we set:
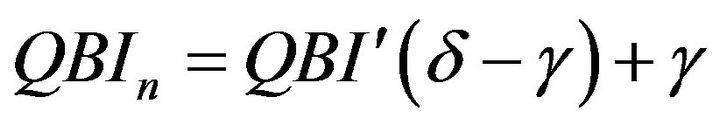 (5)
(5)
From (5), note that
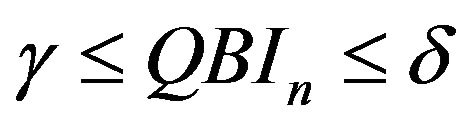 (6)
(6)
and in our applied context, we set γ = 0, δ = 100 and, therefore,
 (7)
(7)
For sake of clarity, let us consider the following example: an hypothetic academic course has reported a distribution function for the four modalities as reported in Table 1.
On the other hand, we can apply to the data a new non parametric index, built on the basis of the cumulative distribution function alone, which embodies the essential information for ordinal data. We propose to consider the sum of the values of the cumulative distribution function, according to the stochastic dominance approach to model selection that we now describe. It is well know that the cumulative distribution function is a monotonously increasing (or more precisely, non decreasing) function bounded between 0 and 1. On the basis of the cumulative distribution function, a summary index, that we name SDI (Stochastic dominance index) can be calculated as
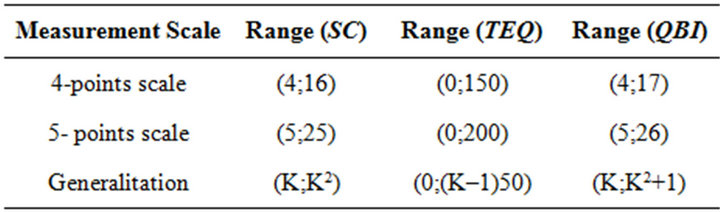
Table 1. Range of QBIn index according to different measurement scale.
follows:
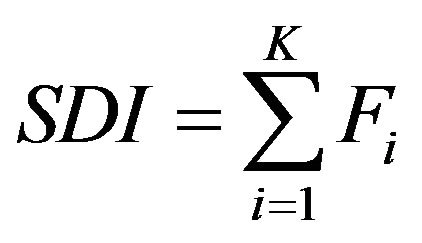 (8)
(8)
where F is the cumulative distribution function, and K the number of classes. A normalized version  is obtained dividing it by its maximum value, J, which is attained when all data points are concentrated in the lowest class. Note that, this index is based on the cumulative distribution function as the index suggested by Leti.
However, while the SDI index is a second order stochastic dominance measure, based on the arithmetic mean ideal for comparison purposes, Leti’s index aims to measure heterogeneity between statistical units. We believe that our proposal is more convenient, because the index maintains the ordinal nature of the data, it is not based on parametric assumptions and its construction is simple to communicate and to interpret.
For communication purposes and comparability to QBIn we adapted the normalized index to a different range as in Equation (5):
 (9)
(9)
In Tables 2-4 we report an example on how to compute QBI and SDI indexes for a given academic course.
4. Application
As introduced in Section 3, we consider two different data sets. The first one is related to perceived quality: since February 2010 the first pilot Faculty of the University at hand has adapted a new web-based system to collect the answers of the didactic evaluation questionnaires. At the time of the on-line registration to the exam is given to the student the possibility of compiling the questionnaire regarding that particular course in an anonymous way. Since June 2010 it is mandatory to compile the questionnaire at the moment of the exam registration: it is not possible to take an exam without compiling the whole questionnaire. The questionnaire has two sections: one for the students that actually attended the classes, one for the ones that did not attend. Concerning items, many questions are typically contained in such questionnaire for didactics evaluation. Here we focus our attention on the item that summarizes the overall satisfaction of the student embodied in the following question: E2) “Are you overall satisfied of this course?”
The format of the four-level scale adopted to evaluate courses in our case is the following:
1) Definitely yes (dy);
2) More yes than no (my);
3) More no than yes (mn);
4) Definitely no (dn).
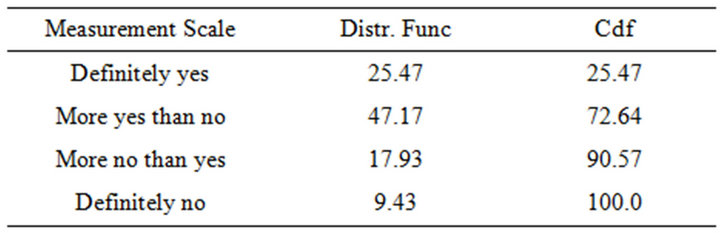
Table 2. Distribution function of a given academic course.
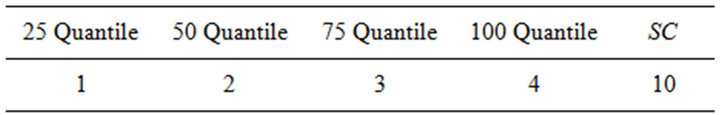
Table 3. Sum of the category codes of a given academic course.
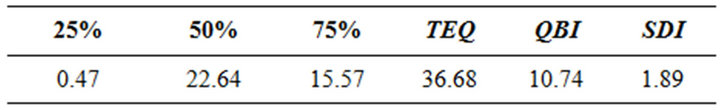
Table 4. Sum of excesses, QBI and SDI.
We have examined all the on-line data updated to October 2010: the total number of web questionnaires compiled between February and October is 10,929. Before calculating any index we have fixed a threshold to exclude the courses which presented a collected number of questionnaires lower than 5 observations. After this selection and aggregating by course, the data set is composed of 167 observations: each row (statistical unit) represents a course held by a specific Professor.
In Table 5 we compared subjective and objective quality of a course. The letter A indicates respectively the percentage of “Definitely yes” and the percentage of “Exam taken within less than one year”. Thus, we obtain two different ratings regarding a course. Such approach can be useful in a descriptive context and to evidence risk factors, but could be limited in the integration between perceived and actual quality. Thus, we tried to obtain a synthetic score applying the SDIn and the QBI indexes to both career and web questionnaire results. Table 6 reports the SDIn and the QBIn scores based on the on-line data. From Table 6 appears that QBIn re sults to be more severe since only the 9.2% of the courses reaches the highest scores compared to a 13.1% assigned by SDIn index. In general QBIn tends to assign lower scores and it is possible to say that the overall satisfaction expressed by student is good.
The second considered data set collects the data about actual quality: we considered a period of six years, 2004- 2010, and analysed student careers, calculating any delay in taking exams, as previously described. The data available for our analysis contain information about 105,114 passed and not passed exams. As for the perceived quality data set, we aggregated the data to obtain 397 rows, each row representing a specific course. The columns
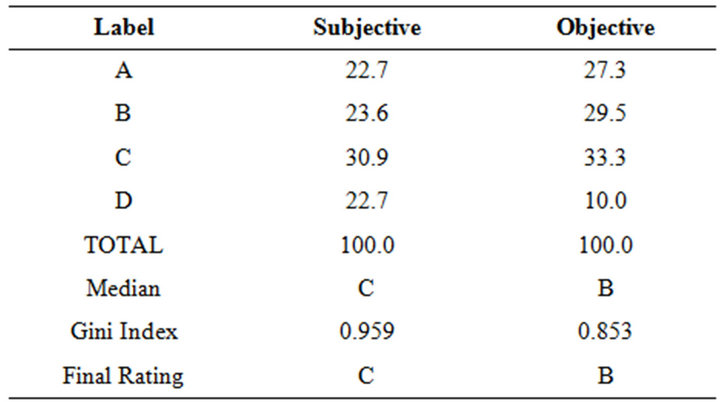
Table 5. Distribution of subjective and objective components according to the 4 ordinal levels.
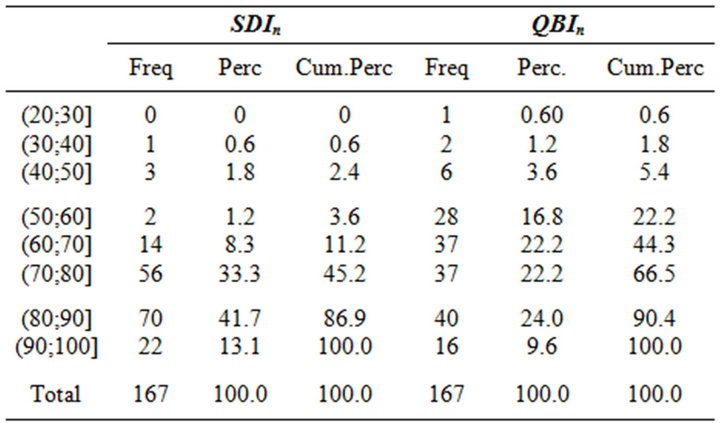
Table 6. Distribution of courses based on SDIn and QBIn: variable E2.
report the percentage correspondent to each value of the four-level scale, for instance “Exam taken within less than one year”, “Exam taken within less than two years” and so on. Then we calculated the SDIn index, in this case about student careers, to obtain a possible ranking in terms of actual quality. Our aim is to integrate both perceived and actual quality, and an evaluation synthetic index. First we matched the two data set, according to the exam identification code. Since our research starts in 2004, during the years not all the courses are held by the same Professor. We chose only the courses with a perfect match between the two data sets: through this selection the courses available for our analysis are 167.
Table 7 reports the SDIn and the QBIn scores based on carrers.
As for the questionnaires data, QBIn offers lower scores, in fact we have 6 courses in the class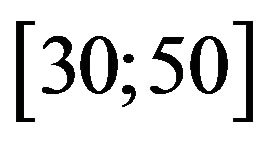 , that results to be empty for SDIn index. Moreover QBIn scores only 12 courses in the highest class, instead SDI presents 34 courses in the same class. Table 8 shows such comparison, in terms of quartiles. We recall that the comparison is allowed by the normalization activity applied to the two indexes. The evaluations of the courses drawn through the QBIn index are more severe in comparison to those of the other indexes. In our opinion, such characteristic of QBIn index allows a better and more
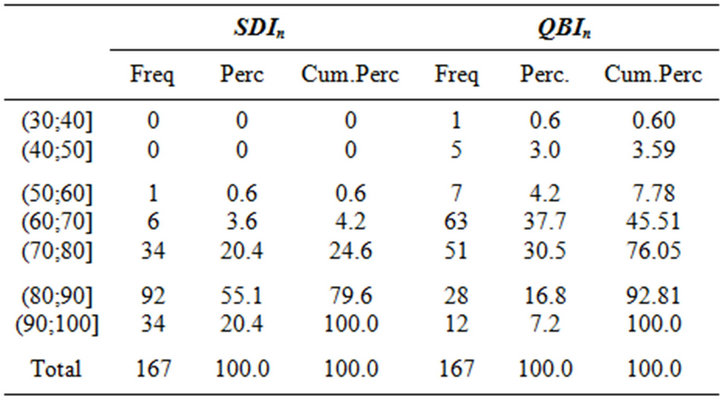
Table 7. Distribution of courses based on SDIn and QBIn: based on career.
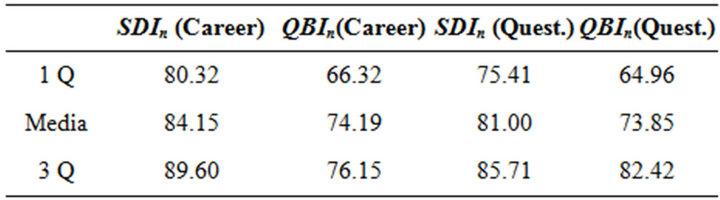
Table 8. Indexes comparison by quartiles.
appropriate ordering of the courses that are splined on a wider range of values in comparison to SDIn. In fact it is evident that SDIn is less heterogeneous and tends not only to push up courses evaluation but also to produce more optimistic results.
Thus, we show in Tables 9 and 10 the best and the worse 5 courses ordered respectively according to questionnaires and careers data. In the first positions appears mainly economics and management courses, instead lower positions are more heterogeneous and as expected a quantitative course is present. In particular it is interesting to observe that the worse courses in terms of personal evaluation seem to be not so difficult from the career point of view. Instead the courses more difficult for student received heterogeneous evaluations: in particular one exam of economics has a score equal to 82.18 that is rather high.
We recall that our final aim is to aggregate subjective and objective quality indexes: it is possible to use a weighted arithmetic mean. Since we are considering two data sets, often the number of students considered as a weight for calculating the career is very different in comparison to the number of compiled questionnaires used as the web weight: for instance the course “Marketing” counts for 236 student careers and 132 compiled web questionnaire.
Table 11 presents the courses sorted according to the weighted arithmetic mean (WAM) values. Through this new ranking we notice that appear some courses different from the previous ones. In comparison to the non-aggregated ranking, a good presence of courses regarding “Human resources” and “Organizational” is remarkable among the best courses. On the other hand it is meaning-
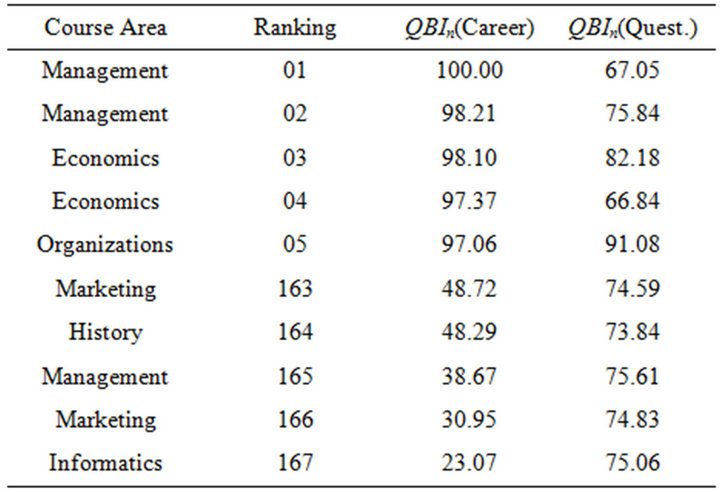
Table 9. Rankings based on QBIn scores sorted by questionnaire.
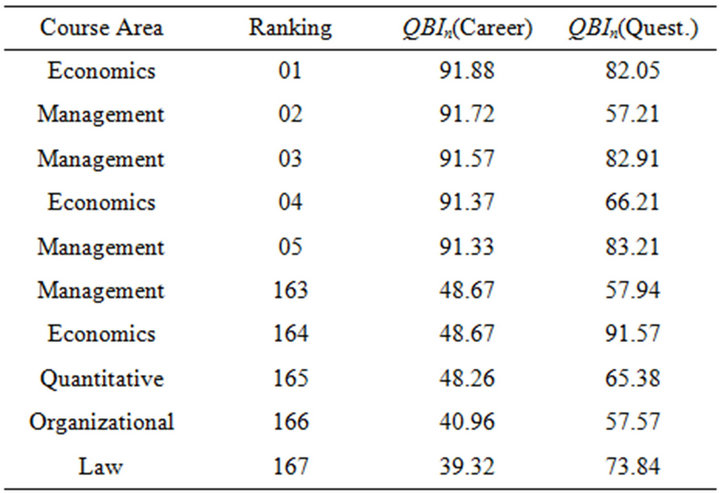
Table 10. Rankings based on QBIn scores sorted by career.
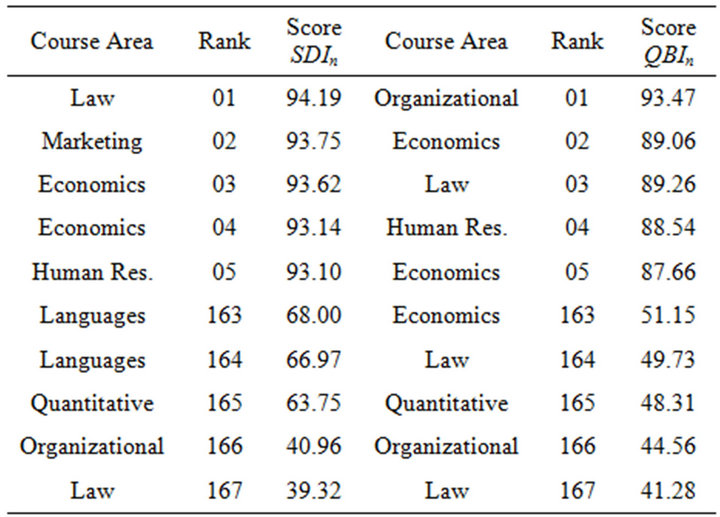
Table 11. Rankings based on weighted arithmetic mean for SDIn and QBIn.
ful that among the worst courses, several regards quantitative subjects, in particular mathematics.
5. Conclusions
In this paper we have presented indexes that can be usefully employed to assess University teaching performances. We started from the operational risk management framework from which we have borrowed the concepts of scorecard approach and ranking. We have compared two possible approaches based respectively on: quantile ranks and frequency excesses on such quantiles and on stochastic dominance. Both the previous methodologies produce ordinal rankings in an effective way. They can be compared with approaches usually employed in University evaluation systems, based on quantitative scorings. Our results show that our ordinal scores are appropriate for comparison and communication purposes. Through the application of such indexes to real data we have obtained a complete ranking of the courses of a pilot Faculty of a medium size Italian University. Future research involves deeper understanding of the mathematical properties of the proposed indexes, especially with reference to extreme values. Another relevant aspect may be the application of what proposed to data concerning reputation as described in [11] in the context of media reputation of corporate companies.
6. Acknowledgements
The paper is the result of the close collaboration among the authors. However Paola Cerchiello has written the paper under the supervision of Paolo Giudici. The Authors thank Flavio Ferlini, chief information officer of the University of Pavia, for the data and; Emanuele Dequarti for useful suggestions and the technical support. The Authors acknowledge support from CNVSU project (2009-2010) of the Italian Minister of Research and UNI5NET4STUDENTS project (2010-2011) of the Italian Minister of Public Administration.
REFERENCES
- N. C. Liu, “The Story of the Academic Rankig of World Universities,” International Higher Education, Vol. 54, 2009, pp. 2-3.
- D. Jobbins, “Global Rankings: Thousands Respond to the Survey,” 2010. http://www.universityworldnews.com/article.php? story=20100617192654650
- M. Cruz, “Modelling, Measuring and Hedging Operational Risk,” John Wiley and Sons, Chichester, 2002.
- C. Alexander, “Regulation, Analysis and Management,” Financial Times, Prentice Hall, Upper Saddle River, 2003.
- J. King, “Operational Risk. Measurement and Modelling,” John Wiley and Sons, Chichester, 2001.
- E. C. Bonafede, P. Cerchiello and P. Giudici, “Statistical models for Business Continuity Management,” Journal of Operational Risk, Vol. 2, No. 4, 2007, pp. 79-96.
- P. Cerchiello, P. Dequarti, P. Giudici and C. Magni, “Scorecard Models to Evaluate Perceived Quality of Academic Teaching,” Statistica & Applicazioni, Vol. 2, 2010, pp.145-156.
- P. Giudici, “Governo dei Rischi: Il Ruolo dei Modelli Statistici,” Isituto Lombardo (Rendiconti), Vol. 141, 2007, pp. 361-376.
- P. Cerchiello and P. Giudici, “Fuzzy Methods for Variable Selection in Operational Risk Management,” Journal of Operational Risk, Vol. 7, No. 4, 2012, pp. 1-17.
- P. Cerchiello and P. Giudici, “On the Distribution of Functionals of Discrete Ordinal Variables,” Statistics and Probability Letters, Vol. 82, No. 11, 2012, pp. 2044- 2049.
- P. Cerchiello, “Statistical Models to Measure Corporate Reputation,” Journal of Applied Quantitative Methods, Vol. 6, No. 4, 2011, pp. 58-71.