Open Journal of Physical Chemistry
Vol. 2 No. 3 (2012) , Article ID: 22113 , 7 pages DOI:10.4236/ojpc.2012.23022
Temperature Dependent Phase Behavior of Pseudo-Ternary Thiourea X-100 Surfactant +1-Hexanol/Oil/Water Systems
1School of Environmental Sciences, University of East Anglia, Norwich, Norfolk, UK
2Department of Chemical Sciences, University Malaysia Terengganu, Kuala Terengganu, Terengganu, Malaysia
Email: zulhelmi@umt.edu.my
Received May 28, 2012; revised June 25, 2012; accepted July 29, 2012
Keywords: Surfactant; Amphiphile; Co-Surfactant; Microemulsion; Micelles; Reverse Micelles; Phase Behavior; Phase Diagram; Thiourea X-100; 1-Hexanol
ABSTRACT
Temperature dependent phase behavior of Pseudo-ternary Thiourea X-100 +1-hexanol (1:5 molar ratios)/oil/water systems is reported. The influence of nature of hydrocarbon oil and type of electrolytes (weak as well as strong) has been investigated on the temperature induced phase behavior of the ternary system. At surfactant concentration, Φs = 40%, a “nose shaped” microemulsion region is observed. Below one-phase microemulsion region, Lα phase appears. The presence of NaCl decreases the domain size of 1Φ micellar region whereas oxalic acid first decreases the domain below Φw < 18 and then increases above Φw > 18 in the lower boundry of the phase diagram. The critical weight fraction of water, Φwcri decreases in presence of both electrolytes. However, Φwmax increases in presence of oxalic acid and remains constant in presence of NaCl as compared to salt free system. Furthermore, when cyclohexane was replaced by a longer straight chain hydrocarbon, dodecane, the domain of the one-phase microemulsion region is tremendously increased.
1. Introduction
Microemulsions (MEs) are optically transparent, thermodynamically stable, nano-structured mixture of oil and water stabilized by surfactant and co-surfactant [1]. Microemulsions have attracted great interest because of their unique physiochemical characteristics such as large stabilization capacity, ultra low interfacial tension, a very large interfacial region, and because of their potential industrial applications such as enhanced oil recovery, biotechnology, nanotechnology, novel drug delivery, agriculture, beverages and chemical reaction [2].
Phase behavior and structural organization of microemulsions are known to play key roles in its industrial and technological applications. Phase behavior studies provide information on the phase boundaries of different phases as a function of composition and temperature and more important structural organization of surfactant aggregates can also be interred [3]. In addition, it allows comparison of efficiency of different surfactant for a given application. The boundaries of one-phase micellar region can be easily accessed by visual observation of the sample of known composition. However, long equilibration is required in multiphase regions especially if a liquid crystalline phase is involved and this makes phase determination tedious, time consuming, and difficult [1,2,4].
The phase behavior and structural organization of surfactant aggregates are highly dependent on the elastic properties of surfactant monolayer separating oil and water domain [5]. The natural curvature of the surfactant monolayer depends upon the geometric properties of the hydrophilic and hydrophobic moiety of the surfactant molecules [4]. These properties in turn, depend on the temperature, pressure, ionic strength of water, and nature of oil etc. For a given surfactant, a change in the natural curvature from water (positive) to oil (negative) or viseversa can be achieved by changing one or more formulation variables. The most pronounced effect is temperature for nonionic surfactant and salts for ionic surfactant [5,6].
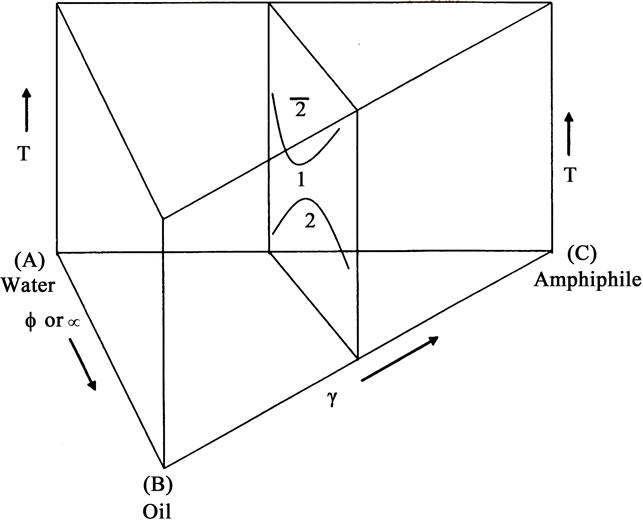
These phase behavior of a ternary system is often studied as a function of temperature and composition and the position of different phases are determined within the phase prism by erecting a vertical section of the prism at constant surfactant concentration. The phase boundaries give rise to characteristic “channel” shown in Figure 1(a), frequently reported by Rozaini and Brimblecombe [7]. For a ternary system water (A)-Oil(B)-surfactant(C), at constant pressure the ternary system is specified by setting three independent variables. The three most common variables ate temperature T, weight percentage, Φ or volume fraction, α of the oil, either of which is given by B/(A + B) in the mixture of oil and water, and the weight fraction of the surfactant in the mixture, γ = C/(A+B+C). Each point in the three-dimensional phase space of temperature and composition is then defined by giving variables T, Φ or α and γ. It is easiest to discuss phase behavior if it is expressed in an upright triangle A-B-C as the base (Figure 1(a)), but now temperature is the field variable. This is done by mixing a known amount of surfactant in oil and making surfactant concentration constant and water is added gradually to increase α or Φ value from 0% to 100%. Several samples having γ constant are made. For each sample, temperature is raised and the phase sequence 2-1-2 is observed with increase in temperature. Plotting the result yields the phase diagram shown in Figure 1(a) and also shown in Figure 1(b) in the vertical section of the phase prism at constant γ. The shape of the phase diagram obtained, on such section looks like a “channel” The one-phase “channel” is sandwiched between two two-phase regions. The size and shape of the “channel” and the temperature at which it is located, provides key information about the system. At lower temperature, the nonionic amphiphile is better soluble in water than in oil, and o/w microemulsion is formed which equilibrates with excess oil phase (signified by 2). At higher temperature, the nonionic surfactant is more oil soluble than water, and w/o microemulsion is formed in equilibrium with excess aqueous phase (signified by 2). This is due to the fact that the solubilization of the nonionic amphiphile in water is driven by the formation of the hydrogen bonds [4]. These hydrogen bonds break with rising temperature, causing a better oil solubility of the amphiphile. Alternatively, nonionic surfactant becomes hydrophobic with rise in temperature due to conformational changes in the polyoxyethylene chain of the nonionic surfactant. As a result, solubility of the surfactant increases in hydrocarbon oil with rise in temperature [4,5].
Furthermore, nonionic microemulsions are of increasing importance in several industrial applications. They are highly used in liquid detergent formulations [6]. Nonionic surfactants are more biodegradable than their ionic counterparts and more suitable for applications in cosmetic, foods, and personal care products [9]. It is known that the control of phase state is very important in several applications [9] and this prompted to investigate the temperature dependent phase behavior of microemulsions of a well known nonionic surfactant, Thiourea which has been used for various chemical reaction [10]. In this context, in this paper temperature dependent phase behavior of pseudo-ternary Thiourea +1-Hexanol/oil/water systems is reported over a wide range of temperature and composition, The influence of nature of hydrocarbon oil and type of electrolytes (weak as well strong) were investigated on the temperature induced phase behavior of the ternary system. Crossed Polaroid microscope was used to distinguish between one-phase isotropic micellar region and anisotropic liquid crystalline or turbid phase.
 (a)
(a)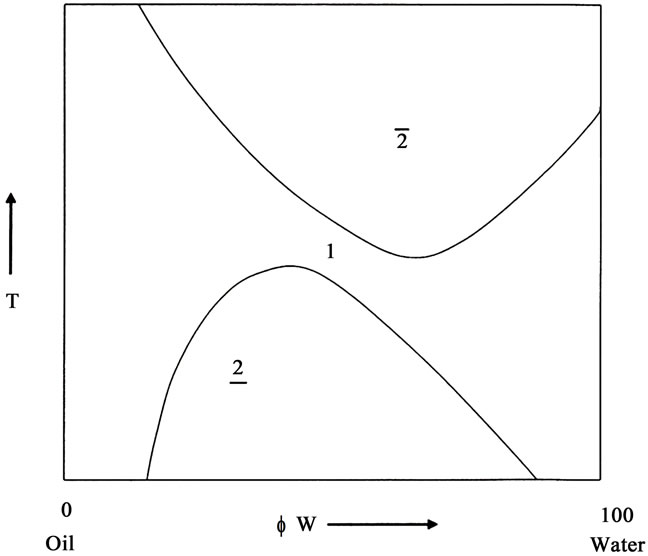 (b)
(b)
Figure 1. (a) Schematic “channel-shaped” phase prism of a ternary mixture of oil/water/nonionic surfactant in temperature-composition space at constant concentration, γ showing a single phase (1ф), two phase region; (b) Schematic “channel-shaped” phase diagram of a ternary mixture of oil/water/nonionic surfactant at vertical section of the phase prism at constant surfactant concentration, γ. The single phase (1ф) is surrounded by two two-phase region in which nonionic surfactant is dissolved either aqueous bottom phase (2) or organic top phase (2). For detail please see text.
2. Experimental
2.1. Materials
The nonionic surfactant, Thiourea X-100 (N-heksiloksifenil-N-(4-nitrobenzoil) thiourea) was obtained from Sigma Aldrich, Malaysia. Anhydrous dodecane and 1- hexanol were procured from Schuchardt, Germany. Sodium chloride (AR) was purchased from Fisher Scientific, Singapore. Oxalic acid (AR) was purchased from Sigma Aldrich Malaysia. Double distilled water was used throughout the experiment.
2.2. Methods
Constructing a Pseudo-Ternary Phase Diagram
Phase diagram of Thiourea X-100 +1-hexanol (1:5 molar ratio)/oil/water or aqueous electrolyte systems were constructed by titration method and the phase boundaries of one-phase micellar region of the ternary systems were determined at fixed surfactant concentration, γ = 40%. A known amount of surfactant + co-surfactant and oil is taken and subsequently the mixture was titrated with water or aqueous electrolyte solution with the help of Hamilton microsyringe. The final mixture was gently stirred and then immersed in a temperature controlled water bath to equilibrate different phases at desired temperature. Characterization of the resulting isotropic onephase micellar region or anisotropic phases were done visually and through crossed polaroid microscope after allowing sufficient time (typically 4 - 6 hours) for attainment of equilibrium at a particular temperature. The entire phase diagram was mapped in this manner. The detailed procedure for the determination of the phase diagram has been described elsewhere
3. Results and Discussions
One of the most common and convenient method 24 to study the phase behavior and related properties of a ternary system, surfactant/oil/water is to characterize the system at the vertical section of the prism at fixed amphiphile concentration. In this respect, phase behavior of pseudo-ternary Thiourea X-100 +1-hexanol (1:5 molar ratio)/cyclohexane/water system was determined as a function of temperature, T and weight fraction of water, Φw and shown in Figure 2. The weight fraction of surfactant, γ was kept constant and equal to 40%. It is evident from the figure that the domain of one-phase ME displays a “nosed-shaped” region. Similar “nose-shaped” micellar region were observed by Jeongt and co-workers [10], and Rozaini and Brimblecombe [11] for nonionic surfactant-oil-water ternary systems.
It is evident from the Figure 2 that at Φw < 5, the temperature window for one-phase micellar region is from below 0˚C to above 60˚C. At Φw > 5, the upper boundary of micellar phase decreases with increase in water content. At Φw ≈ 0 - 15, Lα phase or two-phase region (2) does not exit even below 0˚C. At Φw > 15, Lα starts to appear in the lower portion of the phase diagram, and therefore, the weight fraction of water (Φw ≈ 0 - 15) may be defined as the critical weight fraction of water, Φwcri where phase transition occurs from 1Φ micellar region to Lα phase. At Φw ≥ 15, with rise in temperature, transition from Lα to one-phase ME region takes place and the transition is very sharp (0.1˚C) without formation of two-phase system. With further increase in temperature, one-phase ME region changes into two-phase region. Below one-phase micellar region, the domain of Lα increases with increase in weight fraction of water and then finally changes into two-phase region (2). The exact boundary of the Lα phase was not determined in this set of experiments. One-phase micellar region is present up to Φw ≈ 25 and this may be defined as Φmax beyond which one-phase ME does not appear at any temperature and composition and only two-phase region was observed. The one-phase micellar region does not touch water axis. It means that Φs ≈ 40%, Thiourea-hexanol is unable to form normal micelle at any temperature in between 0˚C - 60˚C and also does not form oil swollen micelles (o/w microemulsions) near water axis. Otherwise one-phase micellar region must be extended up to water axis and one could expect a broad spectrum of micellar region in place of two-phase region beyond Φw > 25 in the ternary phase diagram. Further, at Φw ≈ 0 - 5, the upper boundary of ME region is above 60˚C. With increase in weight fraction of water (Φw), the upper boundry of temperature window of ME region decreases. As a result, a narrower temperature span of the ME region is observed and the domain of ME looks like “nosedshaped”.
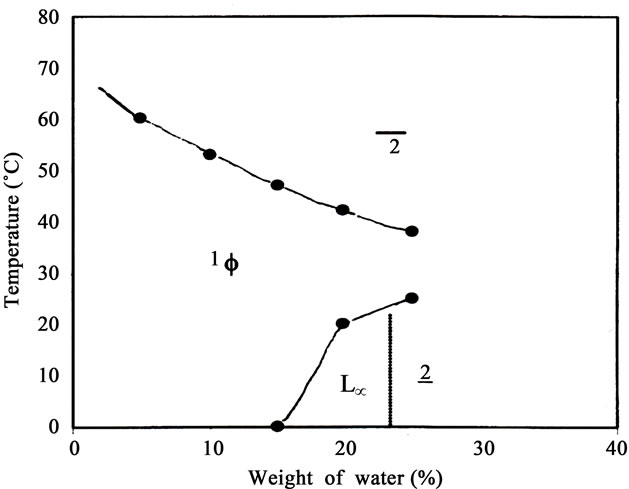
Figure 2. Temperature dependent Phase Diagram of Thiourea X-100 +1-hexanol/cyclohexane/water at surfactant concentration (γ = 40%) showing a single phase microemulsion region and Lα phase
Furthermore, it is known that the temperature dependent phase behavior of nonionic surfactant-oil-water system arises in the first place from the variation of local concentration of water in the ethylene glycol layer, which modulates the surfactant film curvature. 45 But it also originates from the solubility variation of the surfactant monolayer in the organic phase occurring as a function of temperature [12,13]. The phase diagram for the system, Thiourea X-100 +1-hexanol/cyclohexane/water plotted in Figure 2 corresponds to the oil rich region of the prism diagram. The shape and size of the ME domain in Figure 2 gives the key information about the ternary system. At Φw < 5, in the lower boundary, the one-phase micellar region is hydrated reversed micelles. 31 At Φw ≥ 15, Thiourea +1-hexanol forms lamellar structure resulting into Lα phase. With increase in temperature Lα phase turns into one-phase ME. With further increase in temperature, one-phase micellar system changes into twophase region (2) in which water swollen reverse micelles equilibrates with excess aqueous phase.
Okochi and Brimblecombe (2009) had studied temperature dependent phase behavior of C12E4/dodecane/ water and observed similar “nose-shaped” micellar region. However, critical weight fraction of water, Φwcri and maximum weight fraction of water, Φ wmax was 10 and 56 respectively [14,15]. Lα phase was also observed below one-phase microemulsion region in the lower boundary of the phase diagram. In the present studies, Φwcri is equal to ≈15, and Φwmax is equal to ≈25. By comparing this results, it is evident that the temperature dependent phase behavior of nonionic surfactant/oil/water is highly dependent on the amphiphilicity (hydrocarbon chain length) of the surfactant. If the amphiphilicity is decreased, one-phase ME region shrinks. That is what observed in the present investigations.
3.1. Influence of Electrolytes
The influence of 0.1 M NaCl and 0.3 M oxalic acid on the temperature induced phase behavior of the system, Thiourea X-100 +1-hexanol/cyclohexane/water was investigated and shown in Figure 3. In presence of both electrolytes, domain of 1Φ micellar phase display “noseshaped” regions similar to the salt free system. However, the presence of electrolytes changes the phase boundaries of the one-phase micellar region. It is evident from the Figure 3 that the critical weight fraction of water, Φwcri decreases in presence of both electrolytes, strong as well as weak. The critical weight fraction of water, Φwcri is equal to 10 in presence of both electrolytes whereas it is 15 for salt free system. However, Φwmax, increases in presence of oxalic acid and there is no change in Φwmax in presence of NaCl as compared to salt free system. At Φw ≈ 5, the temperature window for one-phase micellar region is from below 0˚C - 54˚C in presence of oxalic acid, from below 0˚C - 50˚C in presence of NaCl and from below 0˚C - 60˚C for salt free system.
That is, the presence of electrolytes contracts the temperature window of one-phase micellar region but the contraction is more in presence of strong electrolyte (NaCl) than the weak one (oxalic acid). In the lower boundary, at Φw > 10, the presence of NaCl and oxalic acid have opposite effect on the domain size of the micellar region. In the lower boundary, strong electrolyte, NaCl always decreases domain of the 1Φ microemulsion region whereas oxalic acid first decreases the domain of 1Φ micellar region below Φw < 18 and then increases the same above Φw > 18. In the upper boundary, the presence of oxalic acid expands temperature window of 1Φ micellar region above Φw >14 and the presence of NaCl increases the same at Φw > 19. Thus the presence of weak electrolyte, oxalic acid expands 1Φ micellar region more as compared to NaCl in the upper region of the phase diagram. As a result, a bigger domain 1Φ ME region is observed at higher water content.
The changes in the phase boundaries of one-phase micellar region (Figure 3) arises due to the presence of electrolytes in the aqueous domain of the ternary system. It is known that the phase behavior of a ternary system is highly influenced by the presence of electrolytes [16-18]. The presence of electrolytes reduces the solubility of the hydrophilic head group of the ionic surfactant amphiphile in water. In case of nonionic amphiphiles they compete for the hydrating water of the head groups. The presence of electrolytes (NaCl or oxalic acid) may decrease electrostatic interactions between the polar head groups of
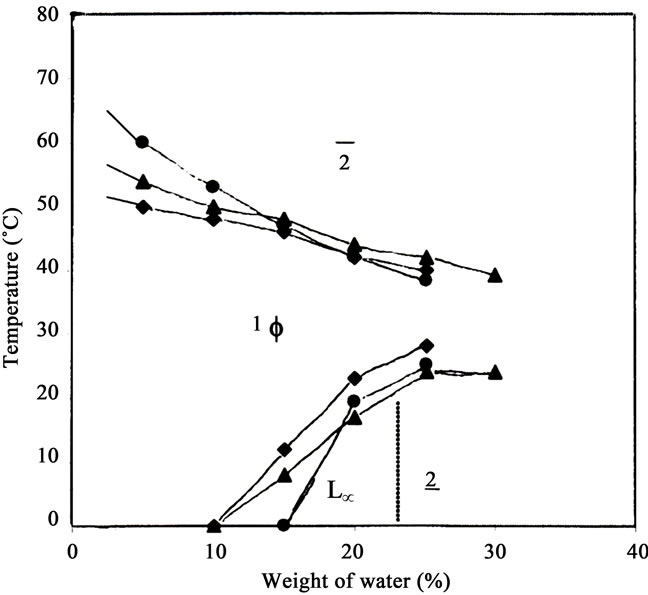
Figure 3. Temperature dependent Phase Diagram of Thiourea X-100 +1-hexanol/cyclohexane/ water at surfactant concentration (γ = 40%) in presence of 0.1 M NaCl (black diamond), 0.3 M oxalic acid (black triangle) and electrolyte free (black circle).
the surfactant and thereby coming closure to each other. This would lead more rigid interface, smaller inter-micellar interaction, decrease in size of the core of reverse micelles (RMs) and thus less amount of water is solubilized inside the core RMs in presence of electrolytes and this results in apparent decrease in Φwcrit from 15 (salt free syatem) to 10 (in presence of electrolytes). Further, it can be seen from the Figure 3 that at Φw ≈ 5, 1Φ micellar region has upper critical temperature ~50˚C in presence of 0.1 M NaCl, ~54˚C in presence of 0.3 M oxalic acid and ~60˚C for salt free system. That is, the presence ofelectrolytes decreases the upper critical transition temperature, Tuppercri and the decrease in Tuppercri is much more in presence of NaCl than oxalic acid. It is known 30 that on the oil-rich side, w/o MEs are present at low water content near upper critical temperature (near upper boundary of the phase diagram), which coagulate with decreasing temperature.
The presence of electrolyte decreases the size of RMs of Thiourea at any temperature 49 due to ion-dipole interaction or complexation between cations and polyoxyethylene chain of TX-100 that results in a closure packing of polar head groups of TX-100 and decreases the extent of solubilization of aqueous electrolyte solution inside the core of RMs. As a result, one-phase micellar region changes into two-phase region in presence of electrolytes relatively at a lower temperature as compared to salt free system. This causes an apparent decrease in upper critical temperature, Tuppercri in presence of electrolyte and the decrease in more in the presence of strong electrolyte (NaCl) than the weak one (oxalic acid). This may be due to a greater extent of iondipole interaction or complexation between the cations and polyoxyethylene chain of TX-100 in presence of the strong electrolyte (NaCl) as compared to the weak electrolyte (oxalic acid). As a result, the upper critical transition temperature, Tuppercri decreases much more in presence of strong electrolyte (NaCl) than the weak one (oxalic acid) and phase transition from one-phase micellar region to two-phase region occurs at relatively lower temperature (~50˚C) in presence of NaCl than oxalic acid (~54˚C). As a result, temperature window of one-phase micellar region becomes narrower in presence of both electrolytes as compared to salt free system.
Furthermore, it is known that the type of ME depends upon water-to-oil ratio and if Φw ≈ 25 - 70 wt%, a sponge like structure 31 is obtained which is known as bicontinuous ME in which surfactant monolayer separates into disordered, interpenetrating domains of oil and water. The size of the domains of water and oil in a bicontinuous ME is highly dependent on amphiphile concentration and water-to-oil ratio. 50 In the middle of phase diagram, at Φw > 18, the presence of electrolytes expands the temperature window of 1Φ micellar region in the upper region of the phase diagram. This may be due to the fact that the presence of electrolytes (weak or strong) makes the surfactant (TX-100) more hydrophobic. 45 That causes a better oil solubility of TX-100 in oil domain and therefore phase transition from 1Φ ME region to two-phase region takes place relatively at a higher temperature and higher water content as compared to salt free system. As a result, temperature window for one-phase micellar and Φmax increase in presence of both electrolytes. Further, at Φw > 18, the presence of oxalic acid expands the temperature window of 1Φ ME region more than NaCl and this may be due the fact that oxalic acid probably increases hydrophobicity of the TX-100 more than NaCl due to higher concentration of oxalic acid. This results an increase in the temperature window of one-phase micellar region in the middle of phase diagram.
3.2. Influence of Hydrocarbon Chain Length of Oil
The influence of the hydrocarbon chain length of oil on the temperature induced phase behavior of the ternary system. Thiourea X-100+1-hexanol (1:5 molar ratio)/ oil/0.1 M NaCl was investigated. Cyclohexane was replaced by a longer straight chain hydrocarbon, dodecane and domain of one-phase micellar region of Triton X- 100+1-hexanol/dodecane/0.1 M NaCl was determined and shown in Figure 4. It is clear from the Figure that the general features of one-phase micellar regions are similar in presence of both oils, i.e. dodecane and cyclohexane. The critical weight fraction of water, Φwcri is 10 in presence of cyclohexane and 15 in presence of dodecane. Also, there is a tremendous increase in Φwmax
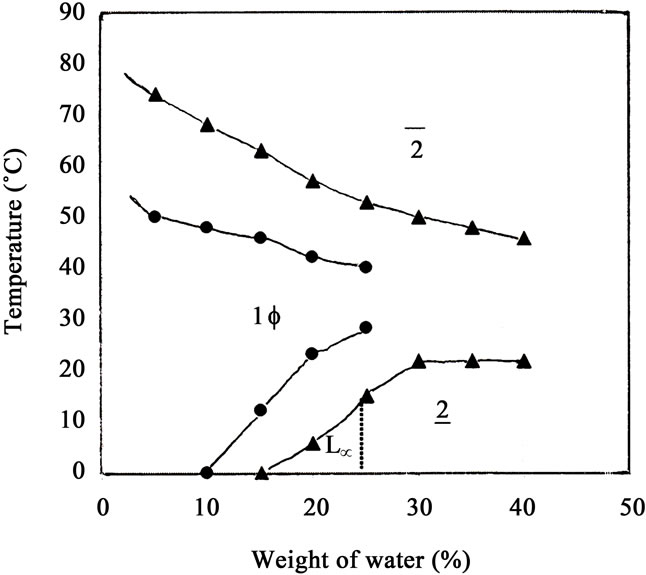
Figure 4. Temperature dependant phase diagram of Thiourea X surfactant+1-hexanol/oil/0.1 M NaCl at constant surfactant concentration (γ = 40%) in presence of cyclohexane (black circle) and dodecane (black triangle).
in presence of dodecane as compared to cyclohexane and is equal to 40% whereas it is 25% in presence of cyclohexane. At Φw = 5, the upper critical temperature, Tuppercri is increased and is equal to 70˚C in presence of dodecane. Thus the temperature window of one-phase micellar is very much larger in presence pf dodecane as compared to cyclohexane. In the lower boundary of the phase diagram, three is tremendous increase in domain of one-phase micellar in presence of dodecane. It is quite interesting to note that the one-phase micellar region does not touch the water axis in presence of dodecane also. It means TX-100 +1-hexanol is unable to form normal micelles or oil swollen ME near water axis in presence of oil, dodecane or cyclohexane.
The changes in phase boundary in one-phase micellar region occurs due to different nature of the oils used here in the presence studies. The presence of longer straight chain hydrocarbon, dodecane tremendously increases the domain of 1Φ micellar region as compared to cyclohexane. The critical weight fraction of water Φw cri and Φwmax are larger in presence of dodecane as compared to cyclohexane. Also Tuppercri has been inceased in presence of dodecane. As a result, the temperature window of one-phase micellar region increases. Thus the solubilization efficiency of the amphiphile, TX-100 is much more in presence of dodecane than cyclohexane and this may be attributed to higher hydrophobicity (longer hydrocarbon chain length) of dodecane. It is known that with rise in temperature, the nonionic amphiphile TX-100 becomes hydrophobic [18-20]. As a result, its solubility increases in more hydrophobic oil, dodecane than cyclohexane. Thus phase transition from one-phase micellar region to two-phase region takes place relatively at higher temperature. This causes an apparent increase in Tuppercri in presence of dodecane as compared to cyclohexane. As a result, the temperature window of one-phase micellar region becomes larger in presence of dodecane as compared to cyclohexane.
4. Conclusion
The temperature dependent phase behavior of Thiourea X-100+1-pentanol (1:5 molar ratio)/cyclohexane or dodecane/water or brine systems were investigated. At surfactant concentration, γs = 40%, a “nose-shaped” microemulsion region is observed. Below one-phase micellar region liquid crystalline, Lα appears. The one-phase micellar region does not touch water axis. At Φw ≈ 5, the temperature window for one-phase micellar region is from below 0˚C - 50˚C in presence of NaCl, below 0˚C - 54˚C in presence of oxalic acid, and form below 0˚C - 60˚C for salt free system in presence of cyclohexane. That is, the presence of electrolytes contracts the domain of Φw micellar region but the contraction is more in presence of strong electrolyte (NaCl) than the weak one (oxalic acid). The presence of NaCl and oxalic acid has opposite effect on the one-phase micellar region. In the lower boundary of the phase diagram, presence of strong electrolyte, NaCl always decreases the domain of 1Φ micellar region whereas oxalic acid first decreases the domain Φw < 18 and then increases the temperature above Φw > 18. The critical weight fraction of water, Φwcri decreases in presence of both electrolytes. Further, when cyclohexane is replaced by dodecane, the temperature window of 1Φ ME region is tremendously increased.
5. Acknowledgements
The author thankfully acknowledges the financial support from Malaysian Ministry of Higher Education [MOHE] with Project No. FRGS59165.
REFERENCES
- R. Belcher and L. Gordon, “Kinetics of Precipitation,” Pergamon Press, Oxford, 1964.
- A. Bonazza, P. Brimblecombe, C. M. Grossi and C. Sabbioni, “Carbon in Black Crusts from the Tower of London,” Environmental Science & Technology, Vol. 41, No. 12, 2007, pp. 4199-4204. doi:10.1021/es062417w
- X. Liu, H. C. Monger and W. G. Whitford, “Calcium Carbonate in Termite Galleries-Biomineralization or Upward Transport,” Biogeochemistry, Vol. 82, No. 3, 2007, pp. 241-250. doi:10.1007/s10533-006-9067-x
- L. Brecevic and D. Skrtic, “Transformation of Calcium Oxalate Hydrates,” Journal of Crystal Growth, Vol. 74, 1986, pp. 399-408. doi:10.1016/0022-0248(86)90131-4
- H. H. M. Darweesh, “Building Materials from Siliceous Clay and Low Grade Dolomite Rocks,” Ceramics International, Vol. 27, No. 1, 2001, pp. 45-50. doi:10.1016/S0272-8842(00)00040-7
- B. L. Davis and G. Jixiang, “Airborne Particulate Study in Five Cities of China,” Atmospheric Environment, Vol. 34, No. 17, 2000, pp. 2703-2711. doi:10.1016/S1352-2310(99)00528-2
- M. Z. H. Rozaini and P. Brimblecombe, “The Solubility of Sodium Dicarboxylate in the Atmospheric Aerosols,” Journal of Chemical Thermodynamic, Vol. 41, 2009, pp. 980-983. doi:10.1016/j.jct.2009.03.017
- B. Ford, I. Macleod and P. Haydock, “Rock Art Pigments from the Kimberly Region of Western Australia: Identification of the Minerals and Conversion Mechanisms,” Studies in Conservation, Vol. 39, 1994, pp. 57-69. doi:10.2307/1506491
- J. H. Huang, Z. F. Mao and M. F. Luo, “Effect of Anionic Surfactant on Vaterite CaCO3,” Materials Research Bulletin, Vol. 42, No. 12, 2007, pp. 2184-2191. doi:10.1016/j.materresbull.2007.01.005
- T. S. Jeong, J. H. Kim, M. S. Han, K. Y. Lim and C. J. Youn, “X-Ray and Cathodoluminescence Study on the Effect of Intentional Long Time of Succinic Acid on Calcium Carbonate,” Journal of Crystal Growth, Vol. 280, No. 3-4, 2005, pp. 357-363. doi:10.1016/j.jcrysgro.2005.04.002
- M. Z. H. Rozaini and P. Brimblecombe, “The Odd-Even Behaviour of Dicarboxylic Acids Solubility in the Atmospheric Aerosols,” Water, Air & Soil Pollution (Springer), Vol. 198, 2009, pp. 65-75. doi:10.1007/s11270-008-9826-5
- S. Mann, J. M. Didymus, N. P. Sanderson and E. J. A. Samper, “Effects of Grazing and Topography on Dust Flux,” Journal of the Chemical Society, Faraday Transactions, Vol. 86, 1990, pp. 1873-1880. doi:10.1039/ft9908601873
- M. G. S. Matteini, “The Protective Effect of Ammonium Oxalate Treatment on the Surface of Wall Paintings,” Painted Facades Eurocare Project, Vienna, 1996, pp. 95-101.
- H. Okochi and P. Brimblecombe, “Potential Trace MetalOrganic Complexation in the Atmosphere,” Scientific World, Vol. 2, 2002, pp. 767-786. doi:10.1100/tsw.2002.132
- C. Sabbioni, “Contribution of the Atmospheric Deposition to the Formation of Damage Layers,” Science of the Total Environment: The Deterioration of Monuments, Vol. 167, No. 1-3, 1995, pp. 49-55. doi:10.1016/0048-9697(95)04568-L
- C. Sabbioni and G. Zappia, “Atmospheric-Derived Element Tracers on Damaged Stone,” The Science of the Total Environment, Vol. 126, No. 1-2, 1992, pp. 35-48. doi:10.1016/0048-9697(92)90482-8
- S. Signorelli, C. Peroni, M. Camaiti and F. Fratini, “The Presence of Vaterite in Bonding Mortars of Marble Inlays from Florence Cathedral,” Mineralogical Magazine, Vol. 60, No. 4, 1996, pp. 663-665. doi:10.1180/minmag.1996.060.401.13
- O. Söhnel and J. W. Mullin, “Long-Term and Thermally Stable Superhydrophobic Surfaces of Carbon Nanofibers,” Journal of Colloid Interface Science, Vol. 123, 1988, pp. 43-51.
- H. Wei, Q. Shen, Y. Zhao, D.-J. Wang and D.-F. Xu, “Influence of Polyvinylpyrrolidone on the Precipitation of Calcium Carbonate and on the Transformation of Vaterite to Calcite,” Journal of Crystal Growth, Vol. 250, No. 3-4, 2003, pp. 516-524. doi:10.1016/S0022-0248(02)02484-3
- A.-W. Xu, M. Antonietti, H. Colfen and Y.-P. Fang, “Uniform Hexagonal Plates of Vaterite CaCO3 Mesocrystals Formed by Biomimetic Mineralization,” Advanced Functional Materials, Vol. 16, No. 7, 2006, pp. 903-908. doi:10.1002/adfm.200500716