Open Journal of Geology
Vol.06 No.01(2016), Article ID:63136,8 pages
10.4236/ojg.2016.61005
Source Characteristics of the 2012 Ahar-Varzaghan Earthquake
Maryam Aminipanah*, Manouchehr Ghorashi, Mohsen Pourkermani, Abdolmajid Asadi, Katayoun Behzadafshar
Department of Geology, Fars Science and Research Branch, Islamic Azad University, Shiraz, Iran

Copyright © 2016 by authors and Scientific Research Publishing Inc.
This work is licensed under the Creative Commons Attribution International License (CC BY).
http://creativecommons.org/licenses/by/4.0/


Received 28 November 2015; accepted 25 January 2016; published 28 January 2016
ABSTRACT
The August 11, 2012 Mw 6.4 earthquakes in northwestern Iran occurred as a result of oblique strike-slip faulting in the shallow crust of the Eurasia plate, approximately 300 kilometer east of the plate boundary between the Eurasia and Arabia plates. The seismotectonics of this region is controlled by the collision of the Arabia and Eurasia plates; at the latitude of the earthquakes, the Arabia plate moves almost due north with respect to the Eurasia plate at a rate of approximately 26 millimeter per year. Over the past forty years, seven earthquakes of Mw 6 or greater have occurred within 300 kilometer of today’s events. The nearest was a Mw 6.1 earthquake in February of 1997, approximately 100 kilometer to the east, which caused 1100 fatalities. The studied area encourage the authors to determine the focal mechanism, source time function and sub events’ features which can guide us to reliable judges.
Keywords:
Ahar-Varzaghan Earthquake, Source Time Function, Source Mechanism, Source Parameters

1. Introduction
For most seismologists, large earthquakes are interesting not only because of the effects caused but also because of their size. From seismological point of view, some of earthquake parameters such as magnitude, source time function, focal mechanism and seismic moment are more important than the others.
Among of the mentioned parameter, source time function includes information regarding an earthquake’s rupture length and rupture velocity, characteristics that can be determined through rupture directivity analysis based on the finiteness source theory [1] [2] . Improved seismic data and computer facilities have made significant progress in computational techniques. Harvard CMT solutions and NEIC fast moment tensors [3] [4] and repeatable procedures to determine earthquake source parameters such as Boxer [5] are examples of these new procedures. However, pulse width of the source time function at each station needs to be taken as a particular constant in the moment tensor inversion method to solve for the optimal fault plane solution of an earthquake.
Several researchers have been investigated of dependency in source time function, focal mechanism and rupture directivity [6] - [9] classical body-wave (P and/or SH) point-source.
Approaches [10] - [12] , impose that the source time function is the same at all stations. This assumption is reasonable for moderate earthquakes, at least if high frequency waves are discarded, but becomes increasingly invalid as the magnitude and source dimension increase; extended source effects cause the STFs to be dependent on the recording station [13] .
The iterative approach [14] and slip patch method [15] for source complexity in the definition of the focal mechanism are available respectively. The present study aims to focus on determination of source time function and focal mechanism of Ahar-Varzaghan earthquake (11 August 2012, at 12:23:18 (UTC), Mw = 6.5) in North- West Iran.
Using the onset times of 599 stations, the epicenter of mainshock was computed as 38.32N-46.82E by ISC. The magnitude of the mainshock, given by ISC, was Mw = 6.5, and focal depth determination indicated a focal depth of 12 kilometers. The shock was felt in many parts of northwestern Iran, including Ahar, Varzaghan Maragheh, Marand and Meshgin Shahr. The mainshock was followed by many aftershocks. The Ahar-Varzaghan earthquake is the one of the rare earthquakes with magnitude greater than 6 in Tabriz. According to the Geological Survey of Iran at least 306 people killed, 3000 injured, 4 villages destroyed and 60 heavily damaged in the epicentral area. Some buildings damaged at Tabriz. Power outages occurred and communications were disrupted. The instrumentally located earthquakes and the mechanism of strong earthquakes are also given in Figure 1. This paper uses the result of field reports and analyzes the source complexity of mainshock by the inversion of far-field data collected by the data management center of the incorporated research institutions for seismology.
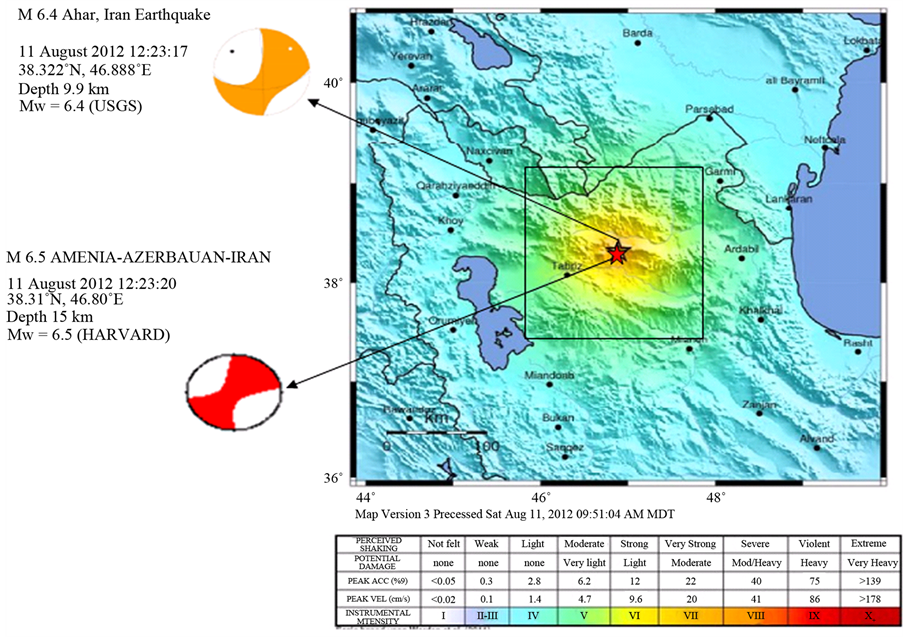
Figure 1. The epicenter of main shock and instumentally located earthquakes as well as mechanism of strong earth- quakes given by USGS and HRV.
The main goal of this study is to obtain how far the rupture propagation was related to the strong ground motion distribution.
2. Background Seismicity and Activating Fault System
Historical seismicity of Iran has been studied by [16] . This study suggests that the region has experienced many destructive earthquakes in historical time. Most of the destructive earthquakes have occurred either in the North Tabriz fault with NW-SE trend. The epicenter of these events across a range macroseismic with a focus on earthquake-prone rural population (Figure 2) is located [16] , and, therefore, more than 150 villages were damaged from 20 to 100 percent. Figure 3 Map focal mechanisms in North West Iran Harvard CMT recorded by the site can be seen that most of the reverse and strike-slip faulting in this area. Based on studies performed by [17] Main earthquakes in northwest Iran, a small focal depth (15 - 8 km) show overall plateau deformation of Azerbaijan by the Arabian plate is moving North. A recent study, based on global positioning system [18] , indicates that northwest Iran is a convergent strike-slip deformation. Due to the earthquake in 2012 Ahar Varzeghan seems essential characteristics of the earthquake source. In this study, using modeling waveform parameters such as earthquake source, seismic moment, moment magnitude, and earthquake mechanism are examined.
3. Source Parameters of Mainshock
Using the inversion technique developed by Kikuchi the body waves of Ahar-varzaghan earthquake recorded by GDSN stations were inverted to their sources to investigate the source mechanism. The P waveforms of 30 stations with epicentral distances between 30 and 100 degrees were used for this study [19] . The locations of selected seismic stations are given in Table 1. The records with duration of 60 seconds were inverted with a sampling interval of 1.0 second. Both the observed and synthetic Green’s functions for all the stations were equalized to GDSN seismograms with the same gain [20] . In calculating the synthetic wavelet for a point dislocation we used the Jeffreys-Bullen A model [21] . First, a source time function of trapezoid shape having rise time of 3 seconds and process time of 20 seconds was best fitted. Then, with the fixed source time function, the data was inverted for several source depths. The residual error was minimized for the depth of 5 - 15 kilometers. This

Figure 2. Seismicity map of the North West of Iran.

Figure 3. The mechanism of earthquakes Mw < 5.5 northwestern Iran, from Harvard CMT.

Table 1. The seismic station code, azimuth, backazimuth,and epicentral distance of stations used in this study.
suggested that the centroid depth was not deeper than 15 km. In next stage, by a point source approximation, we obtained the mechanism solution. The source time function, focal mechanism, and the comparison of the observed and synthetic seismograms after the first iteration is given in Figure 4. This figure indicates that the fit of observed and synthetic waveforms is acceptable around the 20 seconds. The iteration was repeated two times; no significant decrease in the residual error was found after two iterations. This suggested that there were two main fault slip during the source process of the mainshock. The final result of inversion is summarized in Table 2. Examples of the observed and synthetic waveforms, the source time function, the focal mechanism and the ray directions of the stations used in this analysis are given in Figure 5.

Figure 4. The source time function, the focal mechanism, and the ray directions of the stations used in this analysis as well as the comparison of the observed (top) and synthetic (bottom) waveforms after the first iteration for the 2012 Ahar-Varzaghan earthquake. The correlation coefficient, the name, component and azimuth of station are given on the left side of each waveform.
Table 2. The source parameters of the subevents for the final solution of the Ahar-Varzaghan earthquake obtained by waveform inversion.

Figure 5. The comparison of the observed (top) and synthetic (bottom) waveforms for the final solutions of the 2012 Ahar-Varzaghan earthquake. The correlation coefficient, the name, component and azimuth of station are given on the left side of each waveform.
The largest slip took place during the first 10 seconds while the next slip initiated within 50 seconds. Out of two possible fault planes, the one striking NW-SE gave a much better variance reduction and was in agreement with the strike of geological faults in the region. The mechanism solution for the total source was obtained as striking N100W, dipping 75.4, and having rake angle 178. The fault slip was consistent with the geological evidences such as folding and strike-slip a small component reverse faulting in the region. The total seismic moment was calculated to be M. = 6.1 × 1025 dyne cm. The calculated maximum dislocation was about 92 cm and the obtained moment magnitude in this analysis was Mw = 6.4 while the estimated rupture velocity was 2.5 km/s. Using the relation Δσ = 2.5M0/(S)3/2 and approximating the rupture area, S, by L × (L/2), thus the average stress drop, Δσ, could be estimated [22] . In this study, following the same relation, the average stress drop, Δσ, was estimated to be about 170 bar. Using the relation M. = μDS, where μ = 3 × 10¹¹ dyne cm was the rigidity and S the fault area, the average dislocation, D, was calculated to be 46 cm.
4. Discussion
The result of 30 teleseismic waveform modeling in this study indicates that the source process of this earthquake follows mainly two subevents model and focal mechanism of the mainshock is mainly strike slip consistent with the geological and seismological observations. The second subevent has a small reverse component and is in agreement with the tectonics of the area.
The resulted focal mechanism with (strike, slip, rake) (100, 75, 177) presents strike-slip faulting with small reverse component which can clearly prove that this event is a consequence of Arabian plate with the Eurasian plate is convergence. Which causes displacement of the North West to the East, East-west trend indicator strain- partitioning that can be seen clearly in the North West of Iran. The source time function suggests that the main energy was released during the first 10 seconds, the total seismic moment was calculated to be ∑M = 6.1 × 1025 (dyne-cm), the obtained moment magnitude was Mw = 6.4. The calculated maximum dislocation was about 46 cm and stress drop was estimated to be 170 bar. According to the first wave arrival time p, source time function, the triangle is considered. Rupture during the mainshock initiated around the hypocenter and extended unilaterally to the East, Indicates move North West of Iran to the East.
5. Conclusion
Also, considering the importance of the North Tabriz fault in the majority of historical earthquakes along the fault occurred, to be sure, according to the results, genetic link between the fault earthquake Ahar-Varzeghan and fault north of Tabriz, thus the fault that has direction east-west in the region are of great importance.
Cite this paper
MaryamAminipanah,ManouchehrGhorashi,MohsenPourkermani,AbdolmajidAsadi,KatayounBehzadafshar, (2016) Source Characteristics of the 2012 Ahar-Varzaghan Earthquake. Open Journal of Geology,06,39-46. doi: 10.4236/ojg.2016.61005
References
- 1. Ben-Menahem, A. (1961) Relation of Seismic Surface-Waves from Finite Moving Sources. Bulletin of the Seismological Society of America, 51, 401-435.
- 2. Aki, K. and Richards, P.G. (2002) Quantitative Seismology. 2nd Edition, CA: Univ. Sci. Books, Sausalito, 700.
- 3. Dziewonski, A.M., Chou, T.A. and Woodhouse, J.H. (1981) Determination of Earthquake Source Parameters from Waveform Data for Studies of Global and Regional Seismicity. Journal of Geophysical Research, 86, 2825-2852. http://dx.doi.org/10.1029/JB086iB04p02825
- 4. Sipkin, S.A. (1994) Rapid Determination of Global Moment-Tensor Solutions. Geophysical Research Letters, 21, 1667-1670. http://dx.doi.org/10.1029/94GL01429
- 5. Gasperini, P., Bernardini, F., Valensise, G. and Boschi, E. (1999) Defining Seismogenic Sources from Historical Felt Reports. Bulletin Seismological Society America, 89, 94-110.
- 6. Kanamori, H. and Stewart, G. (1976) Mode of the Strain Release along the Gibbs Fracture Zone, Mid-Atlantic Ridge. Physics of the Earth and Planetary Interiors, 11, 312-332.
http://dx.doi.org/10.1016/0031-9201(76)90018-2 - 7. Chung, W.Y. and Kanamori, H. (1980) Variations of Seismic Source Parameters and Stress Drops within a Descending Slab and Its Implications in Plate Mechanics. Physics of the Earth and Planetary Interiors, 23, 134-159. http://dx.doi.org/10.1016/0031-9201(80)90008-4
- 8. Ruff, L. and Kanamori, H. (1983) The Rupture Process and Asperity Distribution of Three Great Earthquakes from Long-Period Diffracted P-Waves. Physics of the Earth and Planetary Interiors, 31, 202-230. http://dx.doi.org/10.1016/0031-9201(83)90099-7
- 9. Ammon, C.J., Velasco, A.A. and Lay, T. (1993) Rapid Estimation of Rupture Directivity: Application to the 1992 Landers (Ms = 7.4) and Cap Mendocino (Ms = 7.2) California Earthquakes. Geophysical Research Letters, 20, 97-100. http://dx.doi.org/10.1029/92GL03032
- 10. Nabelek, J.L. (1984) Determination of Earthquake Source Parameters from Inversion of Body Waves. Ph.D. Thesis, Massachusetts Institute of Tecnology, Cambridge.
- 11. Ruff, L.J. and Miller, A.D. (1994) Rupture Process of Large Earthquakes in the Northern Mexico Subduction Zone. Pure and Applied Geophysics, 142, 101-172. http://dx.doi.org/10.1007/BF00875970
- 12. Goldstein, P. and Dodge, D. (1999) Fast and Accurate Depth and Source Mechanism Estimation Using P-Waveform Modelling: A Tool for Special Event Analysis, Event Screening, and Regional Calibration. Geophysical Research Letters, 26, 2569-2572. http://dx.doi.org/10.1029/1999GL900579
- 13. Vallee, M., Charlety, J., Ferreira, A.M.G., Delouis, B. and Vergoz, J. (2011) SCARDEC: A New Technique for the Rapid Determination of Seismic Moment Magnitude, Focal Mechanism and Source Time Functions for Large Earthquakes Using Body-Wave Deconvolution. Geophysical Journal International, 184, 338-358. http://dx.doi.org/10.1111/j.1365-246X.2010.04836.x
- 14. Kikuchi, M. and Kanamori, H. (1991) Inversion of Complex Body Waves-III. Bulletin of the Seismological Society of America, 81, 2335-2350.
- 15. Vallee, M. and Bouchon, M. (2004) Imaging Coseismic Rupture in Far Field by Slip Patches. Geophysical Journal International, 156, 615-630. http://dx.doi.org/10.1111/j.1365-246X.2004.02158.x
- 16. Ambraseys, N.N. and Melville, C.P. (1982) A History of Persian Earthquakes. Cambridge University Press, Cambridge, 219 p.
- 17. Jakson, J. and Mckenzie, D. (1948) Active Tectonics of the Alpine-Himalayan Belt between Western Turkey and Pakistan. Geophysical Journal Royal Astronomical Society, 77, 185-264.
http://dx.doi.org/10.1111/j.1365-246X.1984.tb01931.x - 18. Vernant, P., et al. (2004) Contemporary Crustal Deformation and Plate Kinematics in Middle East Constrained by GPS Measurements in Iran and Northern Oman. Geophysical Journal International, 157, 381-398. http://dx.doi.org/10.1111/j.1365-246X.2004.02222.x
- 19. Lay, T. and Wallace, T.C. (1995) Modern Global Seismology. Academic Press, 521 p.
- 20. Gheitanchi, M.R. (2002) Source Parameters of the 1998 Fandoqa Earthquake in Kerman Province, South-East Iran. Earth & Space Science, 28, 1-6.
- 21. Jeffreys, H. and Bullen, K.E. (1958) Seismological Tables. Office of the British Association, Burlington House, London.
- 22. Aminipanah, M., Gheitanchi, M.R. and Ghorashi, M. (2008) Source Characteristics of the February 1997 Bojnourd, Northeast Iran, Earthquake Sequence. The 7th General Assembly of ASC, Tsukuba, 24-27 November 2008, B32-03.
NOTES

*Corresponding author.