Optics and Photonics Journal
Vol.4 No.6(2014), Article
ID:47449,11
pages
DOI:10.4236/opj.2014.46016
Opto-Mechanical Properties of PTFE Fibres Using Phase Shifting Interferometry
Khaled Yassien1,2*, Mohamed El Bakary3,4
1Department of Physics, Faculty of Science for Girls, King Khalid University, Abha, KSA
2Department of Physics, Aswan Faculty of Science, Aswan University, Aswan, Egypt
3Department of Engineering Sciences, Community College, Umm Al-Qura University, Mecca, KSA
4Department of Physics, Mansoura Faculty of Science, Mansoura University, Mansoura, Egypt
Email: *yassien1975@yahoo.com
Copyright © 2014 by authors and Scientific Research Publishing Inc.
This work is licensed under the Creative Commons Attribution International License (CC BY).
http://creativecommons.org/licenses/by/4.0/


Received 3 May 2014; revised 2 June 2014; accepted 23 June 2014
ABSTRACT
Polytetrafluoroethylene (PTFE) is one of a class of polymer that has many unique properties, which make it valuable in scores of applications. Here, the molecular alignment effect in fibre drawing and its relation with nonlinear optical properties of the PTFE fibres were studied by means of interferometry. For this propose, the phase shifting Mach-Zehnder interferometer was utilized. The fibre drawing device was attached to the interferometer for measuring the opto-mechanical properties of PTFE fibres. From the recorded interferomgrams the wrapped phase map and its contour line were determined using the phase shifting interferometry (PSI) method. From the contour lines the refractive index, refractive index profile, birefringence, polaryzability and orientation function of the investigated sample were determined at different draw ratios. The PSI method showed good results for enhancing the noisy fringe pattern and for obtaining contour line microinterferograms. This study offers the correlation between the mechanical properties and the structure properties of fibres. Thus, a better structure-property correlation can improve the technical and industry performance of the fibres.
Keywords:Phase Shifting Interferomerty, Mechanical Properties, Birefringence, PTFE Fibres

1. Introduction
The orientated polymer can be produced by hot stretching of a molten polymer followed by rapidly cooling of the melt, cold drawing and cold rolling [1] . In general, the drawing process gives rise to preferred orientation of the molecular chain axis and improves the textile characteristics of man-made fibres. The degree of orientation varies from one fibre to another depending on the fibre history during manufacture and subsequent processing operations [1] -[3] . The measurement of the orientation in polymers provides valuable information of the relationships between mechanical properties and the molecular orientation [1] .
It is well known that drawing of polymer materials could introduce significant birefringence. This birefringence may result from a number of effects such that stress, molecular alignment and so on. Under mechanical drawing, the fibres become thinner, stronger and consequently more birefringent. The correlation between the structural and physical properties of fibres can be detected by means of measuring their birefringence. A number of interferometric techniques such as two-beam and multiple-beam interference techniques have been used to determine the opto-mechanical properties of fibers [4] -[11] .
The main task of the interferometric techniques is the measurement of the refractive indices and birefringence. This task is based on recovering the phase information from the interferograms. To achieve high accuracy measurements, it is necessary to use computer evaluation of the interference fringes. Additionally, image processing can be used to enhance the fringe patterns and remove noise before the phase is evaluated [11] [12] . Another promising method used for analyzing the interferograms and extracting the interference phase of the fringe pattern by recording additional information [13] is referred as the phase shifting interferometry (PSI) method. The principle of this method basically depends on recording several fringe patterns at different times by shifting the phase of one of the interfering beams and keeping the object nominally unchanged. The phase difference between the two interfering beams is normally achieved by translating or tilting a mirror of the optical setup via piezoelectric transducers (PZT) by changing the voltage to the PZT [13] -[15] .
The principal phase errors of PSI technique are non-linearities in the movement of the PZT performing the phase-stepping and miscalibration of phase step [16] . This phase error can be decreased by applying the compensated phase shifting algorithms [16] -[18] . There are different advantages of the PSI methods such as: rapid measurement, high measurement accuracy and good results even with low contrast fringes and the results independent of intensity variations across the pupil. Recently, Yassien [19] applied phase shifting interferometry PSI to study and determine the optical properties of PVDF fibres. It is found that the PSI method is relatively simple, accurate, and is capable of conducting fully automatic measurement of refractive index profiles for fibres.
This work is motivated to determine the opto-mechanical and structural physical properties of PTFE fibres using a fibre drawing device attached the phase shifting Mach-Zehnder interferometer. The phase shifting interferometry (PSI) method was used to analyze the obtained interference pattern and to determine the wrapped phase map which is used to define the contour line of phase shifted interference fringes. The birefringence and its relation to the drawing process were studied. Themolecular alignment effects in fibre drawing which is related to linear and possibly nonlinear optical properties of the polymer fibres were investigated.
2. Theoretical Considerations
2.1. Phase Shifting Technique
Phase shifting interferometry (PSI) method is used to determine the phase distribution encoded in an interferometric fringes [13] [20] . In this method, three or more phase shifted images are required to produce a wrapped phase map. Schwider et al. [21] applied a 5-position technique to determine interference phase, using phase step values of phase difference j = 0, π/2, π, 3π/2 and 2π. Accordingly, the intensities of these five interferograms can be written as:
 (1)
(1)
 (2)
(2)
 (3)
(3)
 (4)
(4)
and
 (5)
(5)
where  and
and  denote to the undesired irradiance variations arising from the non-uniform light reflection or transmission by a test object and
  is the phase distribution that contains the desired information. By solving the set of the intensity equations, the phase
  at each point in the interferogram can be determined using the 5-position technique from the following equation [21] ;
 (6)
(6)
The calculated phase by this technique is always preferable to the 4 position technique as the measurement errors are better and the formula takes less computation time [22] .
2.2. Refractive Index and Birefringence
Refractive index is the principal optical property of any material. There are two principal refractive indices of the fibre; one is n|| when the incident light is polarizing parallel to the fibre axis. The other is n^ in case of the perpendicular polarization state. The mean refractive index of the fibre for both states can be calculated using the following [4] :
 (7)
(7)
where idenotes the state of polarization of monochromatic light used which vibrates parallel || or perpendicular ^ to the fibre axis. nL is the refractive index of the immersion liquid, Z is the fringe shift length, l is the wavelength of light, t is the thickness of the fibre and b is the interfering spacing.
The simple method to test the level of molecular orientation in a polymer fibre is to determine its birefringence [1] [2] . The fiber’s birefringence (Dn) is the difference between the two main refractive indices, where Dn = n|| − n^.
2.3. Orientation Function
For a drawn fibre where the molecules are considered to be aligned with the direction of drawing but only randomly arranged in the transverse direction, the optical properties of the system can be specified by only two refractive indices n|| and n^. Hermans orientation function, f(q), is related to the refractive indices difference by the following equation [23] :
 (8)
(8)
where Dno is the maximum (intrinsic) birefringence of polymer fibres andits value equals 0.045 for PTFE fibres [8] .
2.4. Refractive Index Profile
The refractive index profile of a fibre reflects the variation of its refractive index across the fibre diameter. Hamza et al. [24] proposed an accurate mathematical expression for calculating the refractive index profile in which the refraction of the incident light beam inside the fibres layers were taken into consideration. The refractive index profile in the case of two-beam interferometry can be calculated using the following equation [25] :
 (9)
(9)
where R is the fiber radius, a is the layer thickness (a = R/N), N is the number of layers, Q and j are the limits of the layer numbers, n0 = nL is the liquid refractive index, nj and nQ are the refractive indices of the jth and Qth layers, respectively. dQ is the distance between the incident and the fiber centre, xQ is the distance between the emerging beam and the fiber centre, ZQ is the fringe shift corresponding to the point xQ in the two-beam interference pattern, l is the wavelength of light used and b is the interfering spacing.
2.5. Polarizability per Unit Volume
The obtained values of the refractive indices n|| and n^ of the fibre material can be used to calculate the polarizability per unit volume in case of light polarizing parallel P|| and perpendicular P^ to the fibre axis by application of the following Lorantz-Lorenz equation [26] :
 (10)
(10)
3. Experimental Techniques and Setup
The fibre drawing device [6] attached with the phase shifting Mach-Zehnder interferometer (Figure 1(a)) [15] is used to study the opto-mechanical properties of the PTFE fibres. A sample of certain length from the investigated fibre was fixed at its ends with two clamps of the drawing system. The sample was cold drawn to different draw ratios D ranging from D = 1.00 to 3.00 using the drawing device. Note, draw ratio D is a measure of the degree of stretching of a sample and it expressed as the ratio of the cross-sectional area of the undrawn sample to that of the drawn sample. The mechanism of the fibre cold drawing device was described elsewhere [6] . The fibre was immersed in a suitable liquid with a refractive index of 1.417 at room temperature T = 20˚C and it is quite close to its refractive index. A He-Ne laser with a wavelength of l = 632.8 nm was used for illumination.
A Piezo-transducer PZT in the reference arm, of the interferometer, acting as a phase shifting tool to obtain five phase shifted interferograms with phase step p/2 between two successive holograms. By changing the voltage applied to the PZT, a continuous phase-shift in the range of 0 - 2π can be obtained. The calibration of the PZT was done, for obtaining accurate phase measurements, using the phase-lock method with an accuracy of ±0.052 rad [16] . Two polarization states were obtained using a polarizer P and an analyzer A. One was used for determining the refractive index n|| for light whose electric vector was polarized parallel to the fiber axis and the other is used for determining the refractive index n^ for light whose electric vector was polarized perpendicular to the fiber axis. The polarization directions of light in the parallel and perpendicular directions according to the fibre axis are shown in Figure 1(b). A CCD camera connected to a PC was used to capture the resulting fringe pattern.
4. Results and Discussions
The phase shifting method (PSI) was used to determine the physical and mechanical properties of Polytetra-
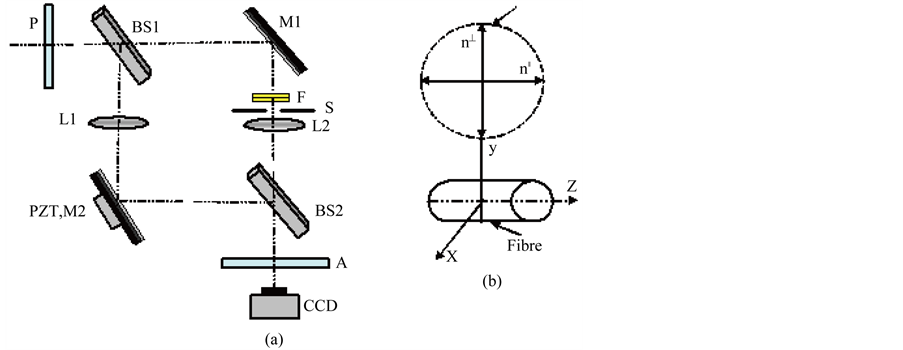
Figure 1. Experimental set-up of phase shifting Mach-Zehnder interferometer; A plane wave of a He-Ne laser is used: where P is a polarizer, A analyzer, BS1 and BS2 are to identically beams splitters, M1 mirror, PZT-M Pizo-transducer element which is used to introduce an shift to the reference wave, F Fibre under study, S Interferometer stage, L1 and L2 objectives which are adjusted at the same distance from the camera CCD (a). The polarization directions of light in the parallel and perpendicular directions according to the fibre axis (b).
fluoroethylene (PTFE) fibres. The reference mirror mounted on the PZT (Figure 1(a)) was used to vary the phase difference between two interfering beams. The PZT was calibrated for getting the proper phase shift between the data frames. The phase-lock and the sinusoidal extreme sensing methods were applied for PZT calibration [16] . In this method five phase-shifted intensity profiles of tilt fringes were displayed simultaneously on the screen of the monitor. If the PZT is calibrated, the obtained phase shifts are exactly 90˚, the last intensity profile will coincide with the first and the eye cannot see any offset between the two intensities. The accuracy of determining phase shifting by such method was ±3˚.
The interference patterns produced by phase shifting Mach-Zehnder interferometer attached with the fibre drawing device were used to give qualitative and quantitative information about the opto-mechanical properties of PTFE fibres. The experimentally shifted interferograms at phase shifts 0, p/2, p, 3p/2, 2p were obtained for PTFE fibres drawn at different draw ratios. Figure 2 and Figure 3 show two examples of the obtained phase shifted interferograms for PTFE fibres at draw ratio D = 1.4 for light polarizing parallel and perpendicular to the fibre axis, respectively. Using the obtained microinterferograms and Equation (6) the phase maps was calculated, in the parallel and perpendicular directions as shown in Figure 4(a) and Figure 5(a). The tangent function was within the interval {−p and +p} [27] . Each phase value was represented by the grey shade intensity at each point of the image, where the black one corresponds to −p and the white is +p, while the grey shade measures the intermediate intensity values between −p and +p. This modulation wrapping pattern appears in the phase map in
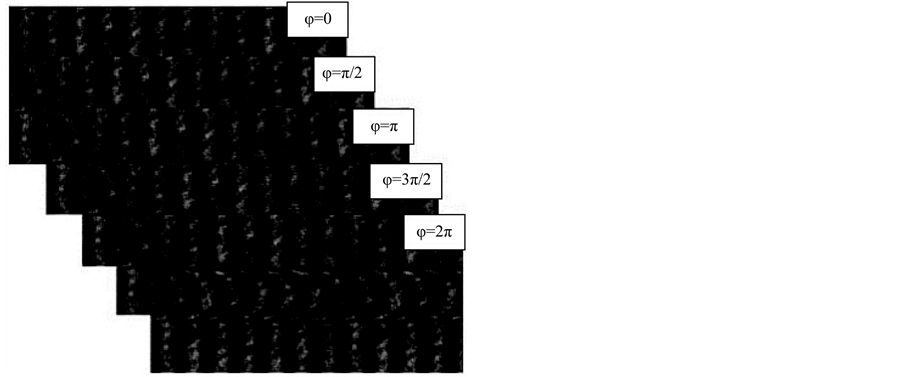
Figure 2. The five phase shifted recorded interferograms (j = 0, p¤2, p, 3p/2, 2p) for D = 1.4 for light polarizing parallel to the PTFE fibre axis.
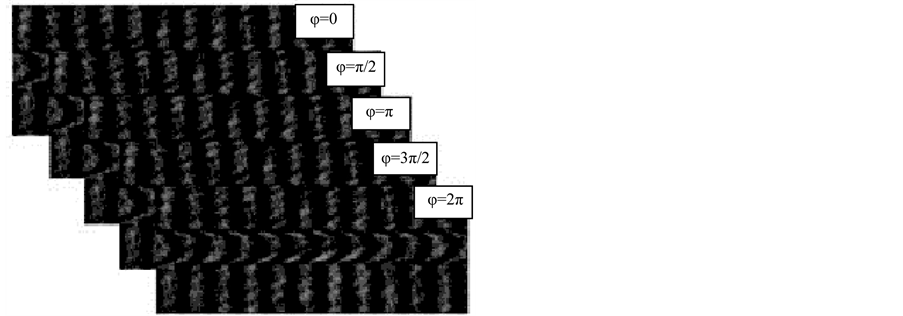
Figure 3. The five phase shifted recorded interferograms (j = 0, p¤2, p, 3p/2, 2p) for D = 1.4 for light polarizing perpendicular to the PTFE fibre axis.
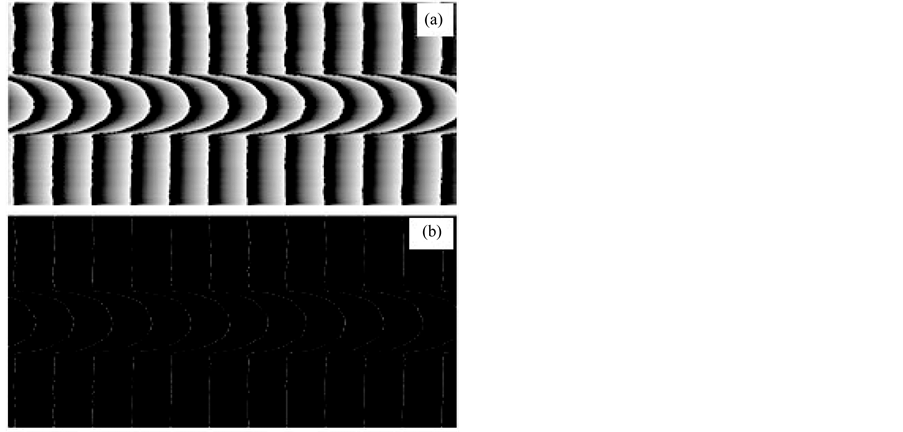
Figure 4. The obtained wrapped phase (a) and contour line interferograms (b), for D = 1.4 for light polarizing parallel to the PTFE fibre axis.
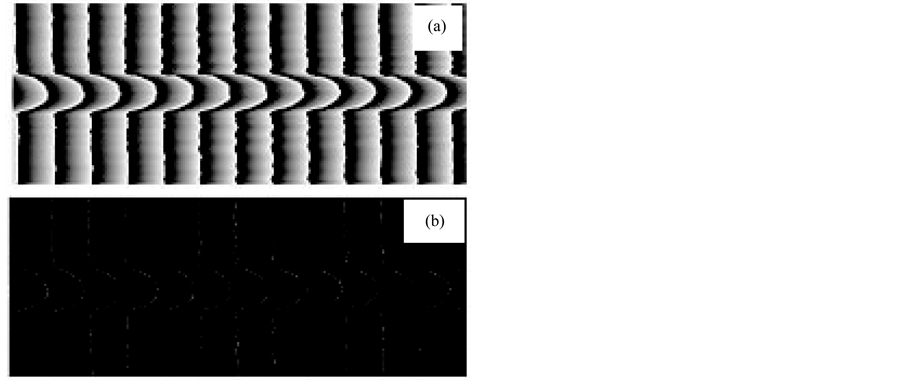
Figure 5. The obtained wrapped phase (a) and contour line interferograms (b), for D = 1.4 for light polarizing perpendicular to the PTFE fibre axis.
the areas that show phase change. This change corresponds to a variation from +p to −p or from −p to +p. The error in the phase shifting introduces errors in the wrapped phase map while the other errors are caused by the CCD camera and digital frame grabber. The noise components in the obtained phase map will also cause loss of accuracy in computing the wrapped phase. Using the wrapped phase, the contour map of the captured microinterferograms were obtained and shown in Figure 4(b) and Figures 5(b).
The obtained results of phase maps show that the PSI method utilises relatively less complicated algorithms and is simple. The method requires at least three images, with one restriction that the object must remain stationary while the fringes can be moved. PSI method offers high accuracy with low sensitivity to experimental errors especially in the noisy interference pattern. The method gives rapid measurement and good results for phase map even with low contrast fringes and the contour-line microinterferograms can be obtained. The accuracy of the PSI method can be increased by applying the compensated phase shifting algorithms [16] -[18] . These algorithms eliminate or minimize the harmonics of non-sinusoidal waveforms and the effect of systematic phaseshift errors which result from linear miss-calibration and spatial non-uniformity of the phase shifter. The improvements in the error-compensating capability of the algorithm for systematic errors are always followed by an increase in random noise. By increasing the samples of an algorithm, the random noise can be reduced while maintaining the error compensating capability for non-uniform phase shifts [18] .
The quantitative measurement of the refractive index is based on the determination of the phase distribution from the recorded and stored fringe patterns. The refractive indices n|| and n^ are calculated using the contour line interferograms and Equation (7). Figure 6 shows the relationship between the mean refractive indices (n|| and n^) and the draw ratios D of PTFE fibre. It is shown that, the refractive index n|| increases with increasing of the draw ratio while refractive index n^ decreases with increasing of draw ratio. This behavior can be understood by understanding the effect of the cold drawing mechanism. By increasing the draw ratio the molecules are oriented along the fiber axis. Therefore, the density of the molecules along the fiber axis increases and thus the refractive index for light polarized parallel to the fibre axis increases [1] [4] [5] . This implies more molecular alignment occurred in a parallel direction to the fibre axis. In the perpendicular direction, increasing of the drawing ratio the density was reduced and hence the refractive index of the fibre reduced.This indicates less molecular alignment occurred in a perpendicular direction to the fibre axis. Using the obtained values of refractive indices (n|| and n^), the birefringence was determined and hence the orientation function was calculated. Table 1 illustrates the variations of the refractive indices (n|| and n^), birefringence Dn and orientation function f(q) with the draw ratio. Figure 7 shows the relationship between the orientation function f(q) and the draw ratios D. It is clear that, the birefringence and orientation function of the fibre increases with the increasing of the draw ratio. This is due to that, in polymer fibre drawing process, the polymer matrix undergoes a chain stretching along the fibre axis. This will align the orientation of polymer molecules to the drawing (axial) direction. This mechanical anisotropy gives rise to optical anisotropy of the fibre in the form of birefringence. This indicates that the molecules constituting the fibre reoriented in the direction of drawing (more birefringent) during
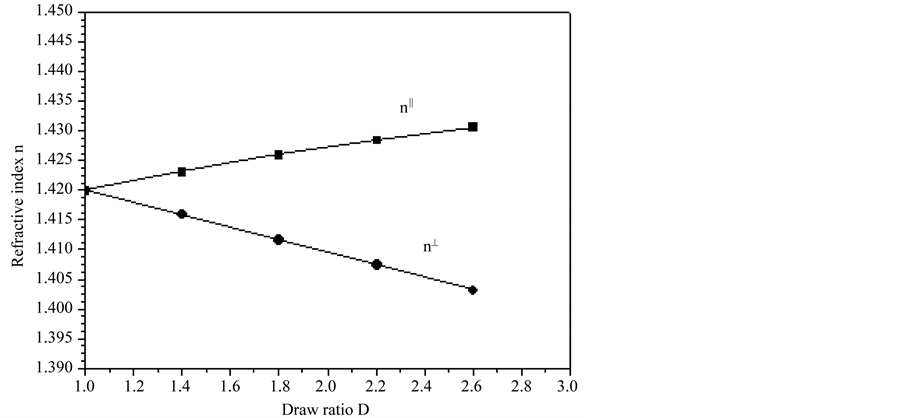
Figure 6. The relationship between refractive indices (n||, n^) and draw ratio D of the fibre.

Table 1. The variations of the refractive indices (n|| and n^), birefringence Dn and orientation function f(q) with the draw ratio.
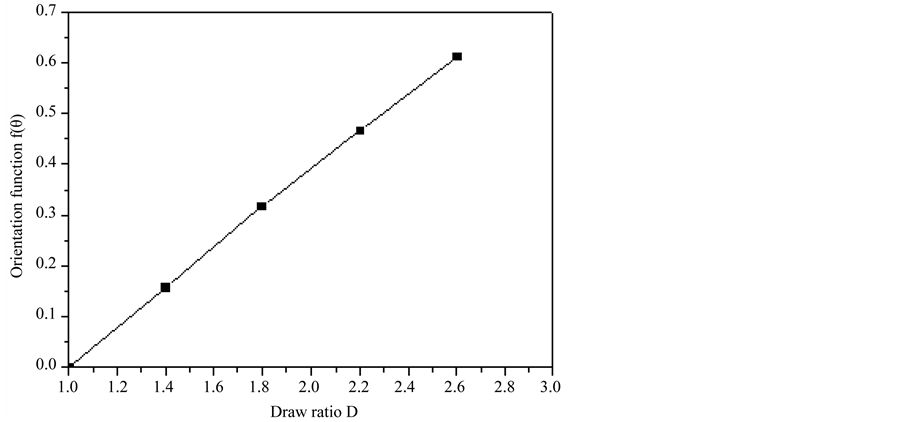
Figure 7. The relationship between orientation function f(q) and draw ratio D of the fibre.
the cold drawing process. This reflects the structure variation of the PTFE fibers at different draw ratios.
Using the contoured-line microinterferograms (Figure 4(b) and Figure 5(b)) and Equation(9), the refractive indices profiles of n|| and n^ for PTFE fibers are automatically determined at different draw ratios using the image analysis software programs designed by Hamza et al. [25] and are given in Figure 8 and Figure 9, respectively. These profiles represent the refractive index distribution across the fibre radius from the centre to the surface. As it can be seen the refractive index profile in parallel direction increases as the draw ratio increases, while the profile in perpendicular direction decreases with the increasing of draw ratio. The variations of refractive index distribution across the fibre radius with draw ratio confirm the results that obtained for refractive indices n|| and n^ with the draw ratio.
Using the obtained values of the refractive indices (n|| and n^), the polarizabilities per unit volume for light polarizing parallel P|| and perpendicular P^ to the fibre axis were determined at different draw ratio and the results are given in Figure 10. This figure indicates that the variation of the mean polarizability (P|| and P^) with the draw ratio are similar to those obtained for the refractive indices (n|| and n^) of drawn PTFE fibres. These polarizabilities determine the dynamical response of a bound system to external fields, and provide insight into a molecule’s internal structure [28] . The obtained results enable us to obtain detailed structure characteristics of the sample without changing the morphology of the material.
From the present study, it is clear that the optical properties of PTFE fibres were changed under the effect of cold drawing actions. When PTFE fibre structure is deformed by the cold-drawing process, the individual crystalline particles slide past each other, to take up new position, where they are held together just as strongly as in the original material, owing to the formation of fresh inter-atomic bonds. For this reason, the molecules pass from un-oriented state to oriented state. Studying the continuous mechanical and optical changes reflects information about the increase in orientation.
The obtained results of the opto-mechanical properties of PTFE fibres using phase shifting interferometry PSI are found to be in high accuracy and agreement with those obtained by literature [5] [8] . The accuracy in the measurement of the mean refractive index and birefringence is 4 × 10⁻⁴ [15] [19] . These results demonstrate that PSI method is an effective technique for studying physical and mechanical properties of fibres.
5. Conclusion
The phase shifting interferometry (PSI) method was used to determine precisely the opto-mechanical properties of PTFE fibres. The method was used to analyse the interference fringe pattern produced by phase shifting Mach-Zehnder interferometer. The method gives high accuracy for extracting phase map from the obtained microinterferograms. The mechanical cold-drawing attached with the PSI method is a promised technique for
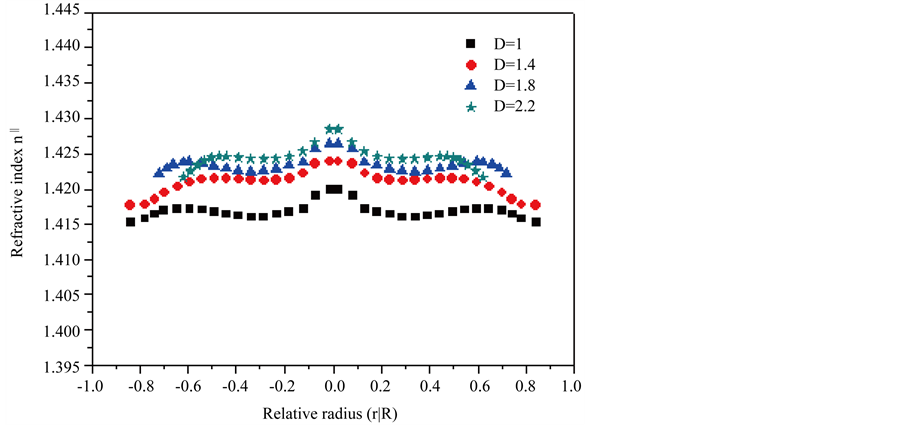
Figure 8. The refractive index profile of n|| at different draw ratio D of the fibre.
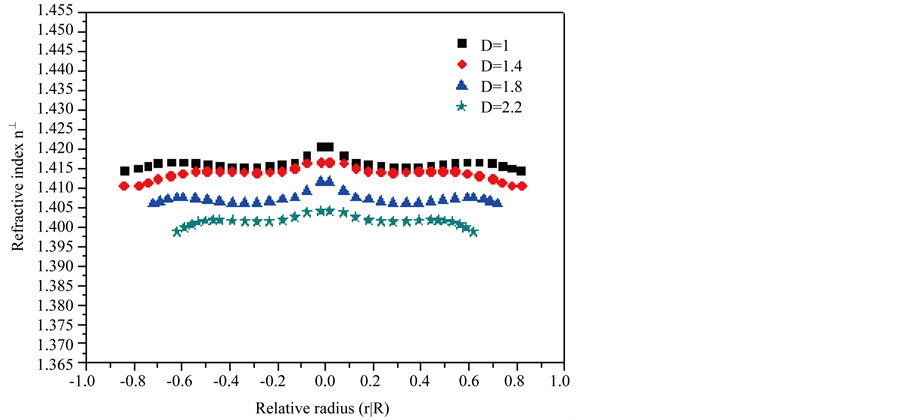
Figure 9. The refractive index profile of n^ at different draw ratio D of the fibre.
studying the opto-mechanical properties of fibres. The reorientation produced due to the cold drawing process indicates that PTFE fibre material has a modified structure due to the cold drawing process. The PSI method showed good results for enhancing the noisy fringe pattern and for obtaining contour line microinterferograms. The molecular alignment effect in fibre drawing and its relation with nonlinear optical properties of the PTFE fibres was studied. There lationships between refractive indices and birefringence with draw ratio were determined. The measurements of the refractive index and birefringence profiles using the automatic fringe image analysis technique, considering the fibre has Q layers, throw light on the structure of each layer and detect the structural properties across the fibre radius. They are also play an important role in the development of the mechanical properties of PTFE fibre. The used method enables us to conduct fully automatic fast measurement of opto-mechanical properties of PTFE fibres. The obtained results using the PSI method are found to be in good agreement with literatures.
Acknowledgments
The financial support of this work is provided from the King Khalid University, Kingdom of Saudi Arabia under
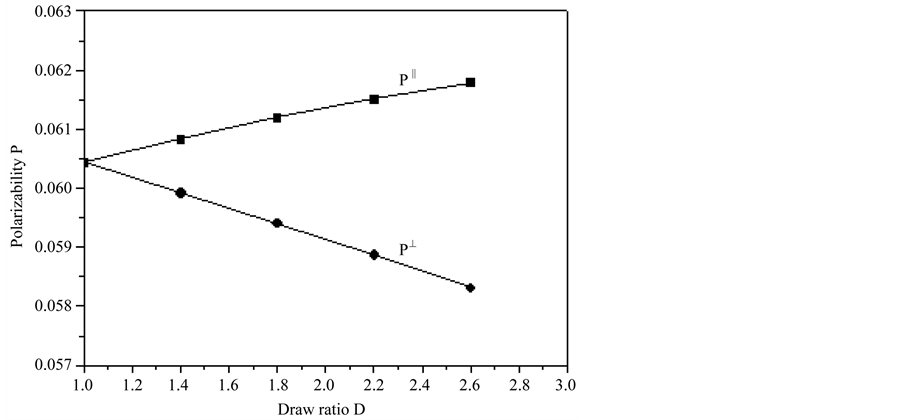
Figure 10. The relationship between polarizabilities (P||, P^) and draw ratio D of the fibre.
research project kku_S088_33.
References
- Ward, I.M. (1997) Structural and Properties of Oriented Fibres. Chapman and Hall, London. http://dx.doi.org/10.1007/978-94-011-5844-2
- Gaur, A.H. and De Vries, H. (1975) On the Refractive Indexes and Birefringence of Nylon 6 Yarns as a Function of Draw Ratio and Strain. Journal of Polymer Science Part B: Polymer Physics, 13, 835. http://dx.doi.org/10.1002/pol.1975.180130415
- Ajji, A., Cole, K.C., Dumouline, M.M. and Ward, I.M. (1997) Orientation of Amorphous Poly(Ethylene Terephthalate) by Tensile Drawing, Roll-Drawing, and Die-Drawing. Issue Polymer Engineering & Science, 37, 1801. http://dx.doi.org/10.1002/pen.11829
- Barakat, N. and Hamza, A.A. (1990) Interferometry of Fibrous Materials. Adam Hilger, Bristol.
- El-Dessouky, H.M., Mahmoudi, M.R., Lawrence, C.A., Yassien, K.M., Sokkar, T.Z.N. and Hamza, A.A. (2009) On the Physical Behaviour of Isotactic Polypropylene Fibres Extruded at Different Draw-Down Ratios: I. Optical Properties and Cold-Drawing. Polymer Engineering & Science, 49, 2116-2124.
- Hamza, A.A., El-Farahaty, K.A. and Helaly, S.A. (1998) Optica Applicata, 18, 133.
- Hamza, A.A., Sokkar, T.Z.N., Belal, A.E., El-Dessouky, H.M. and Yassien, K.M. (2007) Measurement of the Spectral Dispersion Curves of Low Birefringence Polymer Fibres. Optics and Lasers in Engineering, 45, 922-928. http://dx.doi.org/10.1016/j.optlaseng.2007.03.005
- El-Dessouky, H.M., Lawrence, C.A., Voice, A.M., Lewis, E.L.V. and Ward, I.M. (2007) An Interferometric Prediction of the Intrinsic Optical Properties for Cold-Drawn iPP, PTFE and PVDF Fibres. Journal of Optics: A Pure and Applied Optics, 9, 1041-1047. http://dx.doi.org/10.1088/1464-4258/9/11/012
- El-Bakary, M.A. (2007) The Effect of Mechanical Drawing on Optical and Structural Properties of Nylon 6 Fibres. Optics & Laser Technology, 39, 1273. http://dx.doi.org/10.1016/j.optlastec.2006.07.014
- El-Bakary, M.A. (2008) Determining the Opto-Mechanical and Geometrical Properties of High-Density Polyethylene Fibres. Optics and Lasers in Engineering, 46, 328. http://dx.doi.org/10.1016/j.optlaseng.2007.11.007
- Yassien, K.M. and Agour, M.A. (2011) Digital Holographic Interferometry: Opto-Mechanical Properties of Fibers. Polymer Engineering and Science, 51, 1218-1225. http://dx.doi.org/10.1002/pen.22006
- Schnars, U. and Jueptner, W. (2005) Digital Holography. Springer-Verlag, Berlin.
- Creath, K. (1988) Phase-Measurement Interferometry Techniques. Elsevier, Amsterdam.
- Cordero, R., Molimard, J., Labbe, F. and Martinez, A. (2008) Strain Maps Obtained by Phase-Shifting Interferometry: An Uncertainty Analysis. Optics Communications, 281, 2195. http://dx.doi.org/10.1016/j.optcom.2007.12.005
- Yassien, K.M., Agour, M.A., El-Dessouky, H.M. and Kopylow, C.V. (2010) On the Digital Holographic Interferometry of Fibrous Materiaals, I. Optical Properties of Polymer and Optical Fibers. Optics and Lasers in Engineering, 48, 555-560. http://dx.doi.org/10.1016/j.optlaseng.2009.12.003
- Cheng, Y. and Wyant, J. (1985) Phase Shifter Calibration in Phase-Shifting Interferometry. Applied Optics, 24, 3049-3052. http://dx.doi.org/10.1364/AO.24.003049
- Zhang, H., Lalor, M.J. and Burton, D.R. (1999) Error-Compensating Algorithms in Phase-Shifting Interferometry: A Comparison by Error Analysis. Optics and Lasers in Engineering, 31, 381-400. http://dx.doi.org/10.1016/S0143-8166(99)00017-2
- Hibino, K. and Yamauch, M. (2000) Phase-Measuring Algorithms to Suppress Spatially Nonuniform Phase Modulation in a Two-Beam Interferometer. Optical Review, 7, 543-549. http://dx.doi.org/10.1007/s10043-000-0543-6
- Yassien, K.M. (2009) Comparative Study on Determining the Refractive Index Profile of Polypropylene Fibres Using Fast Fourier Transform and Phase Shifting Interferometry. Journal of Optics A: Pure and Applied Optics, 11, Article ID: 075701. http://dx.doi.org/10.1088/1464-4258/11/7/075701
- Karaalioglu, C. and Skarlatos, Y. (2004) Measurement of Thin Film Thickness by Electronic Speckle Pattern Interferometry. Optics Communications, 234, 269-276. http://dx.doi.org/10.1016/j.optcom.2004.02.025
- Schwider, J., Burow, R., Elssner, K.E., Grzanna, R., Spolaczyk, R. and Merkel, K. (1983) Digital Wave-Front Measuring Interferometry: Some Systematic Error Sources. Applied Optics, 22, 3421-3432. http://dx.doi.org/10.1364/AO.22.003421
- Van Wingerden, J., Frankena, H.J. and Smorenburg, C. (1991) Linear Approximation for Measurement Errors in Phase Shifting Interferometry. Applied Optics, 30, 2718-2729. http://dx.doi.org/10.1364/AO.30.002718
- Hemsley, D.A. (1989) Applied Polymer Light Microscopy. Elsevier Applied Science Publisher Ltd., London.
- Hamza, A.A., Sokkar, T.Z.N., Ghander, A.M., Mabrouk, M.A. and Ramadan, W.A. (1995) On the Determination of the Refractive Index of a Fibre. II. Graded Index Fibre. Pure and Applied Optics, 4, 161-177. http://dx.doi.org/10.1088/0963-9659/4/3/004
- Hamza, A.A., Sokkar, T.Z.N., Mabrouk, M.A. and El-Morsy, M.A. (2000) Journal of Applied Polymer Science, 77, 3099.
- Samuels, R. (1974) Structure Polymer Properties. Wiley and Sons, New York.
- Gesualdi, M.R.R., Soga, D. and Muramatsu, M. (2007) Surface Contouring by Phase-Shifting Real-Time Holography Using Photorefractive Sillenite Crystals. Optics & Laser Technology, 39, 98-104. http://dx.doi.org/10.1016/j.optlastec.2005.05.004
- Zhou, L., Lee, F.X., Wilcox, W. and Christensen, J. (2002) Magnetic Polarizability of Hadrons from Lattice QCD. European Organization for Nuclear Research (CERN), Meyrin.
NOTES

*Corresponding author.